

Abstract
Purpose:
To investigate the relationship between longitudinal changes in macular thickness measurements from optical coherence tomography (OCT) and changes in central visual field (VF) in glaucoma patients with central or advanced damage at baseline.
Design:
Longitudinal cohort study.
Subjects:
116 eyes with ≥3 years of follow-up and ≥5 macular OCT images and central 10° VF tests were selected.
Methods:
OCT superpixels and VF locations were matched correcting for retinal ganglion cell displacement. Superpixel thickness and visual field (VF) total deviation (TD) values, in both logarithmic and linear scales, were averaged within 3 eccentricities (3.4°, 5.6°, and 6.8°) and superior and inferior he miretinas and hemifields. We estimated pointwise TD rates of change and rates of change at superpixels for full macular thickness (FMT), ganglion cell complex (GCC), ganglion cell-inner plexiform layer (GCIPL) and ganglion cell layer (GCL). Correlation of structural and functional (SF) rates of change were investigated with parametric tests. We compared the proportion of worsening and positive slopes for superpixels and VF test locations (negative vs. positive rates of change with p<0.05) throughout the follow-up period. Permutation analyses were used to control specificity.
Main Outcomes Measure:
Magnitude of correlation between structural and functional rates of change and proportion of worsening and positive slopes as a function of follow-up time.
Results:
The median (IQR) follow-up and number of exams were 4.2 (3.7–4.6) years and 8 (7–9), respectively. The highest correlation of change rates was observed at 3.4° and 5.6° eccentricities (r=0.24, 0.41, 0.40, and 0. 40 for FMT, GCC, GCIPL and GCL for 3.4° eccentricity and =0.28, 0.32, 0.31 and 0.32 fo r FMT, GCC, GCIPL and GCL for 5.6° eccentricity, respectively). Although GCC measures demonstrated the highest overall longitudinal SF correlations, the differences were not statistically significant. Significant structural worsening was more frequently detected than functional deterioration at 3- and 5-year timepoints (p<0.025). Permutation analyses also confirmed this finding.
Conclusion:
Correlations between central structural and functional rates of change were weak to fair in this cohort. Structural changes were detected more frequently than functional changes. Measurements of both structure and function are required for optimal detection of central progression.
Longitudinal macular SF relationships were weak to fair in a cohort of glaucoma patients with central or advanced damage at baseline. Ganglion cell complex rates of change showed the highest correlations with visual field change rates. Worsening of structural measures were more efficiently detected compared to functional changes. Monitoring macular structural and functional measures is required in eyes with evidence of central damage.
Introduction
Macular optical coherence tomography (OCT) has become the test of choice for evaluation of the retinal ganglion cell (RGC) axonal complex in the central retina, which comprises up to half of the total number of RGCs in the retina.1,2 Progressive loss of RGCs can be expected in treated glaucoma.3,4 Recent studies suggest that macular OCT imaging could be helpful for the detection of disease deterioration.5–8 It is generally accepted that measuring both structure and function could lead to more efficient and timely detection of glaucoma progression and optimize management of glaucoma patients.
Structure-function (SF) relationships have been a topic of significant interest in the field of clinical glaucoma research.9–19 Structure-function relationships vary as a function of glaucoma severity and magnitude; the structure-function correlation tends to be lower in early glaucoma and reaches its peak in moderate disease and subsequently decreases with advancing glaucoma.9,20,21 Within the macula, a given central visual field (VF) location may correspond to slightly different area of the retina as a function of individual patient’s anatomy.18,22 One reason for this discordance is the length of Henle’s fibers and hence, displacement of RGCs from their corresponding photoreceptors. Variations of Henle’s fiber layer was evaluated in a histological study by Drasdo et al.23 Raza et al. demonstrated that central SF relationships improved after adjustment for the average displacement of RGCs in the central macula.24 Hood and co-investigators found very good topographic agreement between RGC damage, based on the combined ganglion cell layer (GCL) and inner plexiform layer (IPL) thickness detected with macular OCT imaging, and central 10° VF measurements.25 Miraftabi and colleagues investigated local cross-sectional SF relationships in the central macula and reported moderate correlations between macular thickness measurement at 3°×3° superpixels and central 10° test locations.15,24,26 We recently demonstrated that within- eye SF relationships over time demonstrated less variability as compared to those observed in a pooled sample of eyes.27 Changes in structural and functional measurements within individual eyes over time may, therefore, be more likely to be correlated compared to cross-sectional measurements. However, factors such as foveal shape, fovea-disc axis angle, location of the temporal raphe amongst others may affect the spatial and temporal aspects of such correlations.28,29 If structural worsening precedes functional deterioration, measurements of structural changes may help predict functional loss and hence, allow clinicians to act sooner.
The goal of the present study is to investigate longitudinal SF relationships between local and sectoral macular OCT thickness and corresponding central VF measurements in a cohort of eyes with advanced or central VF damage at baseline. We also compared the proportion of structural and functional measures demonstrating significant change over time and investigated the influence of baseline structural and functional measurements on subsequent rates of change. Better understanding of longitudinal SF relationships could help design better algorithms for detection of change over time.
Methods
One hundred sixteen eyes from 116 glaucoma patients enrolled in the Advanced Glaucoma Progression Study (AGPS) were selected. The AGPS is an ongoing longitudinal, prospective, observational study at the Stein Eye Institute, University of California Los Angeles (UCLA) to better understand and optimize detection of glaucoma deterioration in more advanced stages. The current study was carried out in accordance to the tenets of the declaration of Helsinki and the Health Insurance Portability and Accountability Act (HIPAA) and was approved by the UCLA’s Human Research Protection Program.
Inclusion criteria for eyes enrolled in the current study were: 1) clinical diagnosis of primary open-angle glaucoma, pseudoexfoliative glaucoma, pigmentary glaucoma, or primary angle-closure glaucoma; 2) age between 40–80 years; 3) best corrected visual acuity ≥20/50; 4) five or more central 10° VFs and macular OCT images over 3 or more years of follow-up; and 5) no significant confounding retinal or neurological disease. All study eyes underwent a complete eye exam at baseline, macular imaging with Spectralis SD-OCT (Heidelberg Engineering®, Germany) and SITA standard 24–2 and central 10° VFs with Humphrey Field Analyzer (Carl Zeiss Meditec®). Clinical examinations and OCT and VF testing were repeated every 6 months. Evidence of advanced glaucoma was defined in this study as VF mean deviation (MD) of −6.0 dB or worse, or evidence of central VF involvement defined as presence of ≥2 test locations with p <0.05 on the pattern deviation plot within the central 10 degrees on the 24–2 standard achromatic VFs confirmed at least once.
Macular imaging and VF testing
The Posterior Pole Algorithm (PPA) of the Spectralis SD-OCT acquires 61 horizontal B-scans spanning a 30°×25° wide area, pa rallel to the fovea-Bruch’s membrane opening axis; each B-scan consists of 768 A-scans. The B-scans are repeated 9–11 times to decrease speckle noise and improve the image quality. Segmentation of the individual retinal layers was carried out with the Glaucoma Module Premium Edition (GMPE) software; thickness data were averaged and an 8×8 grid of thickness measurement was created for the layer of interest, providing 64 3°×3° superpixels in the central 24×24° of the macula (Fi gure 1). Good quality macular SD-OCT images were defined as those with quality factor >15 and no major artifacts on all B-scans and absence of confounding macular pathology. Segmentation of macular layers was checked and corrected manually if required. Data was exported as XML files and the right eye format was used for all eyes. A special plug-in software on Spectralis OCT enabled us to export the 8×8 array of thickness measurements aligned horizontally and not tilted along the FoBMO angle. The macular layers of interest in this study were the full macular thickness (FMT), ganglion cell complex (GCC), ganglion cell-inner plexiform layer (GCIPL) and GCL (Figure 2).
Figure 2.

Macular layers of interest that were used in this study for estimating structure-function relationships.
The 10–2 pattern of the Humphrey Field Analyzer was used to measure threshold sensitivity in the central 10° of the VF. Visual field examinations performed within 3 months of macular OCT images were selected as matching exams. We included VFs with false positive, false negative and fixation loss rates less than 15%. The 10–2 pattern measures VF sensitivity at 68 test locations 2° apart on vertical and horizontal axes within the 10° of the fixation point. Visual f ield data were exported as XML files and total deviation (TD) values were extracted.
Mapping of macular GCIPL and 10–2 VF measurements
Superpixels and VF test locations:
We correlated VF locations with individual macular superpixels within the central 18° of macul a after adjusting for retinal ganglion cell displacement, as shown in Figure 3.23,24 Some superpixels correspond to 2 or 3 VF locations; we used the average TD for those locations before correlating structural and functional measurements. VF locations were flipped vertically so that they matched the corresponding superpixels in the presented images. There was a total of 40 superpixels with corresponding VF measurements on which final analyses were performed (Figure 3).
Figure 3.
An anatomically accurate overlay of the test locations from 10–2 visual field onto the macular 8×8 grid after adjusting for the retinal ganglion cell displacement.
Definition of circles (eccentricities):
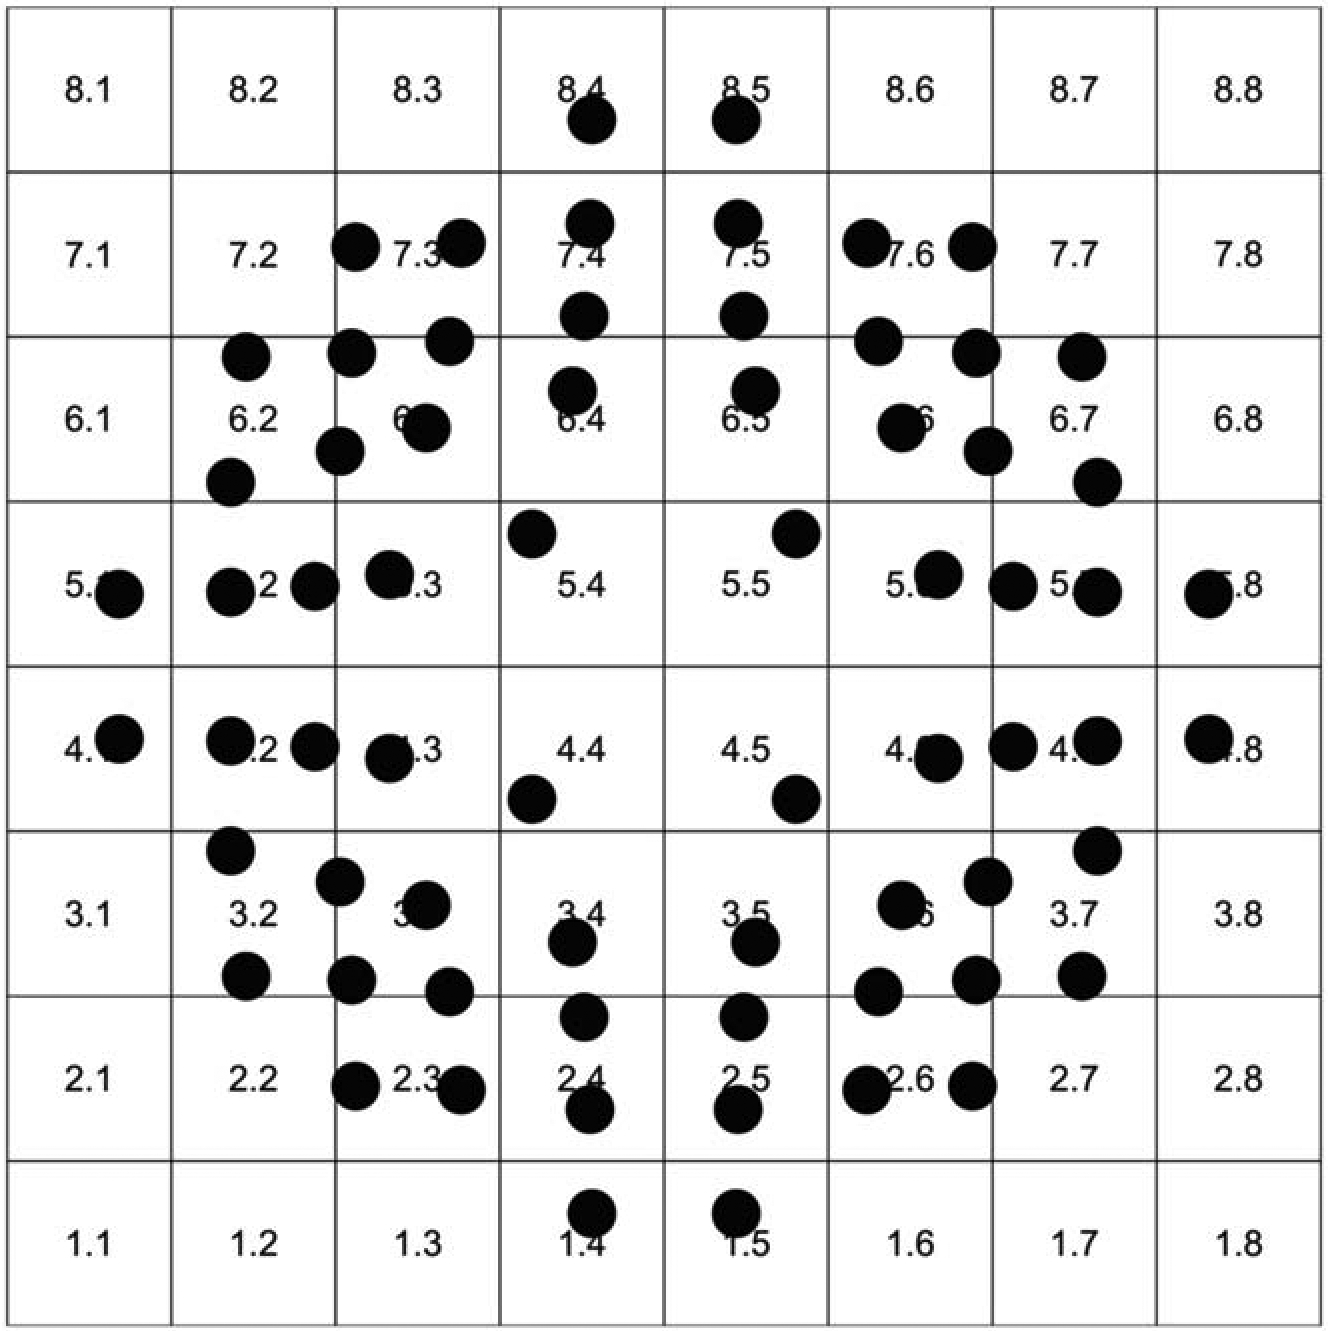
Similar to the study by Miraftabi et al., we grouped the central 24 superpixels and 44 VF locations into 3 concentric circles (3.4°, 5.6°, and 6.8° eccentricities from the fovea, Figure 4) called circle 1, 2, and 3, respectively, in this study.15 There are a total of 4 superpixels on circle 1, 8 superpixels on circle 2, and 12 superpixels on circle 3. We averaged all superpixels and VF test locations on each circle for SF correlations.
Figure 4.

The 3 eccentricities defined in this study for accounting for changes in the macular thickness as a function of distance from the fovea: circle 1, 3.4°; circle 2, 5.6°; and circle 3, 6.8°.
Definition of hemiretina and hemifield regions:
We also defined superior and inferior hemiretina and hemifield regions and used the mean macular layer thickness and VF TD values in corresponding structural and functional hemiregions to assess SF relationships.
For all statistical analyses, we unlogged the TD values before averaging them and converted the linear average back to logarithmic scale and estimated the rates of change in logarithmic scale. We also performed another set of analyses using converted TD values in the linear scale and therefore, estimated the correlation between structure and function with both expressed in the linear scale.16,22
Statistical Analyses
Trend-Based Analyses
We estimated the rates of change for macular layers of interest and VF TD values with a linear regression model and measured correlations of structural and functional rates of change with parametric tests within the pooled central 40 superpixels and VF test locations, 3 eccentricities and corresponding hemiretinas and hemifields. Scatterplots were constructed for qualitative review of the longitudinal SF relationships with the x axis showing rates of structural change (μm/year) and the y axis displaying rates of functional change (dB/year).
Definition of worsening or positive rates of change-
Worsening of a superpixel, test location, circles, or hemiretina / hemifield region was defined as a significant negative rate of change (p <0.05) whereas a positive slope was defined as a rate of change >0 with p <0.05. We measured the proportion of worsening and positive slopes for central superpixels and VF test locations starting at 2 years of follow-up (i.e., when a minimum of 5 tests were available) through 5.5 years of follow-up. We applied McNemar’s test to compare the proportion of worsening and positive-slope superpixels and VF test locations after 3 and 5.5 years of follow-up considering a p <0.025 as significant according to Bonferroni’s correction. We also compared the proportion of significant negative, significant positive and nonsignificant rates of change for structural and functional outcomes in 3×3 tables for all outcomes of interest.
To better control the specificity for detection of change with structural and functional measures, we applied permutation analyses and estimated rates of change at macular superpixels (GCC thickness) and VF test locations (TD values) 5000 times for follow-up periods from 2 through 5.5 years.30 We defined the 95% confidence intervals for the individual estimated slopes and considered rates of change falling below the 2.5% cutoff point as representing ‘true’ worsening.
We created gray scale maps of average structural and functional normalized rates of change in all eyes for the central 40 superpixels and VF test locations to explore the topography of SF correlations. We plotted the structural and functional rates of change within the central 40 superpixels against their corresponding baseline values and estimated the association with nonparametric correlations.
Event Based Analyses
We calculated the differences between the final and baseline measurements for all macular and VF outcomes including the central 40 superpixels and VF test locations, 3 eccentricities and corresponding hemiretinas and hemifields and investigated the correlation between the absolute changes in structure and function from baseline. On the bivariate plots, the x axis represents the change from baseline for structural measures (μm) and y axis displays difference from baseline for functional measures (dB). All the above analyses were repeated using change from baseline instead of rates of change.
Results
One hundred sixteens eyes of 116 patients were enrolled. Table 1 demonstrates the demographic and baseline clinical characteristics of the study sample. The median (IQR) follow-up time, number of visits, baseline central 10° VF MD and baseline 24–2 MD were 4.2 (3.7–4.6) years, 8 (7–9), −7.6 (−11.9 to −3.8) dB, and −6.8 (−12.2 to −4.3) dB, respectively. Table 2 displays the rates of change for the 4 macular structural parameters and VF TD values at the 3 eccentricities and the superior and inferior hemiretina regions.
Table 1.
Demographic and clinical characteristics of the study eyes.
| Age (years) | |
| Mean (SD) | 67.2 (±8.5) |
| Gender (%) | |
| Female | 62% |
| Male | 38% |
| Ethnicity (%) | |
| white | 52% |
| Asian | 20% |
| African American | 16% |
| Hispanic | 12% |
| Baseline 10–2 MD (dB) | |
| Median (IQR) | −7.6 (−11.9 to −3.8) |
| Final 10–2 MD (dB) | |
| Median (IQR) | −9.2 (−13.4 to −5.6) |
| Baseline 24–2 MD (dB) | |
| Median (IQR) | −6.78 (−12.22 to −4.28) |
| Final 24–2 MD (dB) | |
| Median (IQR) | −8.42 (−15.33 to −5.24) |
| Baseline FMT (μm) | |
| Mean (SD) | 267 (±28) |
| Baseline GCC (μm) | |
| Mean (SD) | 75 (±12) |
| Baseline GCIPL (μm) | |
| Mean (SD) | 48 (±10) |
| Baseline GCL (μm) | |
| Mean (SD) | 25 (±6) |
| Follow up (years) | |
| Median (IQR) | 4.2 (3.7–4.6) |
| Number of exams | |
| Median (IQR) | 8 (7–9) |
Table 2.
Rates of change (μm/year) of the 4 macular outcomes and visual field total deviation measurements (dB/year) at 3 macular eccentricities and two hemiregions.
| FMT | GCC | GCIPL | GCL | VF TD | |
|---|---|---|---|---|---|
| Region | |||||
| 3.4° Eccentricity | −0.95 | −0.71 | −0.49 | −0.29 | −0.06 |
| 5.6° Eccentricity | −1.32 | −0.76 | −0.54 | −0.32 | −0.11 |
| 6.8° Eccentricity | −1.18 | −0.42 | −0.24 | −0.11 | −0.13 |
| Superior hemiregion | −0.99 | −0.44 | −0.22 | −0.12 | −0.12 |
| Inferior hemiregion | −1.22 | −0.48 | −0.27 | −0.13 | −0.13 |
FMT; full macular thickness, GCC; ganglion cell complex, GCIPL; ganglion cell inner plexiform layer, GCL; ganglion cell layer.
Table 3 shows the correlations for structural and functional rates of change in the central 40 superpixels, 3 circles, and the corresponding hemiretina and hemifields. The highest correlations were observed on circles 1 and 2 (3.4° and 5.6° eccentricities); the inferior hemiretina and superior hemifield demonstrated higher correlations than the superior hemiretina and inferior hemifield for all macular outcomes. Results based on functional measurements expressed in the linear scale were similar to those for logarithmic scale except that a higher magnitude of correlations was observed on circle 2 compared to circle 1 (supplemental Table 1). Overall, inner macular outcome measures showed higher correlations than FMT; GCC displayed the highest overall SF correlations among the inner macular measures; however, the differences in the magnitude of coefficients were small and there was significant overlap of the 95% confidence intervals among inner macular outcomes. Figure 5 shows scatterplots of functional vs. structural rates of change at 3.4° e ccentricity (circle 1) for the 4 macular parameters investigated in this study. A significant amount of variability is observed on all plots, which is consistent with the weak to fair correlation coefficients (Table 3).
Table 3.
Correlation of structural and functional rates of change and difference from baseline in the central 40 superpixels, 3 eccentricities and corresponding hemiretinas and hemifields. The correlation coefficient and corresponding 95 % confidence interval are based on Pearson’s correlation.
| Rates of change | FMT | GCC | GCIPL | GCL | ||||
|---|---|---|---|---|---|---|---|---|
| rho | 95% Cl | rho | 95% Cl | rho | 95% Cl | rho | 95% Cl | |
| Indicator | ||||||||
| All Superpixels | 0.10 | 0.07–0.13 | 0.15 | 0.12–0.17 | 0.11 | 0.08–0.14 | 0.13 | 0.10–0.15 |
| 3.4° Eccentricity | 0.24 | 0.06–0.40 | 0.41 | 0.25–0.55 | 0.40 | 0.24–0.54 | 0.40 | 0.23–0.54 |
| 5.6° Eccentricity | 0.28 | 0.11–0.44 | 0.32 | 0.15–0.48 | 0.31 | 0.13–0.46 | 0.32 | 0.15–0.48 |
| 6.8° Eccentricity | 0.12 | −0.06–0.29 | 0.15 | −0.02–0.33 | 0.05 | −0.13–0.23 | 0.05 | −0.12–0.23 |
| Superior hemiretina and inferior hemifield | 0.17 | −0.01–0.34 | 0.20 | 0.01–0.36 | 0.12 | −0.05–0.30 | 0.17 | −0.01–0.34 |
| Inferior hemiretina and superior hemifield | 0.25 | 0.07–0.41 | 0.35 | 0.17–0.50 | 0.27 | 0.09–0.43 | 0.21 | 0.03–0.37 |
| Difference from Baseline | FMT | GCC | GCIPL | GCL | ||||
| rho | 95% CI | rho | 95% CI | rho | 95% CI | rho | 95% CI | |
| Indicator | ||||||||
| All Superpixels | 0.06 | 0.03–0.09 | 0.12 | 0.09–0.14 | 0.06 | 0.04–0.09 | 0.09 | 0.06–0.12 |
| 3.4° Eccentricity | 0.19 | 0.01–0.36 | 0.32 | 0.14–0.47 | 0.29 | 0.12–0.45 | 0.29 | 0.12–0.45 |
| 5.6° Eccentricity | 0.29 | 0.11–0.45 | 0.35 | 0.18–0.50 | 0.30 | 0.12–0.45 | 0.29 | 0.12–0.45 |
| 6.8° Eccentricity | 0.07 | −0.10–0.25 | 0.11 | −0.07–0.28 | −0.02 | −0.20–0.15 | 0.04 | −0.22–0.14 |
| Superior hemiretina and Inferior hemifield | 0.11 | −0.07–0.28 | 0.17 | 0.00–0.34 | 0.09 | −0.08–0.27 | 0.15 | −0.02–0.32 |
| Inferior hemiretina and superior hemifield | 0.27 | 0.09–0.43 | 0.30 | 0.12–0.46 | 0.19 | 0.01–0.36 | 0.13 | −0.04–0.31 |
FMT; full macular thickness, GCC; ganglion cell complex, GCIPL; ganglion cell inner plexiform layer, GCL; ganglion cell layer, CI; confidence interval.
Figure 5.
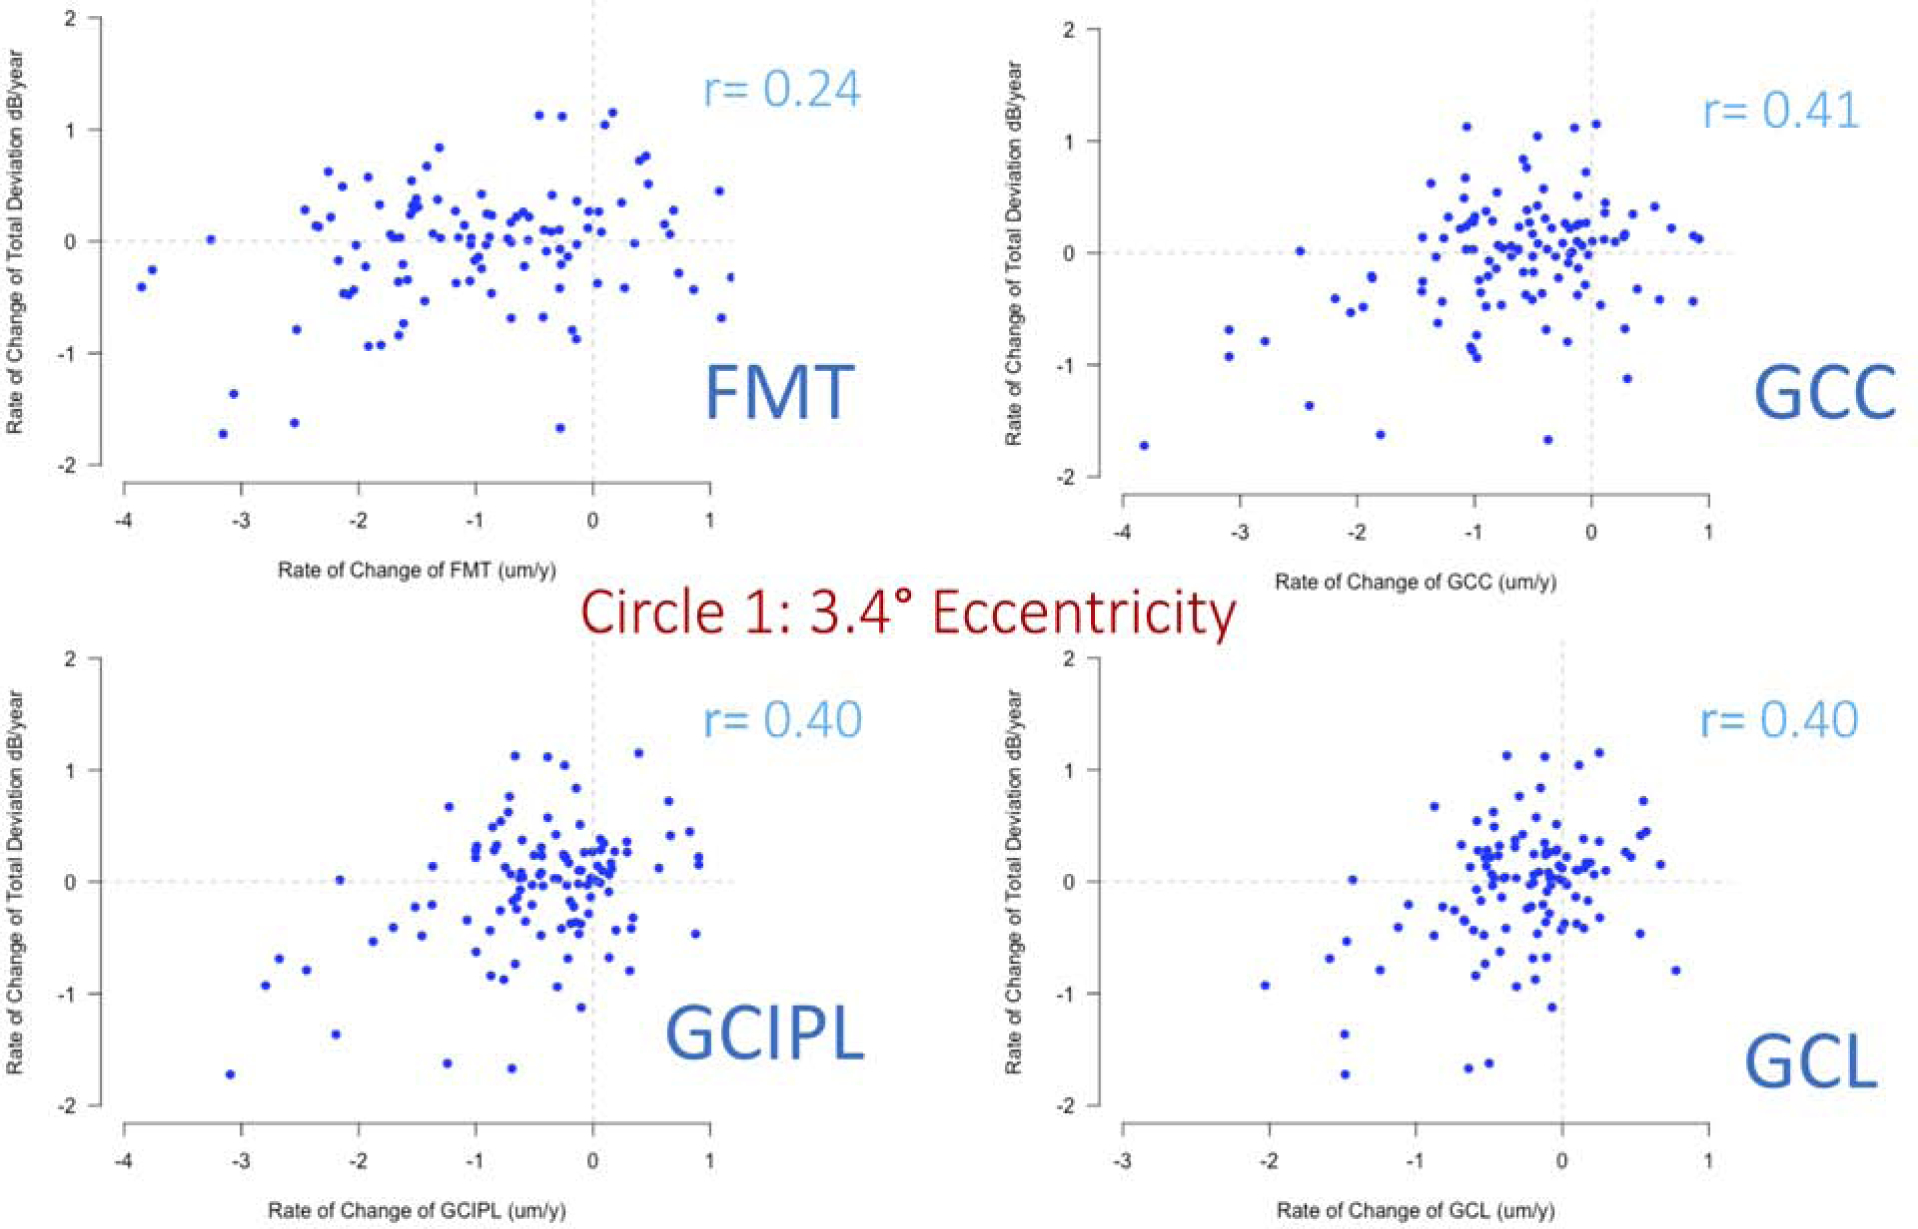
Scatterplots of functional vs. structural rates of change at 3.4° eccentricity for all macular outcomes of interest explored in this study.
Gray scale maps for structural and functional change rates averaged for all eyes are presented in Figure 6. We used a similar method for normalization of gray scale maps for all outcomes. Macular superpixels corresponding to perifoveal and papillomacular bundle showed the fastest average rates of change whereas the fastest functional rates of change were observed in the peripheral test locations of the central 10° VF.
Figure 6.

Grayscale map of topography of structural and functional longitudinal rates of change averaged across all eyes. The gray scales for rates were normalized in the same manner.
Table 4 is a contingency table providing the proportion of significant positive, negative and nonsignificant rates of change for superpixels and test locations, respectively. For all macular outcomes, the percentage of deteriorating superpixels with nonsignificant corresponding functional rates was higher than the proportion of deteriorating test locations for which the corresponding structural rates were nonsignificant. The bar plot on Figure 7A demonstrates the proportion of worsening vs. positive-slope superpixels for GCC thickness and VF test locations (TD values) as a function of follow-up time extending from of 2 to 5.5 years. At all timepoints, the proportion of significant negative GCC rates (defined as p <0.05 for the slope) was higher than those for TD rates. To avoid multiple comparisons, we only compared the proportion of worsening GCC and TD rates at years 3 and 5.5; a p value of <0.025 with McNemar’s test was considered significant after Bonferroni correction. The proportion of significant worsening superpixels and test locations increased with longer follow-up time. On the other hand, the proportion of positive structural and functional rates were small and stable over time. Figure 7B demonstrates the proportion of worsening superpixels and VF locations for the permutation approach. The rate estimation was carried out 5000 times for follow-up times extending from 2 to 5.5 years. Rates below 2.5%ile were considered as representing true worsening. The proportion of worsening superpixels was consistently higher for GCC thickness compared to TD and both proportions increased with longer follow-up. The proportions derived from the permutation method were consistently higher than the first method.
Table 4.
3×3 tables demonstrate agreement on the significance and direction of rates of change at superpixels and visual field test locations.
| Structure FMT | Function | |||
| Positive significant | All nonsignificant | Negative significant | ||
| Positive significant | 0.02% | 2.1% | 0.1% | |
| All nonsignificant | 2.4% | 59.2% | 4.7% | |
| Negative significant | 0.5% | 27.9% | 2.8% | |
| Structure GCC | Function | |||
| Positive significant | All nonsignificant | Negative significant | ||
| Positive significant | 0.2% | 3.4% | 0.3% | |
| All nonsignificant | 2.5% | 69.4% | 4.9% | |
| Negative significant | 0.1% | 16.4% | 2.3% | |
| Structure GCIPL | Function | |||
| Positive significant | All nonsignificant | Negative significant | ||
| Positive significant | 0.1% | 4.0% | 0.4% | |
| All nonsignificant | 2.6% | 74.3% | 10.5% | |
| Negative significant | 0.1% | 10.9% | 1.7% | |
| Structure GCL | Function | |||
| Positive significant | All nonsignificant | Negative significant | ||
| Positive significant | 0.1% | 3.8% | 0.3% | |
| All nonsignificant | 2.6% | 77.4% | 5.7% | |
| Negative significant | 0.1% | 8.0% | 1.5% | |
FMT; full macular thickness, GCC; ganglion cell complex, GCIPL; ganglion cell inner plexiform layer, GCL; ganglion cell layer.
Figure 7: A).
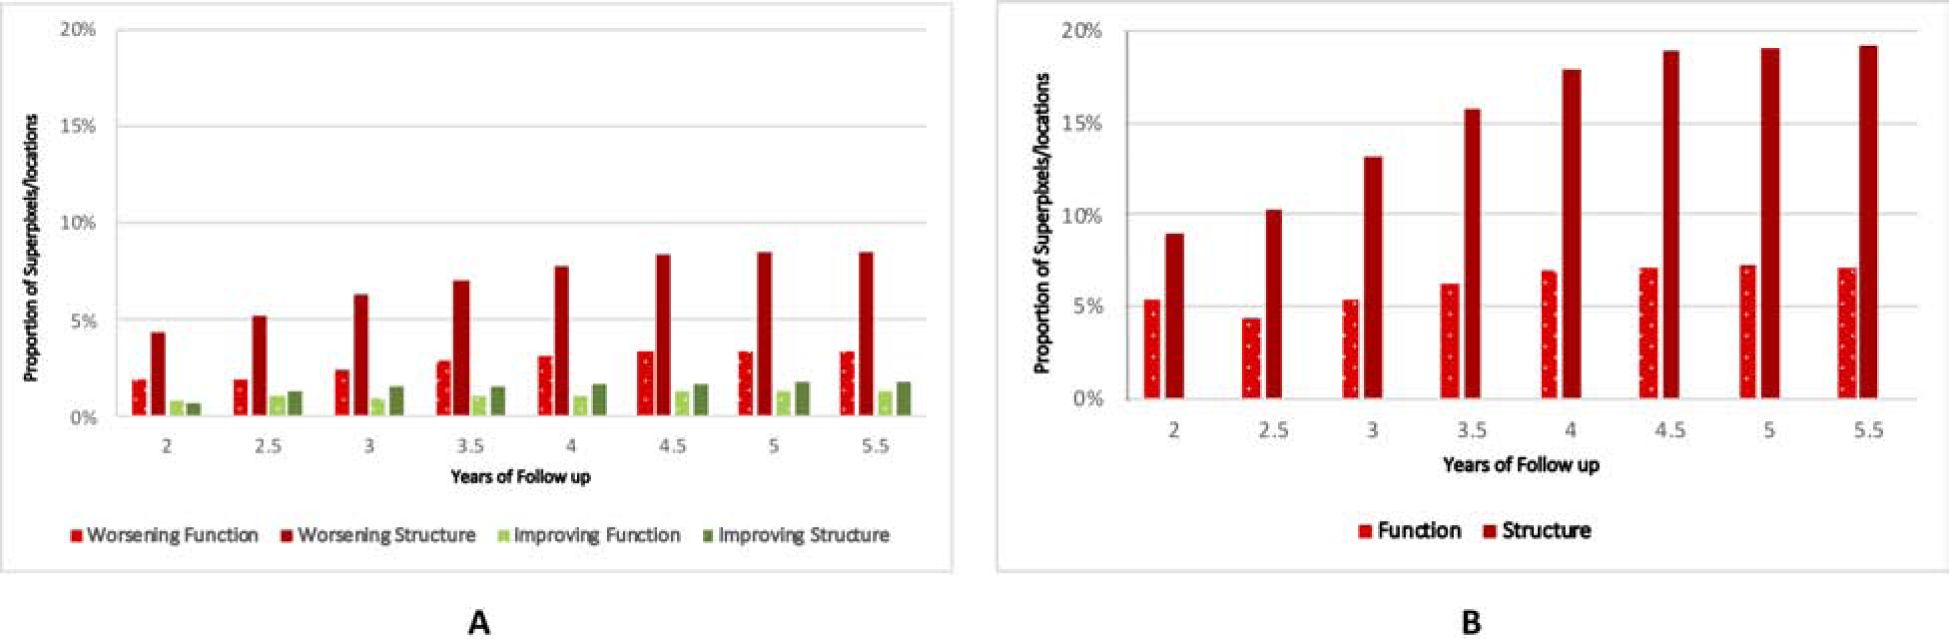
Bar plot demonstrates the proportion of worsening (negative rates with p <0.05) and positive (positive rates with p < 0.05) slopes for ganglion cell complex thickness at superpixels and total deviation at individual visual test locations at follow-up times ranging from 2 to 5.5 years. B) Bar plot displays the proportion of worsening slopes for ganglion cell complex thickness at superpixels and total deviation at individual visual test locations based on permutation analyses.
Table 5 describes the rates of change for macular parameters and VF TD as a function of their corresponding baseline measurements. The bivariate plots for GCC and TD rates are presented in Figure 8. The structural and functional rates of change both demonstrated a trend toward zero as the baseline GCC thickness and TD values approached their measurement floor; the magnitude of this effect was smaller for TD rates (ρ =−0.33 and −0.08; p <0.001 for GCC and TD, respectively; Figure 8).
Table 5.
Correlation of rates of change of macular structural measures and visual field total deviation with their corresponding baseline values. The p values are derived from Spearman’s rank correlation.
| ρ | P value | |
|---|---|---|
| FMT | −0.21 | <0.001 |
| GCC | −0.33 | <0.001 |
| GCIPL | −0.33 | <0.001 |
| GCL | −0.32 | <0.001 |
| TD | −0.08 | <0.001 |
FMT; full macular thickness, GCC; ganglion cell complex, GCIPL; ganglion cell inner plexiform layer, GCL; ganglion cell layer, TD: total deviation
Figure 8.
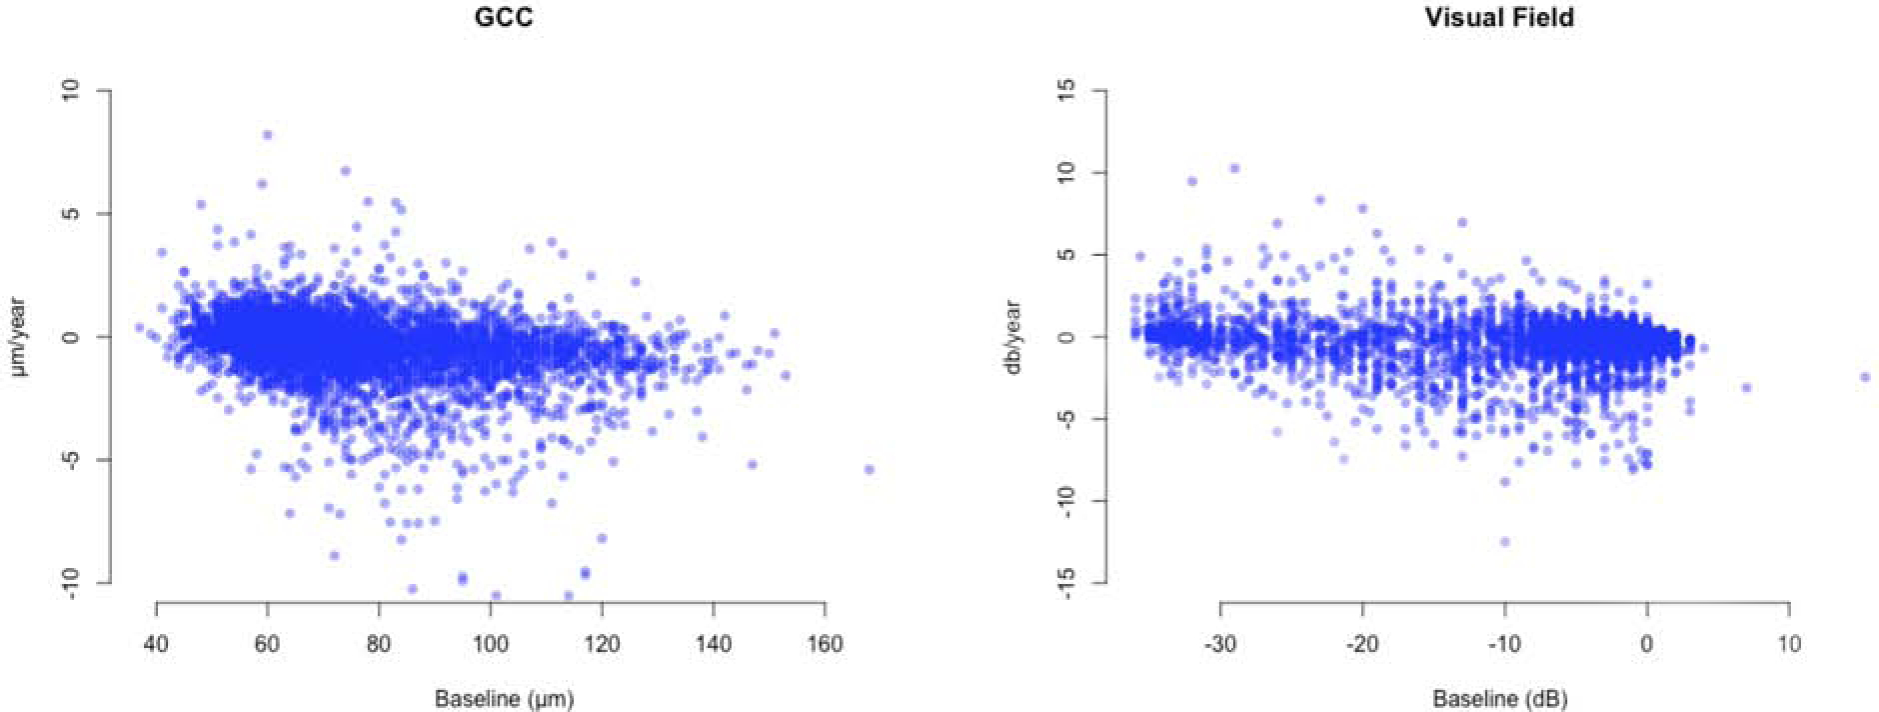
Bivariate plots display rates of change of ganglion cell complex (GCC) thickness at individual superpixels and visual field total deviation (TD) measurements at individual test locations against their baseline values. (ρ = −0.33 and −0.08; p <0.001 for GCC and TD, respectively).
All the above analyses were repeated using structural and functional changes from baseline instead of rates of change and the results were similar to those for rates of change. The highest correlations were observed on circles 1 and 2 (3.4° and 5.6° eccentricities). Inner macular layers, especially GCC, showed better correlation with VFs than FMT (Table 3).
Discussion
We investigated longitudinal structure-function relationships between the rates of change for macular OCT and central 10° VF measures in a cohort of eyes with evidence of central or advanced (MD worse than −6 dB) damage at baseline. Correlations were explored at corresponding superpixel and test locations, 3 different eccentricities and between corresponding hemiretina and hemifield regions. Our results showed weak to fair correlations between structural and functional rates or changes from baseline over the follow-up period (r =0.05–0.43). The highest correlations were seen at 3.4° and 5.6° eccentricities depending on the scale VF TD values were expressed in. Functional rates were calculated with VF TD expressed in both linear and logarithmic scale and we found similar correlations between structure and function with both linear-log and linear-linear scales. Ganglion cell complex measurements demonstrated the strongest correlation with perimetric measurements among the macular measures.
Studies on cross-sectional SF relationships have found moderate correlations between macular OCT and central VF measures.9,15,24,26 Data on longitudinal SF relationships are scarce. Nassiri et al. reported on the correlation of neuroretinal rim rates of change and VF sectoral rates in a group of eyes with suspected or established glaucoma and found the SF correlations to be moderate at best (r =0.60 between the superonasal neuroretinal rim sector and the inferior peripheral VF sector).31 Lee and colleagues later studied 465 eyes with a wide range of glaucoma severity and evaluated the correlation of neuroretinal rim area rates of change and VF rates of change defined by pointwise exponential regression and trend analyses of the MD and Visual Field Index. They found significant correlations between rim area change and the fast component of VF decay.32 Suda et al. evaluated longitudinal changes of structure and function by estimating rates of change of macular GCC and cp-RNFL and VF mean deviation.33 They reported a weak correlation (r =0.23) between global structural and functional indices.
We measured longitudinal SF relationships at multiple levels including individual superpixel and VF test locations, 3 eccentricities and hemiretina and hemifield regions. The highest observed correlation coefficient was 0.43 in our study. Results were similar when absolute changes from baseline were investigated as an alternative to rates of change as the follow-up time was fairly short. The median (IQR) follow-up time was 4.2 (3.7–4.6) years and the median (IQR) number of tests per eye was 8 (7–9). One of the reasons for the low to fair overall magnitude of SF correlations was that structural and functional change during the follow-up was relatively small; the average change in the central 10° VF MD was −1.0 dB. Our study sample con sisted of mostly moderately severe to advanced glaucoma patients and the macular thickness may have reached the measurement floor in many superpixels; this could have led to increased noise and issues with segmentation.34 On the other hand, it is possible that in progressive glaucoma, moribund cells may lose their function first while the cell body, dendrites and axons remain intact.35–39 Retinal ganglion cell damage may cause neuropsychological and functional alterations that can affect functional tests but may not be reflected on structural tests.18,35 We matched macular OCT superpixels with central 10° VF locations after correcting for the average RGC displacement based on Drasdo et al. and Raza and colleagues.23,24 Improvement in the magnitude of SF correlations after adjusting for RGC displacement around the fovea have been reported.9,24,40,41 However, this adjustment is done for the average eye, which could have led to a reduction of the SF correlations observed in this study. The temporal disagreement between ongoing structural loss and corresponding functional loss needs to be better investigated.
Our study demonstrated similar SF correlations between GCC, GCIPL and GCL and central VF measurements. Although the coefficient of correlation for GCC was highest in most analyses, the differences were small and not statistically significant as significant overlapping of the 95% confidence intervals for the 3 inner macular outcomes was evident. Ohkubo et al. evaluated global and hemiretina and hemifield cross-sectional SF correlations and found that GCC had the highest association with the central 10° VF parameters among inner macular layer s.40 Honjo and associates also reported that GCC demonstrated the highest correlation with the central 10° VF measures and hence, was the most useful macular outcome measure for assessing central SF relationships.42 This finding could be explained by the fact that the GCC is on average thicker than other inner macular measures since it includes the RNFL layer. The latter commonly carries information from other areas of the retina rather than the underlying RGCs and therefore, GCC’s better performance compared to other layers is likely due to its larger dynamic range.15 Thicker GCC is less likely to be affected by segmentation issues especially during the later stages of glaucoma; also, it is not affected by aging changes in the outer half of the retina as compared to FMT.43–45 In contrast, FMT showed the lowest magnitude of correlation with VF measures, likely explained by the fact that its thickness is affected by aging or concurrent pathologies in the outer as well as inner retinal layers. Results of permutation analyses confirmed the findings of our primary analyses. By creating a frequency distribution for the 5000 permutated series, we could define a cutoff point for defining statistically significant slopes for each superpixel and test location. Overall the proportion of significant deteriorating rates was higher with permutation analyses than with our primary analyses.
One of the main strengths of our study is the evaluation of SF relationships in localized areas as small as single 3°×3° superpixel s and VF test locations along with multiple eccentricities and matching hemiretina and hemifields. Structure-function relationships at the superpixel and test location level could be affected by higher variability or noise as opposed to larger areas where variability is lower; at the same time, averaging can lead to dilution of signal. The difference in the size of regions measured by structural vs. functional modalities can lead to higher variability.18 In order to reduce variability, we grouped superpixels and VF locations into circles (eccentricities) and hemiretinas and hemifields by averaging macular layer thickness and VF TD measurements. Because of the anatomical configuration of the macula, it is important to consider the variability of macular thickness as a function of eccentricity. Our group has demonstrated that SF relationships varied as a function of distance from the fovea.15,27 Raza and associates investigated SF relationships at 5 different distances from the fovea and reported that the highest correlation was seen at 7.2° eccentricity. In this study, the highest correlation was observed at 3.4° and 5.6° eccentricities (circles 1 and 2) depending on the change measure explored. This is consistent with findings by Miraftabi et al. and is probably related to the fact that the macular thickness is at its maximum at 5.6° from th e fovea.24,27 Macular thickness measures are more likely to reach their floor sooner or be more variable outside this region.34
Baseline values of structural or functional measures can influence the magnitude of the observed test-retest variability and the rates of change.27 In general, with decreasing thickness of any structural measure at baseline, the rates of change tend to diminish, which is likely related to the measurements being closer to their floor. Nassiri and colleagues reported that thicker baseline neuroretinal rim area was associated with faster global and sectoral rates of change as measured with scanning laser ophthalmoscopy.46 Lee et al. also reported that higher baseline thickness for neuroretinal rim area was associated with faster global neuroretinal rim area rates of change.32 On the other hand, Medeiros and colleagues found that baseline values did not have a significant influence on RNFL rates of change.47 We regressed structural and functional rates of change against their corresponding baseline values. As baseline measurement approached their floor, the rates of change became smaller; this effect was less prominent for functional outcomes (ρ =−0.33 and −0.08; p <0.001 for GCC and TD, respectively; Figure 8).
Rates of change can be somewhat variable when a smaller number of tests are available, and a longer series of exams is expected to result in more accurate detection of rates.48,49 Event-based analyses are less affected by the number of available tests. We also explored SF relationships using changes from baseline values instead of rates of change. We found that the results were very similar to those obtained with rates of change.
One limitation of our longitudinal study is that the aging effects on macular OCT measurements could not be accounted for; however, given the median follow-up period of 4.2 years, it is unlikely that this issue may have significantly affected the results. In the same vein, although TD values are corrected for the aging effect based on decades of age, with shorter follow-up periods, this correction is unlikely to be of much clinical relevance. We found that thinning of the GCC was more likely to be detected compared to worsening of the TD values during the follow-up period with a trend towards a higher proportion of worsening superpixels and test locations with longer follow-up. The proportion of positive-slope superpixels and test locations was much smaller and consistent between the structural and functional measures and remained constant over time; this suggests that most of the captured deterioration within the structural or functional domains are real and do not reflect noise.50 While some positive slopes could be a result of random noise, some positive structural slopes could be attributed to remodeling changes that accompany neural loss, which may lead to true thickening of layers.51 The significance of structural improvement over time needs to be further explored in future studies. It is plausible that age-related loss of RGCs could potentially impact visual function in advanced glaucoma given the very small number of residual RGCs; therefore, the capability to detect change more efficiently with structural measures regardless of the cause is of potential benefit. Another limitation, as mentioned above, is the small amount of perimetric change observed during the follow-up period, which makes correlation of longitudinal change more challenging.
In summary, we found that longitudinal SF relationships were weak to fair in this group of patients with evidence of central or advanced glaucomatous damage at baseline. Similar SF correlations were observed between GCC, GCIPL and GCC and central VF although GCC might be the most suitable macular outcome measure for monitoring glaucoma regardless of severity due to the relative ease of segmentation and thicker measurements.15 The highest correlations were seen within the area of the macula with the highest RGC density. Changes in GCC were more efficiently detected as compared to changes in TD values raising the possibility that changes in macular thickness may precede or may be able to predict functional changes. Monitoring macular structural and functional measures is required in eyes with evidence of central or advanced glaucomatous damage.
Supplementary Material
Figure 1.
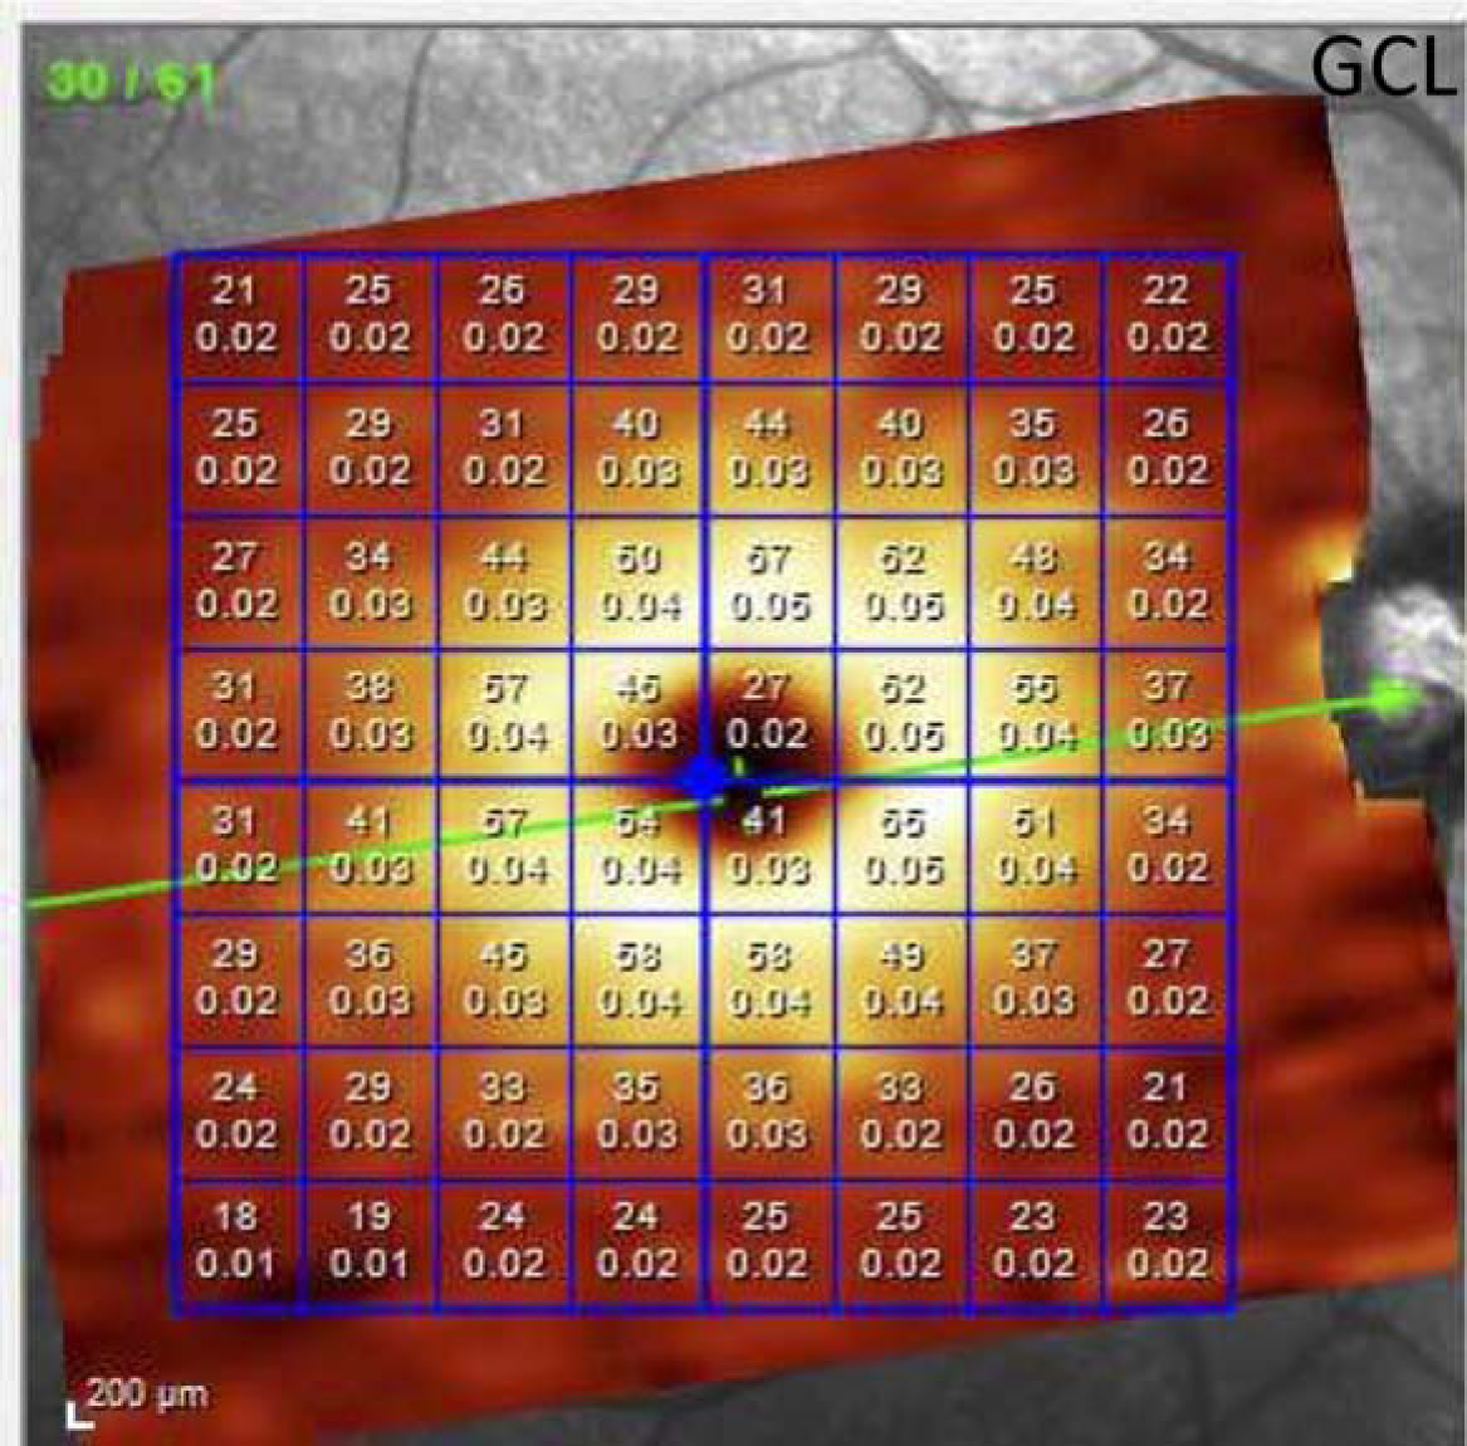
The Posterior Pole Algorithm of the Spectralis spectral domain optical coherence tomography provides an 8×8 array of 3°×3° superpixels within the central 24° of the macula. The numbers inside the superpixels represent the thickness and volume of the layer of interest in each superpixel (ganglion cell layer in this example).
Footnotes
Publisher's Disclaimer: This is a PDF file of an unedited manuscript that has been accepted for publication. As a service to our customers we are providing this early version of the manuscript. The manuscript will undergo copyediting, typesetting, and review of the resulting proof before it is published in its final form. Please note that during the production process errors may be discovered which could affect the content, and all legal disclaimers that apply to the journal pertain.
Presented as a paper at the annual meeting of the Association for Research in Vision and Ophthalmology, April 29-May 3, 2019, Vancouver BC, Canada
References
- 1.Curcio CA AK. Topography of ganglion cells in human retina. Journal of comparative Neurology. 1990. October 1;300(1):5–25. Journal of comparative Neurology1990 Oct 1;300(1):5–25. [DOI] [PubMed] [Google Scholar]
- 2.Greenfield DS, Bagga H, Knighton RW. Macular thickness changes in glaucomatous optic neuropathy detected using optical coherence tomography. Arch Ophthalmol. 2003;121(1):41–46. [DOI] [PubMed] [Google Scholar]
- 3.Nickells RW. The cell and molecular biology of glaucoma: mechanisms of retinal ganglion cell death. Invest Ophthalmol Vis Sci. 2012;53(5):2476–2481. [DOI] [PMC free article] [PubMed] [Google Scholar]
- 4.Garway–Heath DF, Caprioli J, Fitzke FW, Hitchings RA. Scaling the Hill of Vision: The Physiological Relationship between Light Sensitivity and Ganglion Cell Numbers. Invest Ophthalmol Vis Sci. 2000;41(7):1774–1782. [PubMed] [Google Scholar]
- 5.Wu Z, Weng DSD, Thenappan A, Ritch R, Hood DC. Evaluation of a Region-of-Interest Approach for Detecting Progressive Glaucomatous Macular Damage on Optical Coherence Tomography. Transl Vis Sci Technol. 2018;7(2):14. [DOI] [PMC free article] [PubMed] [Google Scholar]
- 6.Lavinsky F, Wu M, Schuman JS, et al. Can Macula and Optic Nerve Head Parameters Detect Glaucoma Progression in Eyes with Advanced Circumpapillary Retinal Nerve Fiber Layer Damage? Ophthalmology. 2018. [DOI] [PMC free article] [PubMed] [Google Scholar]
- 7.Lee WJ, Park KH. Re: Hou etal: Integrating macular ganglion cell inner plexiform layer and parapapillary retinal nerve fiber layer measurements to detect glaucoma progression (Ophthalmology. 2018;125:822–831). Ophthalmology. 2019;126(2):e13. [DOI] [PubMed] [Google Scholar]
- 8.Shin JW, Sung KR, Park SW. Patterns of Progressive Ganglion Cell-Inner Plexiform Layer Thinning in Glaucoma Detected by OCT. Ophthalmology. 2018;125(10):1515–1525. [DOI] [PubMed] [Google Scholar]
- 9.Lee JW, Morales E, Sharifipour F, et al. The relationship between central visual field sensitivity and macular ganglion cell/inner plexiform layer thickness in glaucoma. Br J Ophthalmol. 2017;101(8):1052–1058. [DOI] [PubMed] [Google Scholar]
- 10.Kim S, Lee JY, Kim SO, Kook MS. Macular structure-function relationship at various spatial locations in glaucoma. Br J Ophthalmol. 2015;99(10):1412–1418. [DOI] [PubMed] [Google Scholar]
- 11.Rao HL, Zangwill LM, Weinreb RN, Leite MT, Sample PA, Medeiros FA. Structure-function relationship in glaucoma using spectral-domain optical coherence tomography. Arch Ophthalmol. 2011;129(7):864–871. [DOI] [PMC free article] [PubMed] [Google Scholar]
- 12.Nilforushan N, Nassiri N, Moghimi S, et al. Structure-Function Relationships between Spectral-Domain OCT and Standard Achromatic Perimetry. Invest Ophthalmol Vis Sci. 2012;53(6):2740–2748. [DOI] [PubMed] [Google Scholar]
- 13.Na JH, Kook MS, Lee Y, Baek S. Structure-function relationship of the macular visual field sensitivity and the ganglion cell complex thickness in glaucoma. Invest Ophthalmol Vis Sci. 2012;53(8):5044–5051. [DOI] [PubMed] [Google Scholar]
- 14.Sato S, Hirooka K, Baba T, Tenkumo K, Nitta E, Shiraga F. Correlation between the ganglion cell-inner plexiform layer thickness measured with cirrus HD-OCT and macular visual field sensitivity measured with microperimetry. Invest Ophthalmol Vis Sci. 2013;54(4):3046–3051. [DOI] [PubMed] [Google Scholar]
- 15.Miraftabi A, Amini N, Morales E, et al. Macular SD-OCT Outcome Measures: Comparison of Local Structure-Function Relationships and Dynamic Range. Invest Ophthalmol Vis Sci. 2016;57(11):4815–4823. [DOI] [PMC free article] [PubMed] [Google Scholar]
- 16.Hood DC, Anderson SC, Wall M, Kardon RH. Structure versus function in glaucoma: an application of a linear model. Invest Ophthalmol Vis Sci. 2007;48(8):3662–3668. [DOI] [PubMed] [Google Scholar]
- 17.Kim NR, Lee ES, Seong GJ, Kim JH, An HG, Kim CY. Structure-function relationship and diagnostic value of macular ganglion cell complex measurement using Fourier-domain OCT in glaucoma. Invest Ophthalmol Vis Sci. 2010;51(9):4646–4651. [DOI] [PubMed] [Google Scholar]
- 18.Denniss J, Turpin A, McKendrick AM. Relating optical coherence tomography to visual fields in glaucoma: structure-function mapping, limitations and future applications. Clin Exp Optom. 2018. [DOI] [PubMed] [Google Scholar]
- 19.Lee WJ, Kim TJ, Kim YK, Jeoung JW, Park KH. Serial Combined Wide-Field Optical Coherence Tomography Maps for Detection of Early Glaucomatous Structural Progression. JAMA Ophthalmol. 2018. [DOI] [PMC free article] [PubMed] [Google Scholar]
- 20.Kim KE, Park KH, Jeoung JW, Kim SH, Kim DM. Severity-dependent association between ganglion cell inner plexiform layer thickness and macular mean sensitivity in open-angle glaucoma. Acta Ophthalmol. 2014;92(8):e650–656. [DOI] [PubMed] [Google Scholar]
- 21.Clinical JC evaluation of the optic nerve in glaucoma. Transactions of the American Ophthalmological Society. 1994;92:589. [PMC free article] [PubMed] [Google Scholar]
- 22.Hood DC, Kardon RH. A framework for comparing structural and functional measures of glaucomatous damage. Prog Retin Eye Res. 2007;26(6):688–710. [DOI] [PMC free article] [PubMed] [Google Scholar]
- 23.Drasdo N, Millican CL, Katholi CR, Curcio CA. The length of Henle fibers in the human retina and a model of ganglion receptive field density in the visual field. Vision Res. 2007;47(22):2901–2911. [DOI] [PMC free article] [PubMed] [Google Scholar]
- 24.Raza AS, Cho J, de Moraes CG, et al. Retinal ganglion cell layer thickness and local visual field sensitivity in glaucoma. Arch Ophthalmol. 2011;129(12):1529–1536. [DOI] [PMC free article] [PubMed] [Google Scholar]
- 25.Hood DC. Improving our understanding, and detection, of glaucomatous damage: An approach based upon optical coherence tomography (OCT). Prog Retin Eye Res. 2017;57:46–75. [DOI] [PMC free article] [PubMed] [Google Scholar]
- 26.Cho JW, Sung KR, Lee S, et al. Relationship between visual field sensitivity and macular ganglion cell complex thickness as measured by spectral-domain optical coherence tomography. Invest Ophthalmol Vis Sci. 2010;51(12):6401–6407. [DOI] [PubMed] [Google Scholar]
- 27.Nouri-Mahdavi K, Fatehi N, Caprioli J. Longitudinal Macular Structure-Function Relationships in Glaucoma and Their Sources of Variability. Am J Ophthalmol. 2019. [DOI] [PMC free article] [PubMed] [Google Scholar]
- 28.Sepulveda JA, Turpin A, McKendrick AM. Individual Differences in Foveal Shape: Feasibility of Individual Maps Between Structure and Function Within the Macular Region. Invest Ophthalmol Vis Sci. 2016;57(11):4772–4778. [DOI] [PubMed] [Google Scholar]
- 29.Bedggood P, Nguyen B, Lakkis G, Turpin A, McKendrick AM. Orientation of the Temporal Nerve Fiber Raphe in Healthy and in Glaucomatous Eyes. Invest Ophthalmol Vis Sci. 2017;58(10):4211–4217. [DOI] [PubMed] [Google Scholar]
- 30.Rabiolo A, Morales E, Mohamed L, et al. Comparison of Methods to Detect and Measure Glaucomatous Visual Field Progression. Transl Vis Sci Technol. 2019;8(5):2. [DOI] [PMC free article] [PubMed] [Google Scholar]
- 31.Nassiri N, Nilforushan N, Bitrian E, et al. Functional and Structural Rates of Glaucoma Progression Are Poorly Correlated. ARVO Annual Meeting Abstract Search and Program Planner. 2011;2011:4137. [Google Scholar]
- 32.Lee JW, Kim EA, Otarola F, et al. The Fast Component of Visual Field Decay Rate Correlates With Disc Rim Area Change Throughout the Entire Range of Glaucomatous Damage. Invest Ophthalmol Vis Sci. 2015;56(10):5997–6006. [DOI] [PubMed] [Google Scholar]
- 33.Suda K, Hangai M, Akagi T, et al. Comparison of Longitudinal Changes in Functional and Structural Measures for Evaluating Progression of Glaucomatous Optic Neuropathy. Invest Ophthalmol Vis Sci. 2015;56(9):5477–5484. [DOI] [PubMed] [Google Scholar]
- 34.Miraftabi A, Amini N, Gornbein J, et al. Local Variability of Macular Thickness Measurements With SD-OCT and Influencing Factors. Transl Vis Sci Technol. 2016;5(4):5. [DOI] [PMC free article] [PubMed] [Google Scholar]
- 35.Fry LE, Fahy E, Chrysostomou V, et al. The coma in glaucoma: Retinal ganglion cell dysfunction and recovery. Prog Retin Eye Res. 2018;65:77–92. [DOI] [PubMed] [Google Scholar]
- 36.Caprioli J Glaucoma: a disease of early cellular senescence. Invest Ophthalmol Vis Sci. 2013;54(14):ORSF60–67. [DOI] [PubMed] [Google Scholar]
- 37.Caprioli J, de Leon JM, Azarbod P, et al. Trabeculectomy Can Improve Long-Term Visual Function in Glaucoma. Ophthalmology. 2016;123(1):117–128. [DOI] [PubMed] [Google Scholar]
- 38.Crowston JG, Kong YX, Trounce IA, et al. An acute intraocular pressure challenge to assess retinal ganglion cell injury and recovery in the mouse. Exp Eye Res. 2015;141:3–8. [DOI] [PubMed] [Google Scholar]
- 39.Porciatti V, Ventura LM. Retinal ganglion cell functional plasticity and optic neuropathy: a comprehensive model. J Neuroophthalmol. 2012;32(4):354–358. [DOI] [PMC free article] [PubMed] [Google Scholar]
- 40.Ohkubo S, Higashide T, Udagawa S, et al. Focal relationship between structure and function within the central 10 degrees in glaucoma. Invest Ophthalmol Vis Sci. 2014;55(8):5269–5277. [DOI] [PubMed] [Google Scholar]
- 41.Turpin A, Chen S, Sepulveda JA, McKendrick AM. Customizing Structure-Function Displacements in the Macula for Individual Differences. Invest Ophthalmol Vis Sci. 2015;56(10):5984–5989. [DOI] [PubMed] [Google Scholar]
- 42.Honjo M, Omodaka K, Ishizaki T, Ohkubo S, Araie M, Nakazawa T. Retinal Thickness and the Structure/Function Relationship in the Eyes of Older Adults with Glaucoma. PLoS One. 2015;10(10):e0141293. [DOI] [PMC free article] [PubMed] [Google Scholar]
- 43.Nieves-Moreno M, Martinez-de-la-Casa JM, Morales-Fernandez L, Sanchez-Jean R, Saenz-Frances F, Garcia-Feijoo J. Impacts of age and sex on retinal layer thicknesses measured by spectral domain optical coherence tomography with Spectralis. PLoS One. 2018;13(3):e0194169. [DOI] [PMC free article] [PubMed] [Google Scholar]
- 44.Vianna JR, Butty Z, Torres LA, et al. Outer retinal layer thickness in patients with glaucoma with horizontal hemifield visual field defects. Br J Ophthalmol. 2018. [DOI] [PubMed] [Google Scholar]
- 45.Cifuentes-Canorea P, Ruiz-Medrano J, Gutierrez-Bonet R, et al. Analysis of inner and outer retinal layers using spectral domain optical coherence tomography automated segmentation software in ocular hypertensive and glaucoma patients. PLoS One. 2018;13(4):e0196112. [DOI] [PMC free article] [PubMed] [Google Scholar]
- 46.Nassiri N, Nilforushan N, Coleman AL, Law SK, Caprioli J, Nouri-Mahdavi K. Longitudinal Structure-Function Relationships With Scanning Laser Ophthalmoscopy and Standard Achromatic Perimetry. Arch Ophthalmol. 2012;130(7):826–832. [DOI] [PubMed] [Google Scholar]
- 47.Medeiros FA, Zangwill LM, Alencar LM, et al. Detection of Glaucoma Progression using Stratus OCT Retinal Nerve Fiber Layer, Optic Nerve Head and Macular Thickness Measurements. Invest Ophthalmol Vis Sci. 2009. [DOI] [PMC free article] [PubMed] [Google Scholar]
- 48.Nouri-Mahdavi K, Zarei R, Caprioli J. Influence of visual field testing frequency on detection of glaucoma progression with trend analyses. Arch Ophthalmol. 2011;129(12):1521–1527. [DOI] [PubMed] [Google Scholar]
- 49.Chauhan BC, Garway-Heath DF, Goni FJ, et al. Practical recommendations for measuring rates of visual field change in glaucoma. Br J Ophthalmol. 2008;92(4):569–573. [DOI] [PMC free article] [PubMed] [Google Scholar]
- 50.O’Leary N, Chauhan BC, Artes PH. Visual field progression in glaucoma: estimating the overall significance of deterioration with permutation analyses of pointwise linear regression (PoPLR). Invest Ophthalmol Vis Sci. 2012;53(11):6776–6784. [DOI] [PubMed] [Google Scholar]
- 51.Berry RH, Qu J, John SW, Howell GR, Jakobs TC. Synapse Loss and Dendrite Remodeling in a Mouse Model of Glaucoma. PLoS One. 2015;10(12):e0144341. [DOI] [PMC free article] [PubMed] [Google Scholar]
Associated Data
This section collects any data citations, data availability statements, or supplementary materials included in this article.