

Abstract
Introduction:
Rural women have higher rates of cardiovascular disease than their non-rural counterparts, partially due to their social and environmental contexts. The study objective is to test a refined version of the multilevel Strong Hearts, Healthy Communities intervention, which used extensive process and outcome evaluation data from the original randomized trial to optimize effectiveness as measured by improved Simple 7 score, a composite measure of cardiovascular disease risk.
Study design:
The intervention was implemented in a 6-month, delayed-intervention, community-randomized trial; control participants received the program following 24-week outcome assessment. The study was conducted in 2017–2018; data analysis occurred in 2018–2019.
Setting/participants:
The study was conducted in 11 rural, medically underserved towns in New York. Participants were women aged ≥40 years who were either: (1) obese or (2) overweight and sedentary.
Intervention:
The intervention group received 24 weeks of hour-long, twice-weekly classes including strength training, aerobic exercise, and skill-based nutrition- and health-related education, as well as civic engagement activities focused on healthy food and physical activity environments.
Main outcome measures:
Measures included weight and height; blood pressure; blood cholesterol; blood glucose; and self-reported smoking, diet, and physical activity behaviors. Individual Simple 7 components were examined and mixed linear regression analyses were used to examine change in Simple 7 score.
Results:
One hundred eighty-two participants were randomized. Compared with control participants, the intervention group had greater improvements in Simple 7 score (difference=1.03, 95% CI=0.44, 1.61, p<0.001) and three of the seven Simple 7 components (physical activity, healthy diet score, and BMI).
Conclusions:
These findings highlight the importance of rigorously evaluating programs in real-world community settings and, when appropriate, revising and retesting interventions to optimize dissemination potential.
Trial registration:
This study is registered at www.clinicaltrials.gov NCT03059472.
INTRODUCTION
Cardiovascular disease (CVD) is the leading cause of death in the U.S. and was recognized as a major determinant of excess mortality in rural populations in the mid to late 1980s.1 Nearly one-quarter of all deaths among U.S. women are attributed to CVD2 and the prevalence of CVD has been shown to increase with age.3 According to National Health and Nutrition Examination Survey data from 2013 to 2016, prevalence of CVD was highest among women aged 60–79 years (78%) and those aged 80 years and older (92%), thus making older women important targets for prevention interventions.3 Furthermore, recent data have shown a widening disparity in CVD mortality rates between urban and rural areas in the past 2 decades,4 reflecting observed increases in heart disease mortality across rural counties.5 Women residing in rural areas tend to have elevated CVD risk factors, including higher rates of obesity, physical inactivity, and poor diet, partly due to reduced access to health care and unique social and built environment challenges.6–10
Existing behavior change interventions among rural women have demonstrated reductions in CVD risk factors.11–18 However, these interventions have focused primarily on individual-level behavior change rather than addressing environmental factors known to influence health behaviors.19 According to the Centers for Disease Control and Prevention, primary prevention of CVD “can be achieved through improvements in the social and built environments, including access to affordable healthy foods and recreational facilities, opportunities for social interaction, and participation in civic life.”20 Therefore, interventions to decrease CVD risk should address both individuals and their environments.20
It has been reported that CVD prevention programs of 8–24 weeks in duration have resulted in significant improvements in composite CVD risk factor scores.21–24 One promising measure of composite CVD risk is the American Heart Association‟s Life‟s Simple 7 (hereafter, Simple 7).25 Among middle-aged adults, Simple 7 scores have been associated with later onset of CVD.26–30 In the Atherosclerosis Risk in Communities study of more than 12,000 middle-aged adults with a median follow-up of 19 years, higher total Simple 7 scores were associated with lower later CVD incidence.26 Similarly, the Women‟s Health Initiative study of more than 150,000 women, with a median follow-up of 13 years, found that women with the lowest Simple 7 scores were nearly seven times more likely to have CVD than those with the highest Simple 7 scores.29
To date, only one rural intervention has assessed composite CVD risk using Simple 7: the Strong Hearts, Healthy Communities (SHHC) study.31 In the first iteration of SHHC, rural women who were overweight/obese and sedentary participated in a 6-month, twice-weekly multilevel intervention. Simple 7 score significantly improved in SHHC participants by 0.88 points (p<0.001); the difference between arms was 0.67 points (p=0.01).31
For the present study, the SHHC intervention was modified based upon extensive outcome and process evaluation data from program participants and community-based educators.32 The aims of this community-randomized trial were to: (1) evaluate the effects of the revised SHHC intervention (hereafter, SHHC-2.0) on Simple 7 score and Simple 7 component scores and (2) to examine intervention effects among a subset of older participants (aged ≥60 years).
METHODS
The SHHC-2.0 community-randomized delayed intervention trial was implemented in 11 rural, medically underserved towns in New York during 2017–2018. Town eligibility for rurality was based on Rural–Urban Commuting Area codes of 4 or higher33,34 and medically underserved was based upon designation as a Health Professional Shortage Area.35 All towns were geographically distinct communities and were not involved in the original SHHC trial.31,36 Towns were paired within counties and randomized to the intervention or delayed intervention control group; in the one county with three towns, one town was randomized to receive the intervention and two towns were randomized to receive the delayed intervention. The delayed intervention group did not receive any intervention components during the intervention period (baseline to 24 weeks).
All intervention and control group participants completed data collection assessments at baseline prior to randomization and post-intervention (24 weeks). Randomization assignments were performed and revealed to leaders and participants after baseline assessments were completed. The delayed intervention control group received the SHHC-2.0 program after 24 weeks; however, the a priori outcome (as reflected in the results presented herein) was the comparison of between group change from baseline to the 24-week timepoint.
Study Sample
Study participants were recruited from each selected town prior to randomization by local educators and enrolled by research staff. Recruitment strategies included flyers, social media, radio, newspapers, and “word of mouth.”
Eligible participants were female, aged ≥40 years, and either: (1) overweight (BMI=25–30) and currently sedentary (no more than one bout of ≥30 minutes of leisure physical activity per week on average, during the past 3 months) or (2) obese (BMI >30). Women were considered ineligible if they did not provide informed consent or permission from a healthcare provider, had systolic blood pressure >160 mmHg or diastolic blood pressure >100 mmHg, had a resting heart rate <60 or >100 bpm, had a cognitive impairment,37 were participating or planning to participate in another health behavior change program in the next 6 months, or were unwilling to be randomized to immediate or delayed intervention.
Sample size estimates were based on the StrongWomen–Healthy Hearts study, in which intervention participants lost 2.1 (SD=2.6) kg compared with control participants.18 An intra-class correlation of 0.15 (with 11 clusters of 12 people each) and 15% attrition rate were assumed, yielding a design effect of 2.65. The sample size ensured at least 80% power to detect an effect size of 0.75 with a two-sided α and 2.6 kg SD. This would allow detection of a difference in weight change between arms of 1.95 kg.
Participants provided written informed consent upon enrollment. Study procedures and materials were approved by the IRBs at Cornell University and Bassett Medical Center.
Intervention
Many midlife and older women feel less comfortable using traditional co-ed exercise facilities38,39 and the support of gender- and age-specific groups is an important facilitator of behavior change for rural women.10,40,41 Thus, the SHHC intervention program was specifically designed for women in rural areas, including key elements from three previous programs that were conducted with women.42–44
The SHHC-2.0 intervention group participated in 6 months of hour-long, twice-weekly experiential classes that included progressive strength training, aerobic exercise, and skills-based health education including nutrition and physical activity topics and civic engagement activities focused on creating healthy environments. Example class activities included aerobic and strength training (individual level), group discussions about building social support for exercising outside of class (social level), and grocery store tours and town walking audits (environmental level).
Revisions made to the SHHC program are described in detail in the protocol manuscript.33 Examples of key changes were increasing the frequency of goal-setting reminders, adding out-of-class assignments to keep participants engaged, incorporating new strategies for improving social support, and shifting the order of program components (i.e., introducing key nutrition concepts earlier and introducing civic engagement activities later on). Approximately 50%–60% of classes focused on physical activity and 40%–50% focused on nutrition, related behavioral strategies, and goal setting. Additional information on program components has been published previously.31,32,36
The SHHC classes were held in various community locations (e.g., churches) and facilitated by local leaders with experience as community health educators. Leaders attended a one-day training session on program facilitation and a half-day training session on research methods prior to implementation. Weekly support calls were held for leaders throughout the intervention period. Leaders completed questionnaires after each class related to program fidelity and research staff conducted intervention fidelity site visits.
Measures
All participants completed in-person assessments and online health-related questionnaires at baseline and outcome (24 weeks). Weight, height, blood pressure, total cholesterol, and fasting blood glucose were measured by research staff during assessment visits. Data on smoking status, diet, physical activity, and demographic characteristics were collected via online questionnaires.
The Simple 7 composite CVD risk score is composed of seven CVD risk factors: physical activity, diet, smoking status, BMI, cholesterol, blood pressure, and fasting blood glucose. For the present study, Simple 7 components were derived from self-reported (physical activity, diet, smoking) and measured (BMI, cholesterol, blood pressure, blood glucose) data. To calculate total Simple 7 score, individual components were assigned scores as follows: poor=0, intermediate=1, and ideal=2 (Appendix Table 1).25 Component scores were summed to create an overall score ranging from 0 to 14. Total Simple 7 scores were subsequently classified as follows: 0–4=poor; 5–9=intermediate, and 10–14=ideal.27
Free-standing stadiometers were used to measure height and Omron HBF-510W scales were used to measure weight. Height and weight were measured twice, unless height differed by >0.5 cm or weight differed by >0.1 kg. In that case, a third measurement was taken. Means of the measurements were used to calculate BMI. Blood pressure was measured twice using an automated blood pressure monitor (Omron 5 series) and the average of both measurements was calculated. Blood draws were used to measure fasting blood glucose and total cholesterol.
The Simple 7 diet questionnaire was used to assess average daily consumption of fruit, vegetables, fish, whole grains, sodium, and sugar-sweetened beverages (Appendix Table 2).25
Dietary data were analyzed to determine whether or not participants met the following Simple 7 criteria: fruits and vegetables, ≥4.5 cups per day; fish, two or more 3.5-oz servings per week; fiber-rich whole grains (≥1.1 g of fiber per 10 g of carbohydrate), three or more 1-oz equivalent servings per day; sodium, <1,500 mg per day; and sugar-sweetened beverages, ≤450 kcal (36 oz) per week. Participants were assigned a healthy diet score ranging from 0 to 5, depending on the number of criteria met (Appendix Table 1).
The International Physical Activity Questionnaire45 was used to assess self-reported physical activity level. Questions asked about the frequency and duration of vigorous and moderate intensity activities in the past 7 days. Questionnaire data were used to calculate minutes per week of moderate and vigorous activity (Appendix Table 1).
Statistical Analysis
Univariate descriptive statistics were calculated for all variables and outliers were identified, investigated, and rectified. Baseline characteristics of intervention and control participants were compared using Pearson‟s and likelihood ratio chi-square tests (categorical variables), t-tests (normally distributed continuous variables), and Kruskal–Wallis tests (non-normally distributed variables). Chi-square tests were used to compare total Simple 7 score and Simple 7 component scores at baseline.
Intention-to-treat analyses were performed using multiple imputation to account for monotone missing data and address selection bias, which may have resulted from analyzing complete cases alone. Patterns of missingness were assessed prior to multiple imputation to ensure that there were no statistically significant differences in baseline characteristics between participants with complete data and those with missing data; none were found. Additionally, there were no differences in patterns of missingness between intervention and control groups. Multiple imputation was conducted using SAS (PROC MI) to create 30 imputed data sets. Baseline and outcome values were imputed for physical activity (minutes of activity per week), healthy diet score, blood glucose (log transformed), BMI, total cholesterol, blood pressure, and education, controlling for study site and age at baseline. All analyses, with the exception of baseline descriptive statistics, were conducted using multiply imputed data.
Improvement scores were calculated for Simple 7 components based on changes between baseline and outcome (24 weeks). Component scores that increased from baseline to outcome (e.g., poor to intermediate) were classified as “improved.” Component scores that remained the same or declined (e.g., ideal to intermediate) were classified as “not improved.” Improvement scores were also calculated for total Simple 7 score. Increases in total Simple 7 score from baseline to outcome were classified as “improved.” If outcome scores were the same as or lower than baseline scores, they were classified as “not improved.”
To assess improvement in total Simple 7 score and individual component scores, unadjusted binomial proportions of participants with improved scores were examined for each treatment arm. Differences in the proportion of improved scores between intervention and control participants were assessed and estimates from all imputed data sets were pooled using PROC MIANALYZE.46–48
Changes in continuous total Simple 7 score were examined using linear mixed models with an intention-to-treat approach. To account for clustering of participants within towns, study site was included as a random effect. Baseline total Simple 7 score, education level, and age were included as covariates. Results from all imputed data sets were combined using PROC MIANALYZE.
To compare multiply imputed analyses with complete case analysis, linear mixed models were re-run using complete case data. A subgroup analysis was also conducted among participants aged ≥60 and older. Linear mixed models were run using imputed data from a separate imputation performed only among participants in this subgroup. All analyses were conducted in 2018–2019 using SAS, version 9.4.
RESULTS
A total of 182 participants were enrolled; 72% attended outcome assessment. Complete data for all Simple 7 measures at both timepoints were available for 55% of participants (Figure 1); there were no differences by baseline demographic factors between the intervention and control groups (Table 1). Several differences in baseline health outcomes (BMI, weight, blood glucose, and total cholesterol) were observed between treatment groups (Table 1). However, there were no significant differences at baseline in total Simple 7 score, categorical Simple 7 score, or any component scores (Appendix Table 3). No adverse effects were reported in either group; one participant in the intervention arm passed away, unrelated to intervention treatment.
Figure 1.
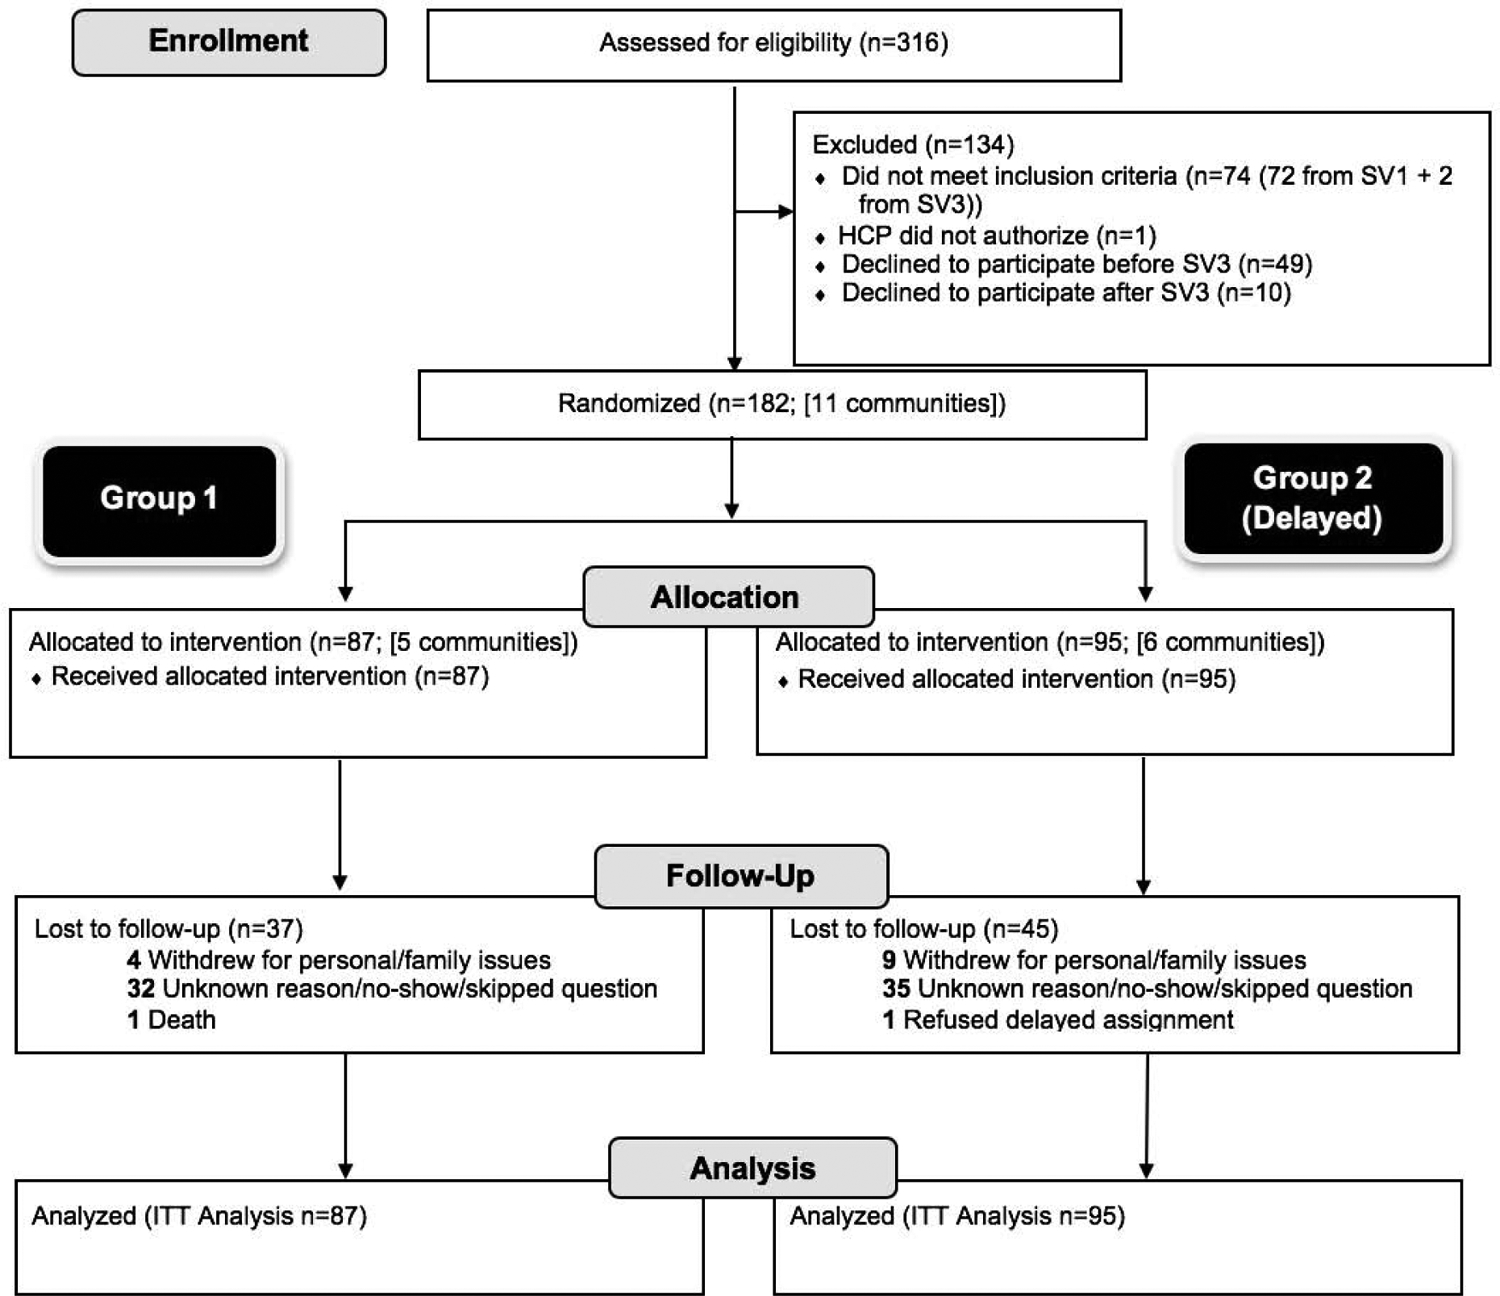
Consolidated standards of reporting trials statement diagram showing study flow: Strong Hearts, Healthy Communities 2.0, New York, 2017–2018.
NY, New York; HCP, healthcare provider; SV, screening visit; ITT, intention-to-treat.
Table 1.
Characteristics of Study Participants at Baseline by Treatment Group
| Intervention (n=87) |
Control (n=95) |
||||
|---|---|---|---|---|---|
| Characteristics | n | Mean/Count (SD/%) | n | Mean/Count (SD/%) | p-value |
| Age | 87 | 58.5 (9.34) | 95 | 55.9 (8.45) | 0.053 |
| Not racial/ethnic minority | 82 | 80 (97.6) | 86 | 84 (97.7) | 0.962a |
| Income | 77 | 85 | 0.242 | ||
| <$25,000 | 12 (15.6) | 17 (20.0) | |||
| $25,000-$50,000 | 22 (28.6) | 15 (17.6) | |||
| >$50,000 | 43 (55.8) | 53 (62.4) | |||
| Marital status | 84 | 87 | 0.329 | ||
| In a relationship | 54 (64.3) | 62 (71.3) | |||
| Not in a relationship | 30 (35.7) | 25 (28.7) | |||
| Education | 85 | 87 | 0.943 | ||
| High school or less | 12 (14.1) | 14 (16.1) | |||
| Technical or vocational school or some college | 18 (21.2) | 17 (19.5) | |||
| College graduate | 30 (35.3) | 33 (37.9) | |||
| Postgrad/professional | 25 (29.4) | 23 (26.4) | |||
| Overall health | 86 | 89 | 0.41 la | ||
| Excellent | 4 (4.7) | 3 (3.4) | |||
| Very good | 22 (25.6) | 17 (19.1) | |||
| Good | 49 (57.0) | 50 (56.2) | |||
| Fair | 11 (12.7) | 19 (21.3) | |||
| Poor | 0 (0.0) | 0 (0.0) | |||
| Smoking | 84 | 87 | 0.840a | ||
| Never | 51 (60.7) | 49 (56.3) | |||
| Former | 32 (38.1) | 37 (42.5) | |||
| Current | 1 (1.2) | 1 (1.2) | |||
| Body weight (kg) | 87 | 92.7 (18.6) | 95 | 100.3 (22.6) | 0.015 |
| Total MET-minutes per week | 86 | 1,056.9 (1,581.1) | 89 | 950.8 (1,139.6) | 0.720b |
| HEI total score | 72 | 59.9 (12.9) | 77 | 57.6 (11.0) | 0.243 |
| Blood glucose (mg/dL) | 85 | 103.5 (15.1) | 95 | 114.5 (37.6) | 0.009 |
| BMI (kg/m2) | 87 | 35.4 (6.8) | 95 | 37.9 (8.5) | 0.034 |
| Total cholesterol (mg/dL) | 85 | 208.8 (30.6) | 95 | 197.8 (40.2) | 0.039 |
| Systolic blood pressure (mmHg) | 87 | 133.5 (15.3) | 95 | 131.8 (16.3) | 0.456 |
| Diastolic blood pressure (mmHg) | 87 | 84.4 (9.8) | 95 | 86.4 (9.3) | 0.156 |
| Total Simple 7 score | 80 | 7.03 (1.80) | 85 | 7.05 (1.75) | 0.936 |
Note: Boldface indicates statistically significant difference between arms (p<0.05). Differences in means for continuous variables were calculated using t-tests in percentages for categorical variables were evaluated with Chi-square tests. Original data is presented; it has not been imputed.
Likelihood ratio checked because of low expected counts, similar result found.
Kruskal-Wallis Test for nonparametric data.
HEI, Healthy Eating Index.
At outcome, 26% of intervention participants had total Simple 7 scores in the “ideal” category compared with 0% of control participants (data not shown). Based on the analysis of improvement scores using multiply imputed data (Figure 2), the proportion of intervention participants with improved total Simple 7 scores was 13% higher than that of control participants (23.1% vs 10.1%, p=0.03 for difference). Significantly more intervention participants improved their physical activity score (41.5%) compared with 21.5% of control participants (20.0% difference, p=0.008). Similarly, 37.3% of intervention participants improved their healthy diet score compared with 19.7% of control participants (17.6% difference, p=0.03). For BMI, 14.5% of intervention participants improved, compared with 2.7% of control participants (11.9% difference, p=0.008).
Figure 2.
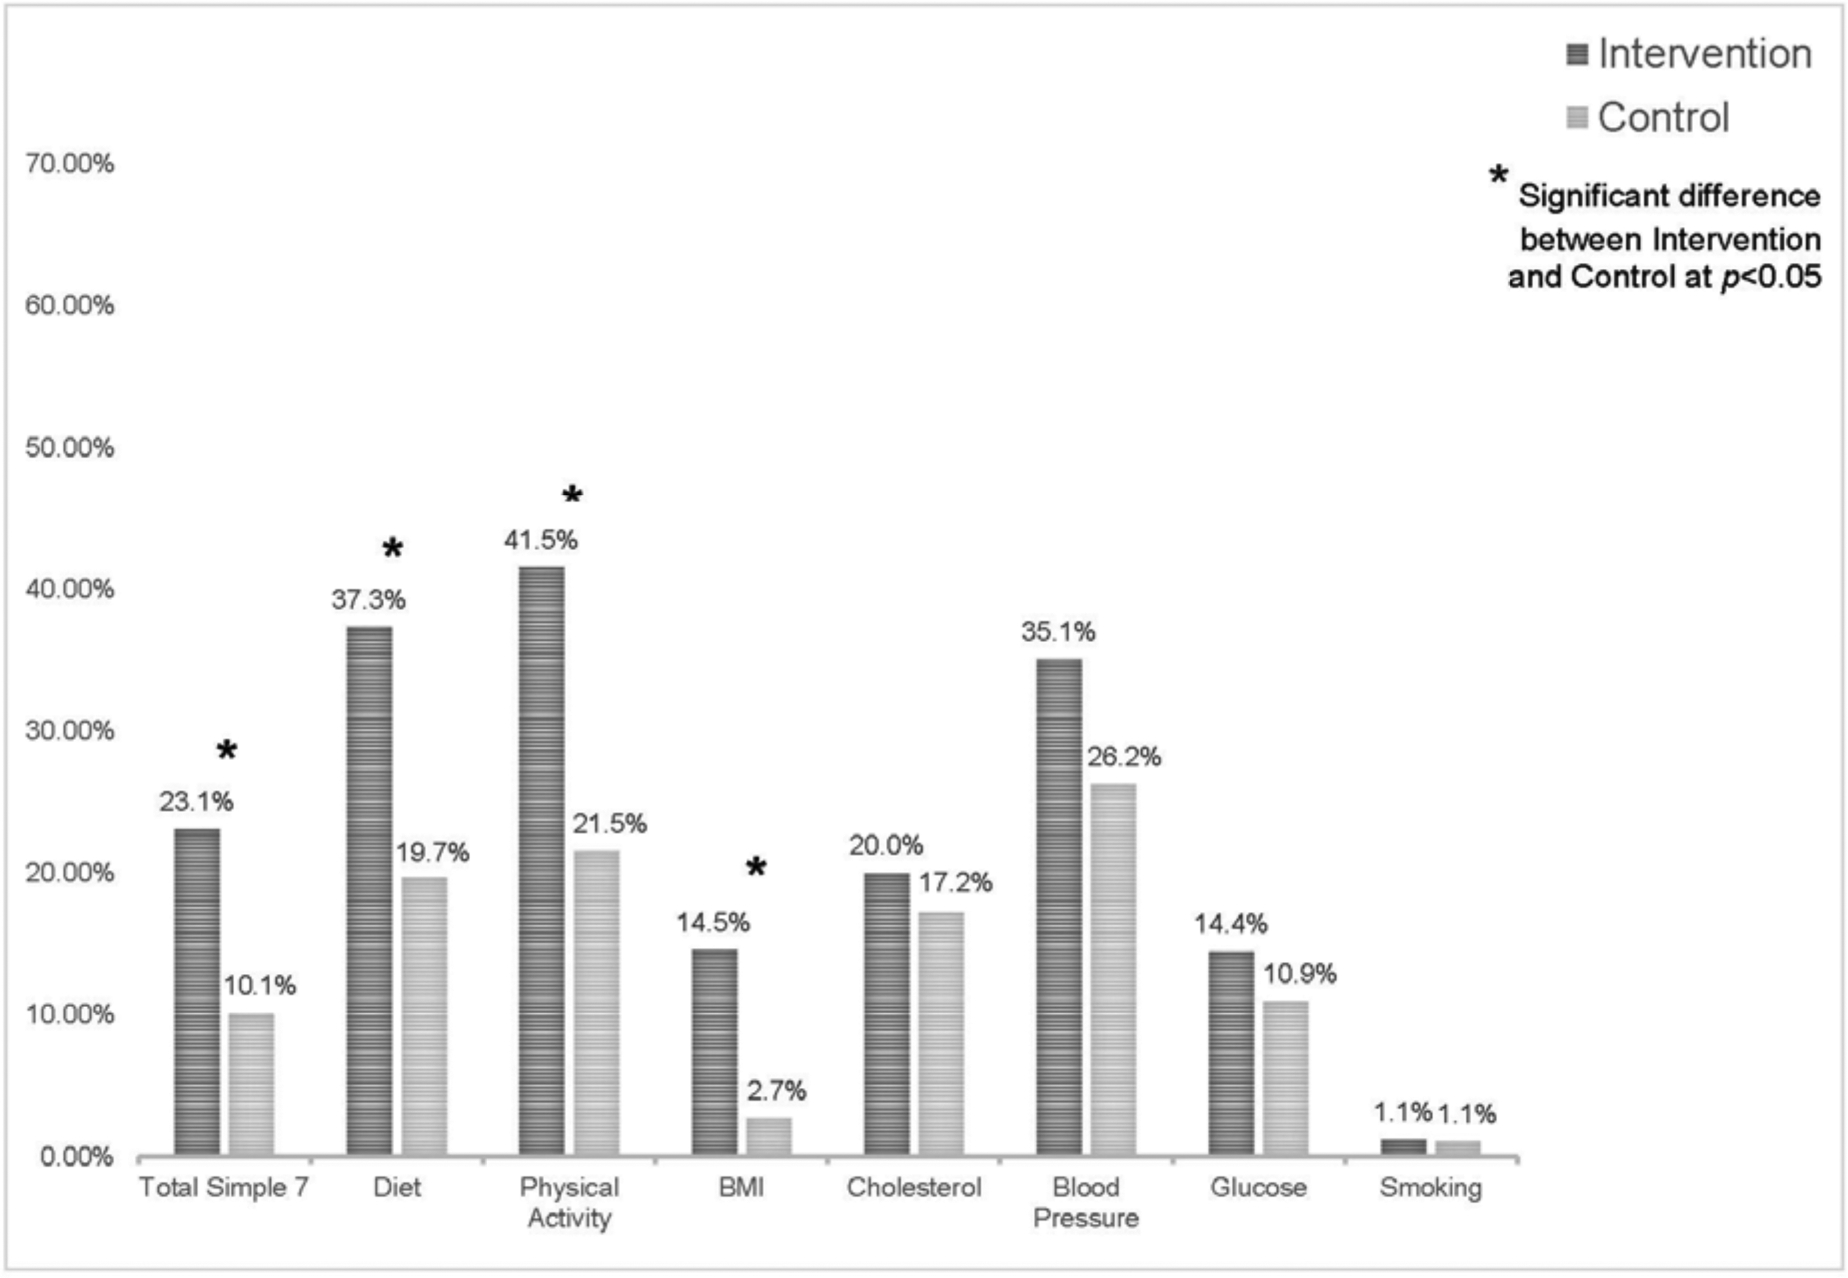
Percent of participants who improved Simple 7 score (N=182).
Note: Percentages were calculated using multiply imputed data.
No significant differences were observed between treatment groups for blood glucose (3.5% difference, p=0.51), total cholesterol (2.8% difference, p=0.66), or blood pressure (8.8% difference, p=0.24). However, within-group changes in these outcomes were in the expected direction. Among intervention participants, 20.0% had improved cholesterol scores, 35.1% had improved blood pressure scores, and 14.4% had improved blood glucose scores. In the control group, 17.2% of participants had improvements in cholesterol scores, with 25.3% and 11.0% improving blood pressure and blood glucose scores, respectively. Owing to the low prevalence of smoking at baseline, improved scores were only observed among 1.2% of intervention participants and 1.1% of control participants (0.1% difference, p=0.514).
Results of the linear mixed-effects models using imputed data are presented in Table 2. Intervention participants demonstrated a significantly greater improvement in Simple 7 score compared with control participants (+1.08 vs +0.05; difference between arms, 1.03; p<0.001) (Table 2). Similar results were observed using complete case data (+1.26 vs +0.09, p=0.017 for difference; data not shown). Among intervention participants aged ≥60 years (n=70), Simple 7 score significantly improved by 1.28 points (p<0.001); the difference between groups was 0.75 points and borderline significant (p=0.063).
Table 2.
Adjusted Multilevel Linear Regression for Change in Total Simple 7 Score
| Intervention | Control | Difference between groups | ||||
|---|---|---|---|---|---|---|
| Multiple imputation results | Estimate (95% CI) | p-value | Estimate (95% CI) | p-value | Estimate (95% CI) | p-value |
| All participants (N=182) | ||||||
| Total Simple 7 score | 1.08 (0.63, 1.53) | <0.001 | 0.05 (−0.35, 0.45) | 0.81 | 1.03 (0.44, 1.61) | <0.001 |
| Participants ≥60 years (N=70) | ||||||
| Total Simple 7 score | 1.28 (0.71, 1.86) | <0.001 | 0.52 (−0.06, 1.11) | 0.08 | 0.75 (−0.04, 1.56) | 0.063 |
Note: Boldface indicates statistical significance (p<0.05). Differences were evaluated using a linear mixed-effects model with multiply imputed data adjusted for education, age, baseline Simple 7 score, and including site as a random effect. Site, baseline age, baseline education, baseline total Simple 7 score, and outcome total Simple 7 score were included in the multiple imputation models. Possible total Simple 7 score ranges from 0 to 14 and ranged from 3 to 12 in this sample. Average baseline total Simple 7 score among the 87 intervention group participants was 7.04 (SD=0.19) and 6.96 (SD=0.18) among the 95 control participants. Among women aged >60 years, mean baseline score in the intervention group was 6.63 (SD=0.32) and 3.36 (SD=0.30) in the control group.
DISCUSSION
Rural women participating in an enhanced multilevel community-based CVD prevention program showed greater improvements in total Simple 7 score and three of seven Simple 7 components, compared with a delayed intervention control group. Higher proportions of improved scores were observed for some Simple 7 components (i.e., physical activity, diet, blood pressure) than for overall Simple 7 score, suggesting that participants likely experienced co-existent increases and decreases in individual component scores. However, meaningful changes in overall Simple 7 score were observed among intervention participants; 23% with improved scores and 26% with “ideal” scores at the end of the intervention.
In the Atherosclerosis Risk in Communities study, where 12,000 adults were followed for 19 years, the risk of CVD was double for those with a “poor” Simple 7 score, compared with those in the intermediate category.26 The number of “ideal” component scores showed a strong correlation with CVD incidence; those with six component scores in the “ideal” category had a 6% cumulative CVD incidence, compared with a 50% incidence for those with no “ideal” component scores.26 Although CVD risk factors and Simple 7 scores are strongly related to future CVD incidence, no RCTs have shown an effect of improved Simple 7 scores on decreased incidence of CVD.
The SHHC-2.0 intervention was a second iteration of the SHHC program; both trials enrolled similar populations of rural women with known CVD risk factors (i.e., aged 40 years and older, sedentary lifestyle, overweight or obese). In the original trial, total Simple 7 score improved by 0.88 points in the intervention arm (p<0.001) and the difference between arms was 0.67 points (p=0.01).31 In the present trial, Simple 7 score improved by 1.26 points in the intervention arm and the difference between arms was 1.17 points. Due to the differences in imputation methods used in each of the trials, comparisons were based on analyses using complete case data. These findings strongly suggest that modifications to the second iteration of SHHC led to enhanced intervention effects. Though SHHC was not powered to detect reductions in CVD risk among older women, there were also significant intervention effects for women aged 60 years and older.
Key modifications that may have contributed to the effectiveness of SHHC-2.0 include the earlier introduction of nutrition education and skill building activities, stronger emphasis on fidelity to physical activity components, and later introduction of civic engagement activities once behavioral elements were established and group cohesion formed among participants. Including more nutrition sessions at the beginning of the program would have given participants more time to absorb and apply the skills learned. Greater fidelity to aerobic exercise and strength training activities would have increased participants‟ fitness levels, as reflected in their improved physical activity scores. Lastly, participants in the original SHHC trial reported feeling overwhelmed with the early introduction of civic engagement activities.49 Introducing these activities halfway through the program would have given participants more time to focus on personal behavioral changes before taking on the civic engagement project. Additional beneficial modifications include a greater emphasis on social support for physical activity and nutrition and increased attention to goal setting and monitoring.
Strengths of the study include the RCT design; focus on high-risk, underserved women; and intention-to-treat analysis using multiple imputation. Key recommendations for multilevel community-based interventions were used in designing the current study, including engaging stakeholders in formative research, selecting activities and partners with strong potential sustainability, linking intervention components to reinforce activities, and conducting ongoing process evaluation.50 Additional strengths include the use of extensive process and outcome data to inform program modifications.
Limitations
Given the focus on rural, medically underserved areas, these results may not generalize to other rural (or urban) residents. Nevertheless, urban areas are often medically underserved and the multilevel intervention would likely benefit women in those areas. Attrition was somewhat higher in the present study compared to the original trial. Simple 7 outcome data were available for 60% of participants in SHHC-2.0, whereas they were available for 65% in the initial study. For SHHC-2.0, most data collection reminders were shifted from the local educators to the university-based research staff. Though this was done to reduce the burden on educators, it may have contributed to lower participant retention rates. Future research might examine additional facilitators and barriers to retention in CVD risk reduction programs with rural women. Results from the multiple imputation models were similar to the analyses restricted to complete case data, suggesting that selective attrition was unlikely to be a cause of the estimated intervention effects.
CONCLUSIONS
Rural women have higher rates of CVD risk factors, including obesity, physical inactivity, and poor diet, and face unique challenges to making healthy choices. It is essential to evaluate and disseminate effective programs to improve these risk factors, as well as aspects of the social and built environments that make maintaining healthy behaviors more difficult. This study demonstrated that the refined SHHC-2.0 program, an experiential multilevel intervention for midlife and older rural women, can improve CVD risk factors, including the Simple 7 composite CVD risk score, which is strongly related to future CVD incidence. It is a high public health priority to provide relevant, effective programming for this hard-to-reach population; the benefits of a supportive group may be especially important in rural places.40 Additionally, future studies should rigorously evaluate dissemination of this effective program in various settings with diverse populations and could include longer follow-up to determine maintenance of behavior and health outcomes as well as CVD incidence.
Supplementary Material
ACKNOWLEDGMENTS
The authors wish to thank Brian Lo, Jennifer Garner, Urshila Sriram, and Maria Rosario Donoso for their assistance with data collection; the Strong Hearts, Healthy Communities (SHHC) educators: Valerie Gay, Donna Pesta, Debbie Seguin, Linda Robbins, Mandy Robinson, Cailin Kowalewski, and Lorraine Serow; and the SHHC and SHHC-2.0 study participants.
This study was supported by grant R01 HL120702 from the NIH and the National Heart, Lung, and Blood Institute as well as the U.S. Department of Agriculture, National Institute of Food and Agriculture, Hatch/Multi State [1013938]. The funders/sponsors had no role in the design and conduct of the study; collection, management, analysis, and interpretation of the data; preparation, review, or approval of the manuscript; or decision to submit the manuscript for publication.
Footnotes
Publisher's Disclaimer: This is a PDF file of an unedited manuscript that has been accepted for publication. As a service to our customers we are providing this early version of the manuscript. The manuscript will undergo copyediting, typesetting, and review of the resulting proof before it is published in its final form. Please note that during the production process errors may be discovered which could affect the content, and all legal disclaimers that apply to the journal pertain.
No financial disclosures were reported by the authors of this paper.
REFERENCES
- 1.Cossman JS, James WL, Cosby AG, Cossman RE. Underlying causes of the emerging nonmetropolitan mortality penalty. Am J Public Health. 2010;100(8):1417–1419. 10.2105/ajph.2009.174185. [DOI] [PMC free article] [PubMed] [Google Scholar]
- 2.National Center for Health Statistics. Health, United States, 2017: with Special Feature on Mortality. Hyattsville, MD; 2018. [PubMed] [Google Scholar]
- 3.Benjamin EJ, Muntner P, Alonso A, et al. Heart disease and stroke statistics-2019 update: a report from the American Heart Association. Circulation. 2019;139(10):E56–E528. 10.1161/cir.0000000000000659. [DOI] [PubMed] [Google Scholar]
- 4.Moy E, Garcia MC, Bastian B, et al. Leading causes of death in nonmetropolitan and metropolitan areas - United States, 1999–2014. MMWR Surveill Summ. 2017;66(1):1–8. 10.15585/mmwr.ss6601a1. [DOI] [PMC free article] [PubMed] [Google Scholar]
- 5.Vaughan AS, Ritchey MD, Hannan J, Kramer MR, Casper M. Widespread recent increases in county-level heart disease mortality across age groups. Ann Epidemiol. 2017;27(12):796–800. 10.1016/j.annepidem.2017.10.012. [DOI] [PMC free article] [PubMed] [Google Scholar]
- 6.Meit M, Knudson A, Gilbert T, et al. The 2014 Update of the Rural-Urban Chartbook. Bethesda, MD: Rural Health Reform Policy Research Center; October 2014. [Google Scholar]
- 7.Crosby RA, Wendel ML, Vanderpool RC, Casey BR. Rural Populations and Health: Determinants, Disparities, and Solutions. Hoboken, NJ: John Wiley & Sons; 2012. [Google Scholar]
- 8.American College of Obstetricians and Gynecologists. ACOG Committee Opinion No. 586: Health disparities in rural women. Obstet Gynecol. 2014;123(2):384–388. 10.1097/01.AOG.0000443278.06393.d6. [DOI] [PubMed] [Google Scholar]
- 9.Hansen AY, Meyer MRU, Lenardson JD, Hartley D. Built environments and active living in rural and remote areas: a review of the literature. Curr Obes Rep. 2015;4(4):484–493. 10.1007/s13679-015-0180-9. [DOI] [PubMed] [Google Scholar]
- 10.Olsen J An integrative review of literature on the determinants of physical activity among rural women. Public Health Nurs. 2013;30(4):288–311. 10.1111/phn.12023. [DOI] [PubMed] [Google Scholar]
- 11.Hageman PA, Pullen CH, Hertzog M, Boeckner LS. Effectiveness of tailored lifestyle interventions, using web-based and print-mail, for reducing blood pressure among rural women with prehypertension: main results of the Wellness for Women: DASHing towards Health clinical trial. Int J Behav Nutr Phys Act. 2014;11:148 10.1186/s12966-014-0148-2. [DOI] [PMC free article] [PubMed] [Google Scholar]
- 12.Fahs PS, Pribulick M, Williams IC, James GD, Rovynak V, Seibold-Simpson SM. Promoting heart health in rural women. J Rural Health. 2013;29(3):248–257. 10.1111/j.1748-0361.2012.00442.x. [DOI] [PMC free article] [PubMed] [Google Scholar]
- 13.Ard JD, Carson TL, Shikany JM, et al. Weight loss and improved metabolic outcomes amongst rural African American women in the Deep South: six-month outcomes from a community-based randomized trial. J Intern Med. 2017;282(1):102–113. 10.1111/joim.12622. [DOI] [PMC free article] [PubMed] [Google Scholar]
- 14.O‟Brien T, Jenkins C, Amella E, Mueller M, Moore M, Hathaway D. An Internet-assisted weight loss intervention for older overweight and obese rural women: a feasibility study. Comput Inform Nurs. 2016;34(11):513–519. 10.1097/cin.0000000000000275. [DOI] [PubMed] [Google Scholar]
- 15.Scarinci IC, Moore A, Wynn-Wallace T, Cherrington A, Fouad M, Li YF. A community-based, culturally relevant intervention to promote healthy eating and physical activity among middle-aged African American women in rural Alabama: findings from a group randomized controlled trial. Prev Med. 2014;69:13–20. 10.1016/j.ypmed.2014.08.016. [DOI] [PMC free article] [PubMed] [Google Scholar]
- 16.Khare MM, Koch A, Zimmermann K, Moehring PA, Geller SE. Heart Smart for Women: a community-based lifestyle change intervention to reduce cardiovascular risk in rural women. J Rural Health. 2014;30(4):359–368. 10.1111/jrh.12066. [DOI] [PubMed] [Google Scholar]
- 17.Parker V, Coles C, Logan B, Davis L. The LIFE Project: a community-based weight loss intervention program for rural African American women. Fam Community Health. 2010;33(2):133–143. 10.1097/fch.0b013e3181d594d5. [DOI] [PMC free article] [PubMed] [Google Scholar]
- 18.Folta SC, Lichtenstein AH, Seguin RA, Goldberg JP, Kuder JF, Nelson ME. The StrongWomen–Healthy Hearts Program: reducing cardiovascular disease risk factors in rural sedentary, overweight, and obese midlife and older women. Am J Public Health. 2009;99(7):1271–1277. 10.2105/ajph.2008.145581. [DOI] [PMC free article] [PubMed] [Google Scholar]
- 19.Koh HK, Piotrowski JJ, Kumanyika S, Fielding JE. Healthy People: a 2020 vision for the social determinants approach. Health Educ Behav. 2011;38(6):551–557. 10.1177/1090198111428646. [DOI] [PubMed] [Google Scholar]
- 20.Casper M, Barnett E, Halverson J, et al. Women and Heart Disease: An Atlas of Racial and Ethnic Disparities in Mortality. 2nd ed. Atlanta, GA: CDC; 2000. [PubMed] [Google Scholar]
- 21.Brewer LC, Balls-Berry JE, Dean P, Lackore K, Jenkins S, Hayes SN. Fostering African-American Improvement in Total Health (FAITH!): an application of the American Heart Association‟s Life‟s Simple 7™ among Midwestern African-Americans. J Racial Ethn Health Disparities. 2017;4(2):269–281. 10.1007/s40615-016-0226-z. [DOI] [PMC free article] [PubMed] [Google Scholar]
- 22.Castro A, Oliveira N, Ribeiro F, Oliveira J. Impact of educational interventions on primary prevention of cardiovascular disease: a systematic review with a focus on physical activity. Eur J Gen Pract. 2017;23(1):59–68. 10.1080/13814788.2017.1284791. [DOI] [PMC free article] [PubMed] [Google Scholar]
- 23.Tovar J, Johansson M, Bjorck I. A multifunctional diet improves cardiometabolic-related biomarkers independently of weight changes: an 8-week randomized controlled intervention in healthy overweight and obese subjects. Eur J Nutr. 2016;55(7):2295–2306. 10.1007/s00394-015-1039-2. [DOI] [PubMed] [Google Scholar]
- 24.Al Mheid I, Kelli HM, Ko YA, et al. Effects of a health-partner intervention on cardiovascular risk. J Am Heart Assoc. 2016;5(10):e004217 10.1161/JAHA.116.004217. [DOI] [PMC free article] [PubMed] [Google Scholar]
- 25.Lloyd-Jones DM, Hong Y, Labarthe D, et al. Defining and setting national goals for cardiovascular health promotion and disease reduction: the American Heart Association‟s Strategic Impact Goal through 2020 and beyond. Circulation. 2010;121(4):586–613. 10.1161/circulationaha.109.192703. [DOI] [PubMed] [Google Scholar]
- 26.Folsom AR, Yatsuya H, Nettleton JA, Lutsey PL, Cushman M, Rosamond WD. Community prevalence of ideal cardiovascular health, by the American Heart Association definition, and relationship with cardiovascular disease incidence. J Am Coll Cardiol. 2011;57(16):1690–1696. 10.1016/j.jacc.2010.11.041. [DOI] [PMC free article] [PubMed] [Google Scholar]
- 27.Folsom AR, Shah AM, Lutsey PL, et al. American Heart Association‟s Life‟s Simple 7: avoiding heart failure and preserving cardiac structure and function. Am J Med. 2015;128(9):970–976.e2. 10.1016/j.amjmed.2015.03.027. [DOI] [PMC free article] [PubMed] [Google Scholar]
- 28.Garg PK, O‟Neal WT, Mok Y, Heiss G, Coresh J, Matsushita K. Life‟s Simple 7 and peripheral artery disease risk: the Atherosclerosis Risk in Communities Study. Am J Prev Med. 2018;55(5):642–649. 10.1016/j.amepre.2018.06.021. [DOI] [PMC free article] [PubMed] [Google Scholar]
- 29.Foraker RE, Abdel-Rasoul M, Kuller LH, et al. Cardiovascular health and incident cardiovascular disease and cancer: the Women‟s Health Initiative. Am J Prev Med. 2016;50(2):236–240. 10.1016/j.amepre.2015.07.039. [DOI] [PMC free article] [PubMed] [Google Scholar]
- 30.Ogunmoroti O, Oni E, Michos ED, et al. Life‟s Simple 7 and incident heart failure: the Multi-Ethnic Study of Atherosclerosis. J Am Heart Assoc. 2017;6(6):e005180 10.1161/jaha.116.005180. [DOI] [PMC free article] [PubMed] [Google Scholar]
- 31.Seguin RA, Paul L, Folta SC, et al. Strong Hearts, Healthy Communities: a community-based randomized trial for rural women. Obesity (Silver Spring). 2018;26(5):845–853. 10.1002/oby.22158. [DOI] [PMC free article] [PubMed] [Google Scholar]
- 32.Sriram U, Sandreuter K, Graham M, et al. Process evaluation of Strong Hearts, Healthy Communities: a rural community-based cardiovascular disease prevention program. J Nutr Educ Behav. 2019;51(2):138–149. 10.1016/j.jneb.2018.10.011. [DOI] [PMC free article] [PubMed] [Google Scholar]
- 33.Seguin R, Graham M, Eldridge G, et al. Strong Hearts for New York: a multilevel community randomized cardiovascular disease risk reduction intervention for rural women. Contemp Clin Trials. 2019;82:17–24. 10.1016/j.cct.2019.05.005. [DOI] [PMC free article] [PubMed] [Google Scholar]
- 34.U.S. Department of Agriculture Economic Research Service. 2010 Rural-Urban Commuting Area (RUCA) Codes. www.ers.usda.gov/data-products/rural-urban-commuting-area-codes/documentation/. Accessed December 5, 2019.
- 35.HHS. Health Resources & Services Administration. HPSA Find. https://datawarehouse.hrsa.gov/tools/analyzers/hpsafind.aspx. Accessed December 5, 2019.
- 36.Seguin RA, Eldridge G, Graham ML, Folta SC, Nelson ME, Strogatz D. Strong Hearts, Healthy Communities: a rural community-based cardiovascular disease prevention program. BMC Public Health. 2016;16:86 10.1186/s12889-016-2751-4. [DOI] [PMC free article] [PubMed] [Google Scholar]
- 37.Borson S, Scanlan J, Brush M, Vitaliano P, Dokmak A. The Mini-Cog: a cognitive „vital signs‟ measure for dementia screening in multi-lingual elderly. Int J Geriatr Psychiatry. 2000;15(11):1021–1027. . [DOI] [PubMed] [Google Scholar]
- 38.Sriram U, Morgan EH Graham M, Folta S, Seguin R. Support and sabotage:a qualitative study of social influences on health behaviors among rural adults. J Rural Health. 2018;34(1):88–97. 10.1111/jrh.12232. [DOI] [PMC free article] [PubMed] [Google Scholar]
- 39.Folta SC, Goldberg JP, Lichtenstein AH, Seguin R, Reed PN, Nelson ME. Factors related to cardiovascular disease risk reduction in midlife and older women: a qualitative study. Prev Chronic Dis. 2008;5(1):A06. [PMC free article] [PubMed] [Google Scholar]
- 40.Lo BK, Morgan EH, Folta SC, et al. Environmental influences on physical activity among rural adults in Montana, United States: views from built environment audits, resident focus groups, and key informant interviews. Int J Environ Res Public Health. 2017;14(10):1173 10.3390/ijerph14101173. [DOI] [PMC free article] [PubMed] [Google Scholar]
- 41.Zimmermann K, Carnahan LR, Peacock NR. Age-associated perceptions of physical activity facilitators and barriers among women in rural southernmost Illinois. Prev Chronic Dis. 2016;13:160247 10.5888/pcd13.160247. [DOI] [PMC free article] [PubMed] [Google Scholar]
- 42.Seguin R, Economos C, Nelson M, Hyatt R, Palombo R, Reed P. Design and national dissemination of the StrongWomen Community Strength Training Program. Prev Chronic Dis. 2008;5(1):A25. [PMC free article] [PubMed] [Google Scholar]
- 43.Folta SC, Seguin RA, Chui KK, et al. National dissemination of StrongWomen–Healthy Hearts: a community-based program to reduce risk of cardiovascular disease among midlife and older women. Am J Public Health. 2015;105(12):2578–2585. 10.2105/ajph.2015.302866. [DOI] [PMC free article] [PubMed] [Google Scholar]
- 44.Seguin RA, Folta SC, Sehlke M, et al. The StrongWomen Change Clubs: engaging residents to catalyze positive change in food and physical activity environments. J Environ Public Health. 2014;2014:162403 10.1155/2014/162403. [DOI] [PMC free article] [PubMed] [Google Scholar]
- 45.Craig C, Marshall A, Sjostrom M, et al. International Physical Activity Questionnaire: 12-country reliability and validity. Med Sci Sports Exerc. 2003;35(8):1381–1395. 10.1249/01.MSS.0000078924.61453.FB. [DOI] [PubMed] [Google Scholar]
- 46.Li K-H, Meng X-L, Raghunathan TE, Rubin DB. Significance levels from repeated p-values with multiply-imputed data. Stat Sin. 1991;1(1):65–92. [Google Scholar]
- 47.Rubin DB. Multiple Imputation for Nonresponse in Surveys. New York, NY: John Wiley and Sons; 1987. [Google Scholar]
- 48.Ratitch B, Lipkovich L, O‟Kelly M. Combining analysis results from multiply imputed categorical data. PharmaSUG 2013 Conference Paper website. https://pharmasug.org/proceedings/2013/SP/PharmaSUG-2013-SP03.pdf. Published 2013. Accessed December 5, 2019. [Google Scholar]
- 49.Seguin R, Sriram U, Graham M. Integrating civic engagement into a behavior change intervention to reduce cardiovascular disease in rural women. Ann Behav Med. 2017;51(suppl 1):S818–S819. 10.1007/s12160-017-9903-3. [DOI] [Google Scholar]
- 50.Gittelsohn J, Novotny R, Trude A, Butel J, Mikkelsen B. Challenges and lessons learned from multi-level multi-component interventions to prevent and reduce childhood obesity. Int J Environ Res Public Health. 2019;16(1):30 10.3390/ijerph16010030. [DOI] [PMC free article] [PubMed] [Google Scholar]
Associated Data
This section collects any data citations, data availability statements, or supplementary materials included in this article.