

Abstract
Different NMR methodologies have been considered in studying water as a part of the structure of heterogeneous biosystems. The current work mostly describes NMR techniques to investigate slow translational dynamics of molecules affecting anisotropic properties of polymers and biomaterials. With these approaches, information about organized structures and their stability could be obtained in conditions when external factors affect biomolecules. Such changes might include rearrangement of macromolecular conformations at fabrication of nano-scaffolds for tissue engineering applications. The changes in water–fiber interactions could be mirrored by the magnetic resonance methods in various relaxations, double-quantum filtered (DQF), 1D and 2D translational diffusion experiments. These findings effectively demonstrate the current state of NMR studies in applying these experiments to the various systems with the anisotropic properties. For fibrous materials, it is shown how NMR correlation experiments with two gradients (orthogonal or collinear) encode diffusion coefficients in anisotropic materials and how to estimate the permeability of cell walls. It is considered how the DQF NMR technique discovers anisotropic water in natural polymers with various cross-links. The findings clarify hydration sites, dynamic properties, and binding of macromolecules discovering the role of specific states in improving scaffold characteristics in tissue engineering processes. Showing the results in developing these NMR tools, this review focuses on the ways of extracting information about biophysical properties of biomaterials from the NMR data obtained.
Keywords: NMR techniques, Relaxation times, DQF NMR, Cross-relaxation, Translational diffusion, Anisotropy, Natural biopolymer
Introduction
Many properties of biomaterials depend significantly on water–biopolymer interactions. The interactions between water and biomolecules were investigated by NMR methods for a long period of time (Kuntz et al. 1969; Wüthrich et al. 1996; Krishman 1996; Wider 1998; Szuminska et al. 2001; Van-Quynh et al. 2003; Cosgrove et al. 2007; Rodin et al. 2014, 2017; Belton 2011; Foster et al. 2016; Mandala et al. 2018; Yazawa et al. 2016; Zubow et al. 2016; Kerch 2018; Callaghan and Lelievre 1986). The data obtained discovered hydration features and resulted in the development of the hydration models (Kuntz et al. 1969; Kuntz and Kauzmann 1974; Mathur-De Vre 1979; Wüthrich et al. 1996; Otting 1997; Halle 2004; Cosgrove et al. 2007; Belton 2011; Xie et al. 2019). The NMR methods studied also frozen solutions of biomacromolecules and discovered the proton signals of mobile water at low temperatures (Kuntz et al. 1969; Mathur-De Vre 1979; Siemer et al. 2012). Conformational changes of proteins are dependent on bound water. It plays the main role in exchange, fast and slow internal motions, and molecular diffusion in restricted compartments (Senturia and Robinson 1970; Rodin et al. 1984; Wüthrich et al. 1996; Ishima and Torchia 2000; Halle 2004; Cosgrove et al. 2007; Foster et al. 2007; Song et al. 2008; Belton 2011; Rodin 2018a, 2018b, 2018c). The different proton fractions have been considered to characterize mobility of water molecules near the biomacromolecules showing the details of protein hydration (Migchelsen and Berendsen 1973; Rodin et al. 1984; Wüthrich et al. 1996; Otting 1997; Szuminska et al. 2001; Van-Quynh et al. 2003; Martini et al. 2013; Rodin 2018c).
With the aid of hydration studies, the changes in dynamics of macromolecules can be clarified for various environments (Krishman 1996; Wider 1998; Szuminska et al. 2001; Foster et al. 2007; Rodin 2017; Kerch 2018; Xie et al. 2019). Nowadays, NMR gives various tools for successful studying of different molecules and macromolecules of biotechnological systems. Using some nuclei-isotopes as the labels in proteins, it is possible to carry out effective multidimensional experiments to detail the protein structure and interactions (Foster et al. 2007; Martini et al. 2013; Foster et al. 2016; Mandala et al. 2018). The proton and deuterium relaxations are used to study the hydration exchange and dynamics of globular proteins resulting in information about the internal motion of proton groups in protein chains (Denisov and Halle 1995; Krishman 1996; Otting 1997; Ishima and Torchia 2000; Mittermaier and Kay 2006; Foster et al. 2007; Zhang et al. 2015; Rodin 2017; Mandala et al. 2018).
This work considers NMR approaches and basic techniques which were used quite frequently in studying water–macromolecule interactions, discovering the details of hydration and macromolecule dynamics with the factors responsible for biological functions in complex biomaterials (Rodin 1997; Mittermaier et al. 2006; Belton 2011; Foster et al. 2016; Rodin 2018c; Tarannum et al. 2018). The review highlights those tools that enable the studies of functional properties of materials in drug delivery (Rodin and Izmailova 1995; Huang and Melacini 2006; Baldwin and Kay 2009; Zhang et al. 2013, 2015; Bernini et al. 2011). Previously published reviews on protein hydration in solutions of biomacromolecules and systems with low hydration level could be recommended as well (Kuntz 1971; Wider 1998; Otting 1997; Krishman 1996; Halle 2004; Belton 2011; Huang and Melacini 2006; Martini et al. 2013; Rodin 2018b, 2018c). Typically, many published works considered the applications of NMR spectroscopy on the nuclei 1H, 13C, 31P, and 15N. However, in addition to past publications on hydration studies of biopolymers and biomaterials, some important NMR methods can be considered again with an attempt to find any correlations of NMR parameters with biological functions or properties of biomacromolecules. The advantages of these NMR tools have not been presented to biophysicists and tissue engineers in details to apply those in studying functions and properties of cellular systems and biotechnology products. At this understanding, a feedback from biophysicists to physicists can stimulate next development of these NMR methods in studying biomacromolecules.
The current paper is looking for a way to study water–macromolecular systems with maximal effectiveness in getting detailed information about interactions. The important question is which NMR tools can be used further in studying biological functions of biotechnological materials. Pulse field gradient (PFG) NMR in one and two dimensions, NMR relaxations (spin–lattice (T1), spin–spin (T2), and cross-relaxation times), MRI, and multiple-quantum-filtered (MQF) NMR methods were effectively applied for studies of complex natural porous biomaterials, tissues in normal and disease states, cells, and fermentation processes to regulate different properties including diffusion characteristics and dynamics of molecules in anisotropic systems (Rodin 1997, 2017; Eliav et al. 2012; Ikoma et al. 2001; Navon et al. 2001; Pothirajan et al. 2014; Seo et al. 1999; Rodin et al. 1984; Rodin and Knight 2003a; Rodin and Knight 2003b; Rodin 2004; Kotecha et al. 2013a). An anisotropic motion of molecules in biomaterials results in residual dipole–dipole interactions. Second-rank tensor responsible for the double-quantum-filtered (DQF) signals can be produced to monitor the residual proton–proton dipolar interactions (Tsoref et al. 1998; Seo et al. 1999; Eliav et al. 2012; Rodin 2017). The systems with isotropic motion do not show any DQF spectra. With DQF NMR spectroscopy, information about local and macroscopic order is obtained. Thus, effective anisotropic molecular motion can be studied (Ikoma et al. 2001; Navon et al. 2001). For instance, the MQF methodology on protons and sodium atoms (Shinar and Navon 2006) and T1 and T2 relaxation times were applied to investigate the chondrogenesis and osteogenesis of collagen tissues (Kotecha et al. 2013b).
In addition to MQF NMR methods, the present work considers also 1D and 2D NMR diffusion methods in studying tissue-engineering materials (Kotecha et al. 2013a, 2013b; Pothirajan et al. 2014; Rodin 2018a) showing how to observe an anisotropy and restriction diffusion with estimates of a restricted distance and water permeability (Tanner 1979; Rodin et al. 2014; Rodin 2018c). NMR parameters (T1, T2, and measured diffusion coefficient) studied in tissue-engineering processes correlated with the growth of tissues. Thus, they can be used in characterizing the scaffolds (Pothirajan et al. 2014; Kotecha et al. 2013a, 2013b, 2013c). MQF NMR has been applied for the study of the tissue-engineered cartilage and showed that collagen molecules in such a cartilage have no order in orientation (Kotecha 2013b, c). Two-dimensional correlation NMR spectroscopy discovers the distributions of diffusion coefficients in two orthogonal directions in the anisotropic materials (Callaghan and Furó 2004; Callaghan et al. 2007; Callaghan 2011; Rodin 2013; Rodin 2017; Rodin 2019). The 2D diffusion maps can be used in studying tissues with anisotropic structure and a local anisotropy (on microscopic scale) in the presence of isotropy (Rodin et al. 2013, 2014; Rodin 2017, 2018b; Callaghan 2005, 2011). So, the work highlights the NMR experiments on studying water in different biomaterials, which results in understanding how the measured NMR parameters and correlations with biomedical engineering findings can be used to analyze the functions of tissues and cells (Rodin 2017; Rodin 2018b; Kotecha et al. 2013c).
Introduction to techniques for NMR experiments and models
NMR (T1 and T2) relaxation times and model approaches
As a first step, some publications on briefly basics NMR and NMR advantages in biophysics could be recommended for reading to better understand the advanced NMR experiments on T1, T2 relaxation, magnetic relaxation dispersion, NMR diffusion, nuclear Overhauser effect, and 2D NMR (Wider 1998; Rodin 2004, 2018c; Navon et al. 2001; Ikoma et al. 2001; Eliav et al. 2012; Keeler 2010; Callaghan 2011; Blümich 2019; Bouazizi and Guillot 2019). Additionally, some characteristics of main NMR techniques could be considered further. The time constant T1 characterizes a longitudinal (spin–lattice) relaxation and describes the average lifetime of nuclei in the state with higher energy. At the big T1 values, a slower relaxation has a place (Otting 1997; Wider 1998; Szuminska et al. 2001; Rodin 2018a, 2018b). The T1 values are depending on viscosity and temperature. This NMR parameter informs about molecular mobility in the systems under study. In order to measure T1, an NMR experiment with inversion recovery (IR) pulse sequence 180°–τ–90° is commonly used. It measures a magnetization as a function of time interval τ between RF pulses 180° and 90°. In the single exponential case, the recovery of magnetization Mτ = f(τ) is following to the expression Mτ = M0[1–2α exp(τ/T1)] (Rodin 2004; Callaghan 2011; Blümich 2019). The parameter α in this formula is applied if π pulse is not perfect. For perfect π pulse, α = 1. The spin–spin relaxation has a place at the interaction between neighboring nuclei with different magnetic quantum states. The frequencies of these nuclei are identical. The range of T2 values is variable from 10−5 s (solids) to 1–10 s (liquids). With experiment of 90°–τ–180°, it is possible to find the T2 value if to measure the echo signal at t = 2τ varying τ value. The improved methods of this experiment are the Carr–Purcell (CP) pulse sequence (with series of 180° pulses to produce many echoes in one experiment) and the Carr–Purcell–Meiboom–Gill (CPMG) train as modification of the CP sequence with an additional 90° phase shift of 180° pulse with respect to the initial 90° pulse (Callaghan 2001; Rodin 2004, 2017; Keeler 2010; Blümich 2019). When a distribution of NMR relaxation times is presented in biomaterials, an analysis of multicomponent CPMG decay can be done using an inverse Laplace transform (ILT) resulting in the registration of several T2 peaks or broad T2 spectrum (Menon et al. 1991; Callaghan et al. 2007; Rodin 2018c) (Fig. 1).
Fig. 1.
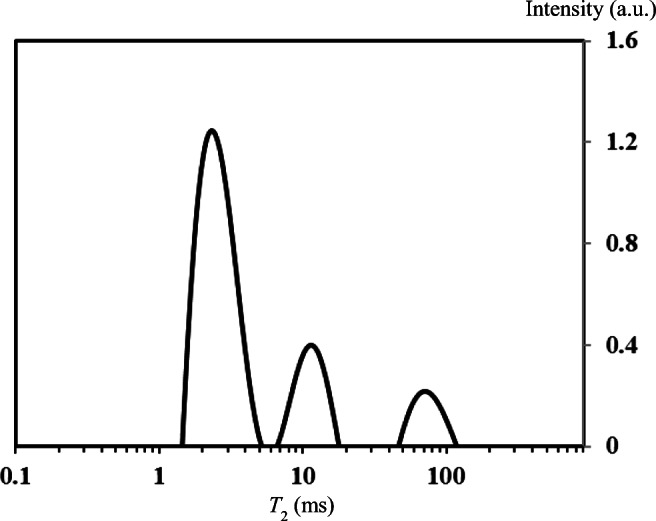
Plot of T2 distribution obtained by 1D ILT analysis of CPMG data measured on wet wood sample (spruce). T = 298 K, and a proton frequency = 400 MHz. The moisture content of this piece of wood is higher than the fiber saturation point (FSP). The FSP is the point at which all the free water has been removed, and there is only bound water left. This is mostly between 25 and 30% moisture content (Rodin 2018c). Below the FSP, there should be one or two T2 values in the range of 1 to 15 ms. Above the FSP, in addition to the short components, a long component between 20 and 100 ms appears. So, there are three components in total above the FSP (Rodin 2019). Y-scale is relative intensity in arbitrary units.
The structure of many biomaterials and tissues can be considered as complex porous media with the properties which are essential to realize biological functions and applications (Seo et al. 1999; Navon et al. 2001; Eliav et al. 2012; Kotecha et al. 2013a; Rodin 2018a). In such a case, surface relaxation should be considered in studying pore sizes (Senturia and Robinson 1970; Menon et al. 1991). Some publications (Kotecha et al. 2013b; Pothirajan et al. 2014) consider the geometrical properties of the porous bone with the aim to find a parameter to describe osteoporosis and other bone metabolic diseases (Zhang et al. 2013). For example, Pothirajan et al. (2014) for an indication of the water environment considered the ratio T2/T1 as follows: the smaller ratio for osteogenic tissues informs about complex or more solid osteogenic constructs when compared to the chondrogenic constructs.
For protons of liquid confined in the pore space of materials, a relaxation rate is increased one in comparison with rate in bulk solution (Peemoeller et al. 1981; D’Orazio et al. 1990; Henkelman et al. 1994; Takamiya et al. 2000; Callaghan 2011; Rodin et al. 2004b, 2013; Rodin 2017, 2018c). In order to consider the interactions at the liquid–solid interface and to use theoretical models for some applications, it is necessary to assume the short-range surface interactions and a fast exchange of molecules between the bulk fraction and the liquid on the surface (Mendelson et al. 1994; Gran and Hansent 1998; Song et al. 2008; Takemura et al. 2012; Palmer 2014; Rodin 2018c). In such a case, there will be averaging between different environments. Then, the magnetization would be decaying exponentially with a relaxation rate which is averaging between the bulk and surface rates in accordance with the populations of environments (Peemoeller et al. 1981; D’Orazio et al. 1990; Rodin 2018c):
| 1 |
Here, the thickness of a surface layer is λ, the surface area is S, and the volume of the pore is V. Ts and Tb are the surface and the bulk relaxation times (T1 or T2). However, Eq. (1) can have a more simple presentation if to introduce some notation for the strength of the surface relaxation ρ (D’Orazio et al. 1990; Rodin 2018c) as physical constant not depending on the size of the pore. When Tb > > Ts, then Eq. (1) for the case of spin–spin relaxation rate 1/T2 will be following the Eq. (2) (D’Orazio et al. 1990; Jehng et al. 1996):
| 2 |
When the pore has surface area S and the volume V, then, for the T2 experiment, the echo intensity at a time t will be presented in accordance with Eq. (3) (Rodin 2018c; Jehng et al. 1996):
| 3 |
Commonly, biotechnological dispersion is heterogeneous porous media. Water in the pores of such a media is not in fast exchange indeed (Jehng et al. 1996; Rodin 2018c). The observed magnetization in porous materials can be considered as a sum of signals for all compartments. It is important to emphasize also that, in porous biomaterial, the values of S/V for different areas are various. So, the relaxation rates of water will be different for these S/V ratios. Then, the total signal of echo in the material with the distribution of the pore sizes should be considered as a summary of all signals of different areas according to Eq. (4) (Jehng et al. 1996):
| 4 |
On the base of the T2 data and models of water distribution in polymers and biopolymers, it is possible to analyze relaxation mechanisms (Krishman 1996; Szuminska et al. 2001; Halle 2004; Cosgrove et al. 2007; Belton 2011; Mandala et al. 2018; Foster et al. 2016; Bouazizi and Guillot 2019). When colloid suspensions and hydrated macromolecular complexes are studied to discover any changes in the hydrated state, T2 distribution might be used to monitor these changes (Rodin 1997; Belton 2011; Rodin 2017, 2018a). Takamiya et al. (2000) informs that the healing process of collagen structures of the tendon can be monitored noninvasively using T2 relaxation time of water protons. Many other questions including the function of the biomolecules, secondary structures, and folding biomacromolecules are depending on hydration water (Henkelman et al. 1994; Zhang et al. 2013; Nooeaid et al. 2012; Bouazizi and Guillot 2019; Hoffmann et al. 2019). Mostly, much slower dynamics of molecules has a place in the hydration layers (Blinc et al. 1995; Rodin 2004; Belton 2011; Bernini et al. 2011). NMR relaxation in combination with molecular dynamics simulations offers unique opportunities to test the internal dynamics of proteins on a time range of nanoseconds to picoseconds (Martini et al. 2013; Hoffmann et al. 2019; Bouazizi and Guillot 2019).
NMR methodologies in studying exchange and hydration of macromolecules
When an exchange occurs between different water environments (Menon et al. 1991; Blinc et al. 1995; Rodin 1997; Takamiya et al. 2000; Palmer 2014), the details can be clarified with the aid of the T2–T2 correlation measurement (Galvosas et al. 2007; Song et al. 2008; Callaghan 2011; Rodin 2018c). In the analysis of the T2–T2 data set, two-dimensional inverse Laplace transform is used to get the 2D T2 map. Figure 2 gives the examples of T2 distribution on 2D T2 maps for collagen fibers, Bombyx mori natural silk, and dentin B.
Fig. 2.

Plot of T2–T2 spectra obtained by 2D ILT treatment of the data set acquired in T2–store–T2 NMR experiments on the collagen fibers (left, main T2 peak on the diagonal is at 1 ms, and others are in the range of 10–200 ms), natural silk (in the center), and the dentin tissue (right, dentin B: two T2 peaks on the diagonal are in the range of 0.1–10 ms). T = 298 K, and the proton frequency is 20 MHz. The storage time = 20 ms (left), 2 s (center), and 200 ms (right)
Clarification of the exchange conditions in various tissue-engineered constructions gives hope on better clinical functionality of scaffolds (produced from collagen or silk materials) for biomedical engineering (Zeugolis et al. 2008; Rodin 2018a). During the growth of tissue, i.e., with morphogenesis, the chemical and physical properties are changing. The changes in macromolecular content and hydration of the tissue are reflected in measurable NMR parameters (Kotecha et al. 2013a, 2013b; Rodin 2018a). So, measuring these parameters can characterize tissue-engineered materials at different steps of preparation. It was reported that materials based on natural silk fibers and silk fibroin have excellent biocompatibility, and they are applied for differentiation of various cell types including mesenchymal stem cells (Seo et al. 2007; Liu et al. 2008; Soffer et al. 2008; Sell et al. 2010). At the same time, natural silks were quite successfully studied by NMR methods (van Beek et al. 1999; Rodin and Knight 2003a, 2003b; Rodin 2004; Rodin 2018c) highlighting different properties of water by spin–lattice and spin–spin relaxation, cross-relaxation, self-diffusion, NMR imaging, and DQF.
When NMR is applied in studying the size of proteins in solution, spin–spin relaxation can be a limiting factor (Wüthrich et al. 1996; Wider 1998; Foster et al. 2007; Mittermaier and Kay 2006; Rodin 2018b). In proteins, the nuclei of 15N, 1H, and 13C are the source of transverse relaxation with short T2. Dipolar coupling and chemical shift anisotropy (CSA) are modulated by rotation of molecules. This results in some difficulties in studying the large-size molecules. With an increase of molecular mass, the spectral widths become wider. The large molecules have big correlation times of rotation motion. In such cases, the broadened lines and bad resolution are observed. Transverse relaxation-optimized spectroscopy (TROSY) was introduced as a method of 2D NMR spectroscopy for an increase of sensitivity and spectral resolution at studying proteins (Wider 1998; Fernandez and Wider 2003). The peaks in HSQC spectra appear as multiplet with different components which have different widths. Normally, in the spectra of large proteins in high magnetic fields, a transverse relaxation effect prevails over the dipole–dipole relaxation mechanism and mechanism of CSA. The relaxation mechanisms are commonly bound to each other, and a contribution of each component into total relaxation rate can be positive or negative. TROSY allows a choice of components with mechanisms of relaxation which are distant from each other (Takeuchi et al. 2015). As a result, the signals in the spectra become narrow. Thus, TROSY experiment gives an opportunity to reduce the effect of transverse relaxation rates at studying large macromolecules in solutions (Wider 1998, 1999). For necessary balance between the CSA and dipole–dipole mechanism of relaxation, high magnetic fields should be applied (Takeuchi et al. 2015). A range of CSA changes with the strength of the magnetic field; however, the constants of dipole–dipole interactions are not depending on the magnetic field. TROSY experiment, in combination with various isotope-labeling techniques, gives a way to study macromolecules with molecular masses of up to 1 000 000 Da (Fernandez and Wider 2003; Xu and Matthew 2013).
A dipolar coupling of macromolecular protons with water protons can cause cross-relaxation (Bouazizi and Guillot 2019). This phenomenon affects measurement of R1 = 1/T1 in hydrated biopolymers (Wüthrich et al. 1996; Rodin et al. 2004c; Belton 2011; Rodin and Nikerov 2014; Rodin 2017). The effect of cross-relaxation is important in the analysis of NMR diffusion data from stimulated echo pulse sequence (Rodin and Nikerov 2014; Rodin 2017, 2018a, 2018b). The nuclear Overhauser effect (NOE) is following the cross-relaxation phenomenon (Keeler 2010). NOE is important in the assignment of resonances in NMR spectra and in confirmation of the structure of biomolecules (Wüthrich et al. 1996; Wider 1998; Rodin 2018b). When there are two populations of active nuclei, NOE presents the transfer of nuclear polarization between them by the action of cross-relaxation. NOE characterizes the change of integrated intensity of one resonance when the other one is saturated by RF field irradiation. This change can be positive or negative, and this is reflected by the sign of the cross-relaxation rate constant. In the first part of the transient NOE experiment, a 180° pulse is applied to one kind of spins inverting Z magnetization. Cross-relaxation happens during a time delay τ after the 180° pulse. Then, after this interval τ, a 90° pulse is applied. Thus, an irradiated spectrum is produced during this first experiment. Then, the next experiment applies a 90° pulse to result in a reference spectrum. NOE is observed as a difference between irradiated and reference spectra (Keeler 2010).
Relaxation dispersion NMR spectroscopy is applied as a powerful tool for studying water–macromolecule interactions in hydrated proteins (Neudecker et al. 2009). This allows a characterization of the mechanisms by which proteins fold into their native conformations as well as a prediction and design of protein structure. The study of folding pathways is complicated indeed. Protein misfolding may have a critical role in fibril formation that is important in neurodegenerative disorders. The protein intermediates have a low population and a short life. The behavior of 1H and 2H resonances in protein–water systems can be depending on protein–water exchange. The protons of proteins which relax very fast can be the sinks of relaxation for water protons which relax more slowly (Ishima and Torchia 2000; Cai et al. 2018; Huang and Melacini 2006). This occurs at fast hydrogen exchange (in comparison with the difference in relaxation rates of water protons and protein protons) (Kuntz and Kauzmann 1974; Denisov and Halle 1995; Halle 2004; Martini et al. 2013). The dependence of the spin–lattice relaxation rate on frequency characterizes magnetic relaxation dispersion (MRD) (Van-Quynh et al. 2003). A profile of MRD can result in quantitative information about protein hydration. For instance, the residence times of long-lived states of water molecules and their mean rotational correlation time at the surface of biomacromolecules can be estimated (Wüthrich et al. 1996; Otting 1997; Halle 2004; Martini et al. 2013). When the studies of dispersions use 2H NMR signals (Denisov and Halle 1995), it is also possible to separate the contributions to the longitudinal relaxation rate from labile protein deuterons and from deuterons of water. Foster et al. (2016) studied aqueous salt solutions of aggrecan at the field of 0.5 T and 9.4 T. At high field (9.4 T), the spin–spin relaxation rate 1/T2 was sensitive to the molecules of aggrecan in solution in much more extent than the longitudinal rate 1/T1. Spin–spin relaxation rate 1/T2 increased by over an order of magnitude at 9.4 T (Foster et al. 2016). The contributions to the relaxation rates (1/T1 and 1/T2) from protein protons and from water deuterons/protons could be separated as well when protein solutions are in the changing environmental conditions (Rodin et al. 1984; Rodin 2017, 2018b). Rodin et al. (1984) and Rodin (1997) measured T1 and T2 at the field of 0.38 T and 2.11 T in bovine serum albumin (BSA) water solutions and showed what is happening in protein solutions when inert gas xenon is introduced into the samples, i.e., when hydrate structures of xenon clathrates can be formed. Normally, two T1 components have been discovered in protein solutions with xenon clathrates (Rodin 1997). For the BSA concentration range of 0–10%, a fast T2 component was 0.5–2.0 ms whereas a slow one was in the range of 300 to 900 ms. In the presence of this inert gas in BSA solutions, the slow T2 component (which was responsible for the water protons) changed to 10–100 ms depending on the quantity of xenon clathrates (Rodin et al. 1984). When water molecules formed the rigid structures of clathrates, a protein concentration (relatively to the rest of the liquid phase) increased. As a result, the measured dependencies of spin–lattice relaxation rates 1/T1 vs protein content mirrored a transfer of water molecules into clathrate phase (Rodin et al. 1984, 2017; Rodin 1997).
Diffusion NMR
NMR diffusion studies result in one of the most important NMR parameters: a coefficient of self-diffusion. It is changing with growth of tissue and could be considered as a candidate for correlations in biomedical engineering (Pothirajan et al. 2014; Kotecha et al. 2013a, 2013b). Pulse-field-gradient (PFG) NMR diffusion experiments can be applied in one and two dimensions (Tanner and Stejskal 1968; Rodin and Knight 2003a, 2004; Callaghan and Furó 2004; Callaghan 2005; Callaghan 2011; Rodin 2018a; Callaghan and Lelievre 1986). The two-pulse (90° and 180°) spin-echo (SE) and the three-pulse (90°, 90°, and 90°) stimulated-echo (STE) sequences were commonly used to monitor amplitudes of echo after application of a pair of gradient pulses (Callaghan 2001; Rodin 2004; Callaghan 2011; Rodin et al. 2013; Blümich 2019). In studying heterogeneous systems, it is necessary to consider the role of internal magnetic field gradients because the difference in magnetic susceptibility of the sample can affect the measurements (Cotts et al. 1989; Rodin 2017, 2018c). The use of bipolar gradient pairs separated by additional 180° pulses can negate these effects or do these smaller (Cotts et al. 1989; Rodin et al. 2013). Therefore, it is very important to carry out NMR diffusion experiments applying different pulse sequences including bipolar gradient pairs also (Rodin et al. 2013; Rodin 2018c).
When 1D PFG NMR is applied in studying, for example, wood materials (Rodin et al. 2014; Rodin 2017, 2018a, 2018b), it can be used in one of the following orientations—longitudinal, transverse, or radial. Correct directions of X, Y, Z-gradients in relation to faces of the sample should be found before displacement of the sample in NMR tubes (Rodin 2018c). If the sample is studied in the kind of right cube with flat face, then search of corrected orientation of gradients can be found from imaging experiment on two narrow capillaries filled with Mn2+ (to shorten T2 relaxation time) water. For instance, at rotation of the sample with capillary tubes relatively magnetic field B0 (Z direction), two orthogonal directions of X- and Y-gradients might be found if to record the profile of the sample with these tubes at each rotation angle. Coalescence of two peaks into one peak occurs when rotation of the sample results in the direction of the Y-gradient in the plane of two capillary tubes (Fig. 3).
Fig. 3.
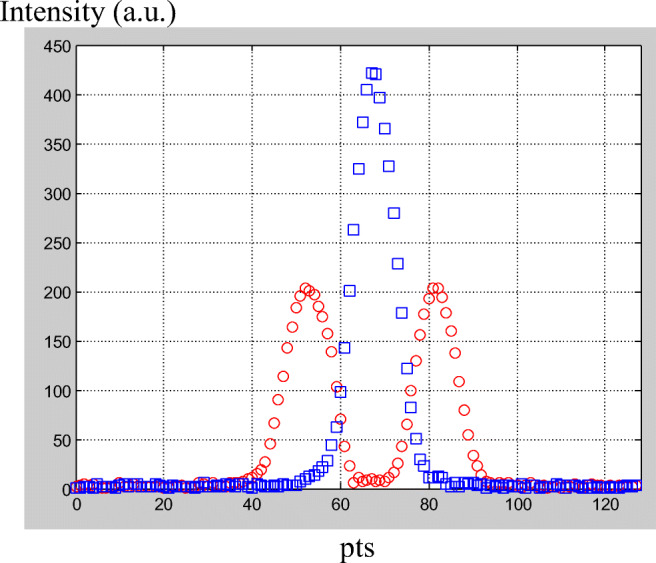
1D profile of two narrow capillary tubes with water (with additive of MnCl2 to shorten T2) in the imaging experiment at rotation of the sample around B0 (axis Z). Two peaks with maximal distance between them correspond to the case when the flat of capillaries is orthogonal to the Y gradient. The only one peak is observed in the case when the direction of the Y gradient is in the flat of two capillaries. T = 298 K, a proton resonance frequency is 400 MHz. X-axis scale is in points (pts)
When the gradient orientations are found, the main tasks in studying samples with anisotropic properties can be realized with SE and STE pulse sequences in the presence of two gradient pulses. The first gradient pulse is placed before and the second is after P180 (SE), or in the case of STE pulse sequence, these two gradients are placed before the second 90° and after third 90° RF pulses, respectively (Callaghan 2001; Rodin and Knight 2003a, 2003b; Callaghan 2011; Rodin et al. 2014; Rodin 2018b).
The techniques of PFG SE and PFG STE NMR (Rodin and Knight 2003b; Rodin 2004; Rodin and Cosgrove 2016; Callaghan 2005, 2011; Tanner and Stejskal 1968; Tanner 1979; Callaghan and Lelievre 1986) measure self-diffusion by labelling the nuclear spins by their Larmor precession frequencies in a spatially varying magnetic field achieved by applying a field gradient after first RF pulses in SE/STE sequences. Due to the diffusion attenuation, the NMR echo signal recorded in the presence of a pair of field gradient pulses of strength G, separation Δ, and duration δ is smaller than that in the sequences without the gradients. So, this echo intensity that excludes T2 attenuation during time gap between P90 and P180 RF pulses (τ1) in SE sequence or time gap between first P90 and second P90 RF pulses (τ1) in STE sequence is presented according to Eq. (5) (Tanner and Stejskal 1968; Callaghan 2001):
| 5 |
Equation (5) is working well for free diffusion and in the short gradient pulse limit, i.e., when δ < <∆. Then, the diffusion coefficient can be calculated from the slope of linear dependence Ln(I(G)/I(0)) vs G2. For SE pulse sequence, the intensity of echo without gradient I(0) is depending on T2 value as I(0) ~ exp(− 2τ1/T2). However, in the STE pulse sequence (when the gap between the second and third P90 RF pulses is τ2), this term I(0) is presented as depending on T1 and T2 according to the expression I(0) ~ exp(− 2τ1/T2).exp(− τ2/T1). The SE pulse sequence allows experiments at shorter ∆ than STE one (Callaghan 2001; Rodin et al. 2013, 2014). In comparison with the SE experiment, the STE pulse sequence is preferred when the diffusion time ∆ is long. The stimulated echo is considerably less sensitive to T2 relaxation effects (when τ1 is kept small). If to keep τ1 as shorter as possible (i.e., to diminish the range of the T2 relaxation effect) and to increase the effective diffusion time ∆ only by increasing τ2, then only the T1 relaxation range would affect the NMR diffusion experiment.
For restricted diffusion, a diffusion coefficient cannot be defined (Tanner and Stejskal 1968; Tanner 1979; Callaghan 2001). A typical example can be considered as follows: a sphere with radius r in which molecules are reflected by the walls. At very short diffusion times (short time-scale limit: ∆ < < r2/2D, where D is the diffusion coefficient for free diffusion), the molecules will not move for far distance to experience a substantial restriction in the motion. For the short diffusion times, the diffusion coefficient is comparable with free diffusivity (may be considered as the same as for free (nonrestricted) diffusion). When ∆ increases, the molecules will feel the presence of the walls and a smaller apparent diffusion coefficient will be obtained. In reciprocal space q = (2π)−1γδG, when wave vector q → 0, the radius of the sphere can be calculated from Eq. (6) (Callaghan 2001):
| 6 |
This is the long time-scale limit behavior (∆> > r2/2D) based on the Gaussian phase distribution approximation (Callaghan 2001).
2D diffusion–diffusion correlations
Two-dimensional diffusion–diffusion correlation study (2D D–D) NMR technique was successfully applied in studying timber pieces to detail the local order (Rodin et al. 2013, 2014; Rodin 2018a, 2018c), and this was based on PFG SE NMR in which a pair of magnetic field gradient pulses of duration δ and amplitude G was used to encode the positions of processing nuclear spins at two different times. The 2D method is based indeed on the application of two-gradient pulse pairs in two perpendicular directions, e.g., along X and Y. This diffusion–diffusion correlation experiment is described in detail in Callaghan (2005, 2011) and Rodin (2018b). The diffusive motions along orthogonal magnetic field gradient directions are correlated, and this leads to the details in the local diffusion asymmetry. In the two-dimensional PFG SE NMR experiment, spin echo attenuation is a function of independent variables q12 and q22 (the wave vectors q1 and q2 characterize two independently applied gradients G1 and G2, respectively). Therefore, the signal of spin echo is presented by Eq. (7) as a product of two exponential functions (Callaghan 2005, 2011; Rodin 2019):
| 7 |
In the D–D correlation experiment, the local diffusion anisotropy can be probed by changing the relative directions of q1 and q2. As a result, the total echo signal in the 2D D–D experiment could be considered in two-dimensional space, and this is obtained from linear superposition of q in both directions (Callaghan 2005; Callaghan et al. 2007). With a transformation giving by inverse Laplace (Callaghan 2001, 2005; Callaghan et al. 2007), it is possible to calculate the distribution of apparent diffusion tensor elements D1, D2 (Rodin 2017). The method of Venkataramanan (Venkataramanan et al. 2002; Hurlimann and Venkataramanan 2002) and Song (Song et al. 2002; Song 2012) has been used to produce effective 2D Laplace inversion obtained by nonconstrained least-square fit to the data. 2D fast Laplace inversion (2D FLI) is an algorithm to perform two-dimensional numerical inverse Laplace transformation developed at Schlumberger–Doll Research (Song 2012). The algorithm solves the double integral equation for signal of echo as a function of two variables (in the case of 2D D–D correlation experiment, the variables are q1 and q2) (Callaghan 2005, 2011; Callaghan et al. 2007).
Callaghan et al. (Callaghan and Furó 2004; Callaghan et al. 2007), Callaghan (2005, 2011), Galvosas et al. (2007), and Rodin (Rodin et al. 2017, Rodin 2018c) considered the 2D diffusion–diffusion correlation experiment on the base of the model which describes a local domain with diffusion tensor that has an axial symmetry, and it is characterized by two diffusivities D1 and D2 which are parallel and perpendicular to the local principal axis in molecular frame. In the first version of diffusion–diffusion correlation spectroscopy, two orthogonal pairs of gradients are applied. Figure 4 shows the examples of 2D diffusion–diffusion correlation maps for the experiment with two orthogonal pairs of gradients carried out on wood and 2D map on simulated experiment with the parameters from the 2D DDCOSY experiment on wood (Rodin et al. 2013, 2014).
Fig. 4.

2D diffusion–diffusion correlation spectra obtained in simulated two-dimensional experiment (for D2 = 10D1; D1 = 10−10 m2/s) with the two orthogonal pairs of the magnetic field gradient pulses (left) and 2D spectra obtained with 2D ILT of the data on wood in DDCOSY experiment with the two orthogonal pairs of the gradients (right). 20 × 20 data sets have been used to produce 2D spectra. Δ = 6 ms, the length of gradient pulse δ = 1 ms. T = 298 K, frequency is 400 MHz. An anisotropic diffusion tensor is revealed through the spot on the diagonal with off-diagonal wings
Another 2D D–D correlation diffusion experiment applied pulse sequence with two collinear pairs of gradients (Callaghan 2005; Rodin et al. 2014; Rodin 2018c). Both approaches are looking for anisotropy and local order in molecular frame xyz whereas the NMR diffusion experiment is carried out in laboratory frame XYZ. The approach needs to transfer the echo attenuation function (with D1 and D2 tensor elements in molecular frame) into the laboratory frame using consequent rotations. The summary of echo attenuations is doing over all possible orientations of local directors of molecular coordinate system xyz. The resulting expressions for signals in 2D space in laboratory frame for the cases of orthogonal and collinear gradients are presented in Callaghan (2005), Rodin et al. (2014), and Rodin (2018c). In diffusion–diffusion correlation experiments, two pairs of gradient pulses can be applied independently in different directions. Echo signals are formed at the use of both gradient pairs. Figure 5 shows the results of simulations for the case, when the pairs of gradient pulses are applied collinearly, i.e., in the same direction.
Fig. 5.

2D diffusion–diffusion correlation spectra obtained in simulated two-dimensional experiments with the collinear pairs of the magnetic field gradient pulses: top left: D1 = 10−10 m2/s, D2 = 10−9 m2/s; top right: D1 = D2 = 10−9 m2/s; bottom left: D1 = 10−11 m2/s, D2 = 10−10 m2/s; bottom right: D1 = D2 = 10−10 m2/s. Diffusion anisotropy is characterized by two stretched spots on the diagonal whereas isotropic diffusion (top and bottom right) is presented as one spot on the diagonal
For a description of the diffusion correlations, a scheme with a locally anisotropic domain for diffusion motion was introduced (Callaghan 2005). It is also assumed that domain has cylindrical symmetry. Random orientation of the domains is assumed. The scheme presented in Callaghan (2011) characterizes the molecular frame in three-dimensional space by a spherical coordinate system. Radius-vector, polar angle θ, and azimuth angle ψ characterize a point in such a system. Locally anisotropic diffusion is supposed to be in the molecular frame, and the water protons have the diffusion coefficient D1 in the direction of the radius-vector. The diffusion coefficient D2 is considered along the direction in the plane, which is orthogonal to the above selected director D1. In such a local geometry (Callaghan 2005; Rodin 2018c), the direction of the applied gradient is defined by the polar axis.
Multiple-quantum-filtered NMR
MQF NMR methods are effectively used in studying various tissues and materials with anisotropic motion of bound water (Rodin 2017; Eliav et al. 2012; Navon et al. 2001; Rodin 2004; Kotecha et al. 2013b), e.g., tendons, cartilage, the fibers of natural silk and collagen, and other tissue-engineered materials. The NMR signal is filtered with these techniques, and the contributions to the registered FID are observed only from anisotropic media and the ordered structures. The DQF method is a sensitive technique for depicting biological tissues with the residual dipolar interaction of macroscopic or local nature. The double-quantum coherences are a result of interaction with the fibers of collagen (Ikoma et al. 2001; Navon et al. 2001; Rodin et al. 2004c; Seo et al. 1999). A creation time dependence of the DQF signal (shape/function) and the value of creation time at maximal signal are important characteristics of tissue, which can inform about disease and recovery stage (Navon et al. 2001; Seo et al. 1999; Ikoma et al. 2001). DQF signals of residual water in normal collagen and regenerated tissues, as well as in scaffolds and tissue-engineered materials, can be different. An analysis of these differences results in understanding DQF data obtained in different tissues (Eliav et al. 2012; Navon et al. 2001; Seo et al. 1999). In Rodin et al. (2004c) and Rodin (2018a), DQF spectra have been registered in oriented collagen samples from the aponeurosis of cows with various ages. The findings discovered an anisotropy in molecular motion of residual water. The DQF signal was depending on the creation time (Rodin 2018c). Mostly, a three 90° pulse sequence is used in DQF studies (Rodin et al. 2004c; Navon et al. 2001; Eliav et al. 2012). An additional 180° pulse between the 1st and 2nd 90° RF pulses refocuses frequency shifts and magnetic field inhomogeneities. A work of this pulse sequence is described with the aid of irreducible spherical tensor operators Tl,p (here p is the coherence of the tensor whereas l is a rank of the tensor: ǀpǀ ≤ l) (Seo et al. 1999; Navon et al. 2001; Rodin 2018a). At the start of this pulse sequence, single quantum coherences (T1, +1, T1, −1) are generated by the 1st 90° RF pulse. Double rank spherical tensor operators (T2, +1, T2, −1) are created during the creation time (time interval between 1st and 2nd 90° RF pulses). The second 90° pulse transforms the second rank tensors into double-quantum coherence tensors (T2, +2, T2, −2) which are selected using cycling of the phase, ϕ (Navon et al. 2001; Bodenhausen et al. 1984). The third 90° pulse transforms the coherence back to T2, −1. Thus, it may be detected during acquisition as T1, −1. The detected DQF signal of water results from anisotropic molecular motion (Ikoma et al. 2001; Navon et al. 2001; Rodin and Knight 2004; Rodin 2018a, 2018b, 2018c).
Magnetic resonance studying water in polymers, natural biomaterials, and biotechnological dispersions
Internal dynamics in hydrated macromolecules and products
Internal dynamics of proteins defines protein functions, e.g., regulates protein recognition. A wide range of time scales (from subpicoseconds to seconds) should be considered for characterization of protein dynamics. NMR spin relaxation is used to produce data on slow and fast motions of the protein tumbling. The nature and functional role of these motions should be clarified to carry out NMR experiments exquisitely sensitive to these motions. Studying proteins in the presence of nanoparticles is a significant progress in understanding the details of this protein dynamics (Xie et al. 2019). This approach showed large-scale dynamics of loops that are involved in functionally critical protein–protein interactions and protein–calcium ion recognition. An additional approach with nanoparticle-based strategy was used in the work (Zhang et al. 2015) for accurate identification and complete characterization of all metabolites in biological products. These authors were able to differentiate between metabolites based on their electric charge. They used charged silica nanoparticles as an additive to the solution of analyzing material binding the metabolites of opposite charge. Then, their NMR signals were weakened or suppressed due to the peak broadening as a result of the slow rotational tumbling of the nanoparticles. This work demonstrated the sensitive NMR analysis to the detection of molecular charges for model mixtures and human urine facilitating an interpretation of one- and two-dimensional NMR spectra (Zhang et al. 2015). Other methodological NMR advancements (Mittermaier and Kay 2006) have resulted in the ability to characterize the mechanisms of protein dynamics and these molecules’ function. The authors illustrated an intimate relation between dynamics and molecular function considering the conformational transitions which are involved in biochemical processes.
There are different applications of nanoparticles in biotechnology: for instance, they are applied for drug delivery, gene transfection, and nanocrystals. Some examples on the studies of nanoparticles with application of NMR techniques can show how these methods are working (Rodin and Izmailova 1994, 1995, 1998; Dong 2010; Mandal and van der Wel 2016; Moniz et al. 2016; Rodin 2018b) being applied in biotechnology including liquid crystals, liposomes, and other products. With the aid of magnetic resonance methods, phase structure, molecular ordering, and dynamics of molecules in anisotropic phases could be studied (Rodin and Izmailova 1994, 1995; Rodin 1997, 2017). Wider (1998), Moniz et al. (2016), and Rodin and Izmailova (1994, 1995, 1998) studied the liposomes (lipid-based liquid crystals (Mandal and van der Wel 2016)) used for cosmetic and pharmaceutical application with the aid of 31P and 1H NMR methods (Zhdanov et al. 1994; Rodin 1997). Such engineered nanoparticles are used quite often for drug delivery. These approaches give information about an interaction of liposomes with the molecules of protectors (Rodin and Izmailova 1994). Zhdanov et al. (1994) and Rodin and Izmailova (1998) provide the details about how phosphoryl groups, metal cations, and surface groups of bilayer are involved in the interaction of the polyA:polyU duplex with liposomes.
A lipid bilayer in biological membranes of cells is presented in the highly dynamic liquid–crystalline state (Zhdanov et al. 1994; Mandal and van der Wel 2016). Dehydration and changing temperature are often applied to liposomes. In such cases, the membranes undergo transition to a more ordered state of gel (Mandal and van der Wel 2016; Moniz et al. 2016; Rodin and Izmailova 1994). A study of such transition in biological membranes is important for understanding of organisms which are tolerant to the freezing process. The methods of magnetic resonance are very informative in characterizing the phase transitions at variable temperatures. According to the published data (Mandal and van der Wel 2016), a lipid phase transition can be depressively affected in different conditions. This can result in the reduction in the lipids’ melting temperature. Mandal and van der Wel (2016) studied the phase transitions of different hydrated phospholipids, e.g., tetraoleoyl cardiolipin (TOCL) and several phosphatidylcholine lipids, showing how NMR discovers substantial reduction in the freezing point of the solvent phase. As a result, a confinement of the solvent in the small and densely packed samples resulted in the effect on the solvent phase. NMR tools can add significantly in studying the water phase of cell membranes unveiling the details of this phenomenon and developing the approaches for the creation of cryoprotectants (Rodin 1997; Rodin and Izmailova 1994, 1998; Rajan and Matsumura 2018).
The properties of colloid particles used in drug delivery can be changed with the aid of polymers, e.g., polyethylene glycol (PEG) (Irmukhametova et al. 2011; Rodin 2018b, 2018c). If to adsorb the polymer on the surface of nanoparticles, the properties of particles will be changed. Nanoparticles with PEG on the surface can lead to the formation of macroscopic aggregates or also other structures on macromolecular chains (Irmukhametova et al. 2011). For instance, organosilica nanoparticles are stable in dilute aqueous dispersions. However, they change their surface properties in other environmental conditions. Therefore, modification of the nanoparticles through PEGylation can result in the loss of their mucoadhesive characteristics (Irmukhametova et al. 2011). NMR relaxation and PFG NMR techniques were used in studying PEGylated nanoparticles (Rodin 2018a, 2018b). The properties of nanoparticle dispersions could be better understood with the findings on T2 distribution as different T2 peaks inform about the environments with different mobility. Knowledge about distribution of mobilities of molecules when environmental conditions change results in more clear applicability of these dispersions for drug delivery destination. In the case of thiolated sub-100-nm organosilica nanoparticles from 3-mercaptopropyltrimethoxysilane (MPTS) (Irmukhametova et al. 2011) dispersed in D2O, T2 distribution discovered 4 peaks (Rodin 2018a). The peak with T2 ~ 2 s was associated with the protons of HDO groups (bulk water). The population of this component was about ~ 86% of all measurable proton signal in MPTS nanoparticles. Other three proton environments were characterized by T2 peaks at 1 ms, 15 ms, and 100–110 ms. When MPTS nanoparticles were modified by PEG 5000, a population of water component decreased to ~ 65%. At the same time, in PEGylated nanoparticles, the value of spin–spin relaxation time T2 ~ 100 ms (MPTS) changed to 200 ms showing increased population (23%) in comparison with that (4%) in dispersion of MPTS nanoparticles. PEG macromolecules form additional H bonds with water. For this proton environment in the dispersion of MPTS nanoparticles, correlation times were ~ 10−8 s whereas in PEGylated nanoparticles, for this T2 component, the correlation time has been calculated as 1 × 10⁻⁹ s. Rodin (2018a) presented the data of the NMR diffusion study in dispersions of PEGylated nanoparticles for the PEG 5000. For these nanoparticles, normalized echo intensities were depending on gradient factor b = (γGδ)2(Δ − δ/3) and diffusion time. Echo attenuation curve could be fitted by two exponentials. The first part of the curves did not depend on diffusion time. The apparent diffusion coefficient (1.8–2.05) × 10−9 m2/s could be calculated for HDO molecules using the data at gradient factor b less than 7 × 10⁸ rad2 s/m2. At larger b values, the echo curves depended on the diffusion time and characterized the protons of nanoparticles (Rodin 2018a). According to Irmukhametova et al. (2011), there are numerous thiol groups on the surface of MPTS nanoparticles. The scheme of this work showed the possible location of exchangeable protons inside the particles.
MQF NMR in studying anisotropic mobility
DQF NMR spectroscopy clarifies the inner anisotropic mobility of protons in these MPTS nanoparticles because any mobile water protons are filtered. Thus, this technique demonstrates that filtering the 1H NMR signal enables the observation of the contributions into the free induction decay that originate exclusively from anisotropic media. Figure 6 presents the DQF spectra measured in the dispersion of MPTS nanoparticles testifying that part of the molecules is characterized by anisotropic mobility.
Fig. 6.
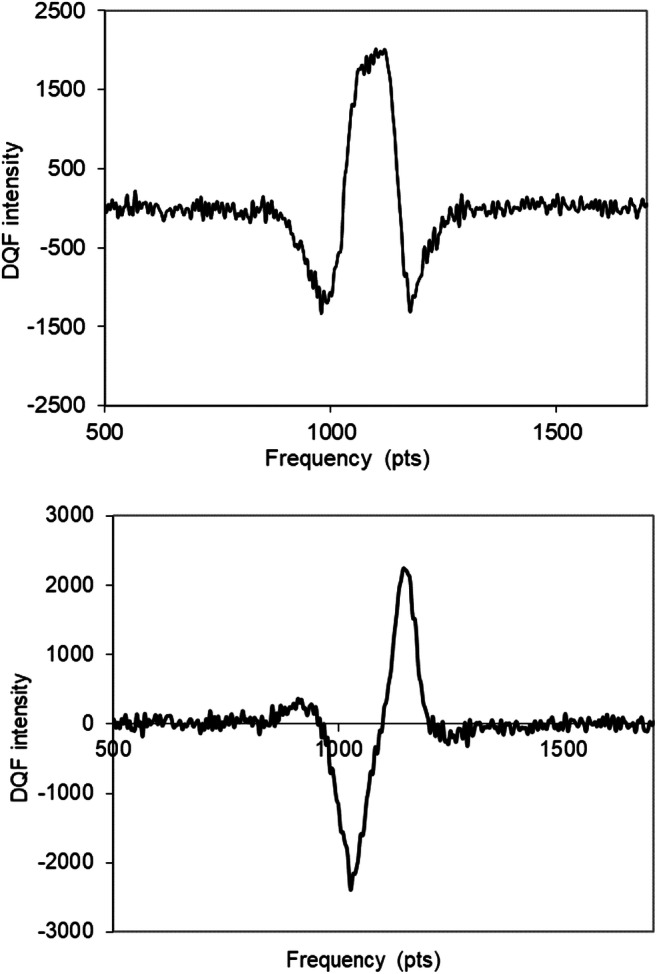
1H DQF NMR spectra (“in phase” (top) and “out of phase” (bottom) modes) in dispersions of MPTS nanoparticles in HDO at creation time of 55 μs. T = 298 K, and resonance frequency for protons is 400 MHz. Frequency scale units: 200 pts = 10 kHz
DQF NMR signal on different dispersions, biomaterials, and tissues depend on the creation time and results in specific characteristics of tissue. Figure 7 shows DQF spectra at 2 various creation times (0.07 and 0.16 ms) for oriented (along magnetic field B0) collagen fibers (Rodin 2018c). There was no signal of free water with isotropic motion in the spectra at any measured creation time (Rodin 2017; Rodin et al. 2004c). This indicated the efficiency of the DQF sequence to study anisotropic motion in collagen tissues (Rodin 2018c). The DQF spectra could be simulated, and one example of calculated DQF spectra is introduced in the bottom of Fig. 7 with variation in creation time. A model describing the dipolar interactions between the protons of water molecules has been considered to calculate 1H DQF spectra using the codes developed in MATLAB and Mathcad software (Rodin 2018c).
Fig. 7.

Top part: experimental 1H DQF NMR spectra (“in phase” and “out of phase” modes) of C15m collagen fibers (oriented along the static magnetic field B0) with creation times of 0.07 ms (left) and 0.16 ms (right). The signal intensity increased towards the spectrum of τcreat = 0.16 ms (Rodin et al. 2004c). The signal decreased again at τcreat towards 0.3 ms. T = 298 K, and resonance frequency for protons is 400 MHz. Experimentally obtained FIDs were transformed into frequency domain. Frequency scale units: 50 pts = 6 kHz. Each graph for the experimental DQF spectra shows “in phase” (top) and “out of phase” (bottom) modes. Bottom part: simulated DQF spectra for creation times from 0.01 ms to 0.1 ms. Frequency scale units: 0.04 pts = 10 kHz
The dependences of the intensities of the DQF signal on the creation time for the oriented collagen fibers (along the magnetic field B0) and for randomly oriented ones were different (Rodin 2018a). The findings obtained for all collagen samples could be fitted by the difference of two exponential functions resulting in two relaxation constants which were different for oriented and nonoriented fibers (Rodin 2018a, 2018c).
According to the DQF studies of tendon (Eliav et al. 2012; Ikoma et al. 2001; Navon et al. 2001; Seo et al. 1999), the shape of the line and the amplitude of the 1H DQF spectra are affected by the ratio of the residual proton–proton dipolar interactions and the proton–exchange rate. Thus, the intensity of the DQF signal declines when the proton-exchange rate increases. In studying tendon (Eliav et al. 2012; Navon et al. 2001), it was shown that the RDI is temperature independent. When the temperature was changing from 297 to 274.5 K, the proton - exchange rate changed by more than a factor of 3 (Navon et al. 2001). When DQF spectroscopy has been used in studying collagen fibers of different age (Rodin et al. 2004c; Rodin 2017), the changes in temperature were by 65°. Therefore, at decreasing temperature, the effect of the proton-exchange rate will be small. As a result, there will be increased DQF signal intensity, and the dependence of the DQF signal on creation time will be changed (Rodin et al. 2004c; Rodin 2018c). Figure 8 presents the DQF signal intensities vs creation time at 298 and 233 K. The data obtained for different collagen fibers C15m and C8y (Rodin 2017; Rodin et al. 2004c) showed, that at low temperature (233 K), the DQF signals reached the maximum intensities at creation times (τcreat)max = 0.10 and 0.07 ms for C15m and C8y collagens, respectively.
Fig. 8.
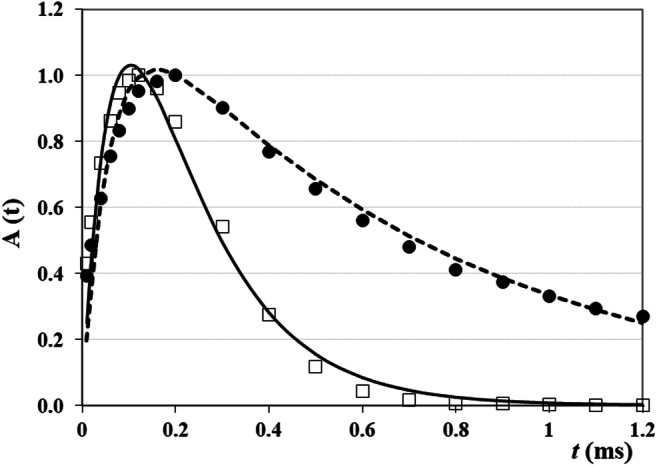
Dependence of normalized DQF signals on creation time for C15m collagen fibers (water content is 0.6 g H2O per gram of dry mass) at 298 K (black circles) and at 233 K (open squares) (Rodin et al. 2004c). Solid and dashed lines are the fits of the experimental data to the difference of two exponential functions (Rodin 2018c). In the case of 298 K, relaxation constants were r1 = 19.92 ms−1 and r2 = 1.08 ms−1 whereas for 233 K, r1 = 14.17 ms−1 and r2 = 6.18 ms−1
These DQF studies discovered that, for instance, for C15m collagen, the DQF intensity at (τcreat)max was 1.27 times bigger at 233 K than that at 298 K (Rodin et al. 2004c; Rodin 2017). In the case of C8y collagen, a comparison of the maximal DQF signal measured at 233 K with that measured at 298 K showed that the DQF signal at (τcreat)max in 1.65 times exceeded that at 298 K. 1H–1H dipolar interaction in collagen fibers depended on the orientation of the sample in the magnetic field and on the interaction of water molecules with the collagen fibers, i.e., on the structure order of water molecules (Seo et al. 1999; Rodin et al. 2004b; Rodin and Knight 2004; Tsoref et al. 1998; Migchelsen and Berendsen 1973; Grigera and Berendsen 1979; Rodin 2013). The study of the DQF intensity in the nonoriented collagen fibers in the same experimental conditions as in oriented C8y and C15m collagen samples (orientation was along the direction of magnetic field B0, i.e., along the longitudinal axis of the NMR tube (Rodin et al. 2004c; Rodin 2017)) showed that for the samples with mesh-like structure, a much smaller contribution into DQF intensity has been measured. In addition to this, the line width for nonoriented samples was wider than in oriented fibers. For instance, in the case of C8y collagen, the 1H DQF NMR spectra showed that the line width of the positive peak in nonoriented fibers was 1640–1820 Hz, i.e., the line width became larger than that in oriented fibers (900–1000 Hz) (Rodin 2017). In the case of C15m collagen, the DQF signal at (τcreat)max was circa 4 times bigger than that in nonoriented collagen. For the C8y-oriented collagen fibers (Rodin et al. 2004c, 2013), the DQF signal exceeded that in nonoriented fibers 4.8 times.
The changes in the structure and properties of collagen at the molecular and fibrillar levels have been investigated at the treatment of the samples of this biopolymer by various ionic liquids (ILs) (Tarannum et al. 2018). The study demonstrated cross-linking of collagen and the water mobility changes as an effect of ILs. The data of the work discovered that the changes in the secondary structure of collagen are associated with the changes in the hydration dynamics of protein when ILs interacted with macromolecules. Thus, this NMR work showed how collagen–ILs interactions unfold the potential ability of ionic liquids to stabilize or destabilize these biomacromolecules in terms of protein structure and dynamics.
When NMR relaxation methods are used to highlight separated water compartments in hydrated biosystems (Tanner 1979; Menon et al. 1991; Henkelman et al. 1994; Rodin 1997; Martini et al. 2013), some features should be emphasized. Sometimes, there is a choice of one or two components at multiexponential fitting the data. The work of Shinar and Navon (2006) can be analyzed as an example describing the different contributions to T2 relaxation in the articulate cartilage. If to ignore the two exponentials in relaxation decay, serious errors can be produced in an estimation of the proton density. Shinar and Navon (2006) considered also an approach for a slowing of the T2 relaxation and for a minimization of its angular dependence. With the aid of the 2H DQF MRI method, a correct measurement of the collagen density and an orientation of fibers in cartilage could be done (Shinar and Navon 2006). The cartilage attached to the bone stabilizes the matrix of collagen. The fibers of collagen in the cartilage have different thicknesses. The thickest fibers are located near the bone. Towards the surface, the thickness of fibers is decreased (Shinar and Navon 2006). The techniques of DQF NMR (with measurements on 1H and 2H) give an opportunity to clarify the details of the changes in the properties of cartilage in the case of some diseases. For example, in osteoarthritis, the erosion of an articular cartilage has a place (Soffer et al. 2008). Therefore, a disruption of major constituents of cartilage (collagen and proteoglycans) can be studied by 1H/2H DQF NMR spectroscopy.
When ions or water molecules interact with ordered tissues, this results in the motion of ions and molecules to be anisotropic. Then, the dipolar and quadrupolar interactions do not average towards zero. These interactions can be discovered with an application of MQF NMR on the nuclei of 1H, 2H, and 23Na. In accordance with the level of the residual interactions, MQF is sensitive to macromolecules, compartments, and fiber orientations. Thus, MQF filters out the signals of ions and molecules which do not interact with the ordered systems and produces the spectra only in anisotropic-oriented structures. These techniques obtain valuable data about residual proton dipolar coupling which indicate the order or alignment of molecules. Kotecha et al. (2013b) applied these NMR methods in studying chondrocyte pellets discovering that splitting (as a characteristic of dipolar coupling (Eliav et al. 2012; Ikoma et al. 2001; Navon et al. 2001; Seo et al. 1999; Migchelsen and Berendsen 1973)) is lower in chondrocyte pellets and chondrocytes seeded in alginate beads in comparison with that in native cartilage. So, DQF data on lower dipolar coupling in chondrocyte pellets testify about not preferred direction of the collagen molecules in tissue-engineered product. Thus, mostly random spatial distribution of macromolecules characterizes this tissue (Kotecha et al. 2013b). 23Na triple-quantum filter (TQF) and 23Na relaxation have been applied in studying dynamics of tissue growth in various cartilage tissue-engineered products (Kotecha et al. 2013a). It was shown that 23Na relaxation rates and 23Na TQF signals were dependent on the high cell density and macromolecular content. An anisotropy in the cartilage of tissue-engineered constructs also affected these 23Na NMR parameters (Kotecha et al. 2013a). Thus, this work confirmed that in the native tissues, average quadrupolar coupling always exceeds these values in the engineered tissue. Therefore, collagen macromolecules accumulated in the engineered tissue had no such an order as it was in native tissue (Kotecha et al. 2013a). These data show that TQF NMR spectroscopy is a reliable tool to investigate anisotropy and dynamics in cartilage tissue engineered constructs.
MQF NMR is applied for the identification of various compartments (Eliav et al. 2012) (e.g., it could be the extracellular matrix and myelin in nerves and brain), for observation of the changes of the collagen fibers in cartilage during maturation and changes of cartilage obtained from osteoarthritic and osteoporotic patients, and the monitoring of healing of injured tendons (Seo et al. 1999; Eliav and Navon 2016). MQF is able also to measure the changes in the intracellular sodium pool in ischemic hearts. For example, Eykyn et al. (2015) investigated the potential of the MQF 23Na NMR to probe intracellular [Na]i in the Langendorff perfused mouse heart. The authors considered the different cellular origins of the 23Na MQF signals and proposed that the TQF/DQF ratio can be applied as a semi-quantitative measure of [Na]i in the mouse heart. They demonstrated a good correlation of this ratio with [Na]i measured at elevated sodium concentration and in the case with shift reagent. However, some questions still exist because MQF signals could be observed even in saline solutions in the absence of biological tissues (Eliav and Navon 2016). The formation of the 2nd rank tensor prevails over the 3rd rank one. This does mean that in the presence of paramagnetic shift reagents, MQF signals may not provide reliable information about the ratio of MQF signals between the intra- and extracellular compartments (Eliav and Navon 2016).
Identification of compartments in hydrated biomaterials
Collagen is also playing a role in bone formation (Rodin 2017; Rodin 2018a). Due to excellent biocompatibility, collagen is the most used material to create scaffolds (Rodin 2018c; Nooeaid et al. 2012; Zeugolis et al. 2008; Sell et al. 2010). A level of cross-links in collagen nano-scaffolds effects on water–biomolecule interactions in tissue-engineered materials (Rodin 2017, 2018b; Sell et al. 2010). NMR diffusion approaches can detail the hydration properties of collagens with different level of cross-links and water–polymer interactions in scaffolds (Rodin et al. 2004c; Rodin and Nikerov 2014; Rodin 2017). When diffusion of water molecules in hydrated collagen fibers with different cross-links can be studied and described in terms of diffusivity constants, this should lead to the understanding of porous media structure. Some examples of how to characterize porous media of fibrillar materials by diffusion constants obtained in applications of gradient pulses along the direction of static magnetic field B0 and in perpendicular orientation relatively to B0 have been presented in Rodin and Knight (2003b), Rodin and Nikerov (2014), and Rodin et al. (2017). They studied collagen fibers oriented along the static magnetic field B0. Apparent diffusion coefficient Dapp was dependent on effective diffusion time for both directions of gradients testifying a restricted water diffusion. In such or similar cases, a model of equally spaced plane parallel permeable barriers has been considered (Tanner 1979). This resulted in the estimation of a permeability p and a restriction size a using the connection of asymptotic diffusion coefficient Dasym at long diffusion time with a, p and free diffusion coefficient D0 in the expression Dasym/D0 = ap/(ap + D0) (Rodin and Nikerov 2014; Rodin 2017; Rodin and Knight 2003a, 2003b; Tanner and Stejskal 1968; Callaghan 2001). Those studies showed how an anisotropy of water self-diffusion could be clarified in collagen tissues with varying of the cross-link level. Dapp = f(Δ) dependences (Rodin and Nikerov 2014) could be analyzed in accordance with publications studying self-diffusion (Tanner 1979; Callaghan 2001; Rodin and Knight 2003b).
In the scaffolds from natural polymers (collagen, silk), as well as in growing tissue, p and a can be monitored as important parameters obtaining from NMR data. In Pothirajan et al. (2014) and Kotecha et al. (2013a, 2013b), Dapp has been measured; however, no additional information has been provided for the tissue under study: anisotropy, estimate of restriction size, or tissue permeability. So, the tissue-engineered materials could be supplied by this valuable information as well. Rodin (2018b, 2018c) included the application of two-dimensional Laplace inversion on the 2D data set obtained in DDCOSY NMR experiments with hydrated collagen fibers. A 2D diffusion map, as a representation of 2D DDCOSY NMR data, discovered the two peaks on the diagonal (Rodin and Nikerov 2014). So, these 2D NMR spectra were in line with 2D ILT simulations (Rodin 2017, 2019) which showed a correlation of two diffusion constants D1 and D2 (characterizing self-diffusion in two perpendicular directions in the molecular frame) and resulted in two spots on the diagonal (Fig. 5). The two registered peaks on the diagonal in the 2D map reflect an anisotropy in water self-diffusion in collagen samples. Thus, 2D DDCOSY experiments can discover an anisotropy of water self-diffusion in tissue-engineered materials. The approaches presented can be suitable to monitor any changes in diffusivities of water in collagen tissues at diseases or in recovery stage. The changes in diffusivity can involve macromolecular reorganization and associated changes in cross-relaxation rates and level of anisotropy (Rodin 2018a, 2018c, 2019). In order to apply the 2D Laplace inversion algorithm properly and to predict potentially changes in 2D DDCOSY NMR spectra for water in normal and regenerated tendons/tissue-engineered materials, simulations for isotropic and anisotropic states should be made (Fig. 5) (Rodin 2017, 2018c, 2019).
Earlier published works on anisotropy in natural materials, e.g., in wood (Rodin 2014, 2017, 2018b), have presented 2D DDCOSY spectra for the data obtained with the pairs of gradients oriented perpendicularly to each other, showing the pattern with two long wings outside the diagonal and one spot on the diagonal (Fig. 4). The diffusion tensor with an axial symmetry has been applied to analyze the D1 and D2 diffusivities in parallel and perpendicular directions to the local principal axis in the molecular frame (Callaghan 2005, 2011; Rodin et al. 2013). As it was considered in simulation studies (Fig. 5), the correlation pulse sequence with two collinear pairs of gradients presented an additional alternative 2D method to study diffusion anisotropy by the diagonal spots in 2D maps. Any changes in the diagonal spots depending on experimental moisture of the samples could be monitored highlighting the restriction of the method for studying very wet and dry samples (Rodin 2019). Both these 2D DDCOSY approaches (with orthogonal and collinear gradients) applied on wood samples were looking for local order and an anisotropy in the molecular frame during the real experiment in the laboratory frame. These 2D NMR diffusion–diffusion correlations discovering a local anisotropy can result in new impact in the studies of hydrated polymers (Callaghan 2001, 2005; Callaghan and Furó 2004; Callaghan et al. 2007; Galvosas et al. 2007; Rodin and Cosgrove 2016; Rodin 2019). For instance, it can discover a distribution of hydration sites in a space as anisotropic and asymmetric.
At the different stages of preparation of the product (sedimentation, separation, drying, preservation, etc.) or at application of pharmaceuticals in blood or biofluids, it is necessary to know the water permeability of membranes in different conditions (Rodin 1997; Rodin 2018c). Many applications of medicines are depending on how water and small solutes cross the biological membranes. In human red blood cells (RBC), the osmotic water permeability is normally larger than diffusional water permeability (Brahm 2013). The water diffusional permeability of the RBC membrane is quite high. It can be studied adding the paramagnetic ion Mn2+ in the blood plasma or measuring self-diffusion of H2O (Andrasko 1976). Some studies show how NMR techniques could be applied in estimating the changes of cell permeability at environmental factors (Cooper et al. 1974; Andrasko 1976; Rodin et al. 1986). In original suspension, an exchange between intra- and extracellular water is too fast on the NMR scale, and this results in one measured T2 component. In order to register the protons of intra- and extracellular water separately, i.e., to generate two exponential behavior of magnetization in cell suspension, it is necessary to reduce one of the relaxation times to less than the exchange time (circa 10 ms (Rodin et al. 2017)). When paramagnetic ions, e.g., Mn2+ (i.e., solution MnCl2), are introduced in the extracellular media (Andrasko 1976; Rodin 1997), the relaxation times of water protons outside the cells become shorter. In such a case, it was possible to registrate two separate NMR signals of water protons in suspensions of cells, i.e., two exponential decay of transverse magnetization in the population of cells with nondamaged cellular membrane (Rodin 1997; Rodin et al. 1986). This NMR method (paramagnetic doping) has been applied successfully in studying the water diffusion permeability of RBC and microbiological suspensions (Rodin 1997). The approaches with paramagnetic probes were used also in studying the structure and dynamics of large biomolecules and complexes helping to avoid severe broadening of NMR signals (Hocking et al. 2014). This ref. informs how paramagnetic relaxation enhancements (PREs) obtained from inert and soluble paramagnetic probes (solvent PREs) present detailed quantitative information about solvent accessibility of magnetically active nuclei. Bernini et al. (2012) shows how the Gd(III) paramagnetic probe was used to investigate the surface accessibility of biomolecules. In another study (Huang et al. 2013), site-specific labelling of proteins with lanthanide ions gives an opportunity to use the properties of these ions in investigating the structure and dynamics of proteins in solution.
In many cases, the hydration shell of the biopolymers is depending on the macromolecular state, i.e., water arrangement in the nearest layers to the protein surface follows the shape of the biomacromolecule. Nevertheless, there are areas which differently participate in a hydration phenomenon, for instance, the regions which are tightly clustered and can alternate other sites with almost absence of water (Rodin 1997, 2018a, 2018b). A development of additional approaches using external physical factors to affect hydrated biopolymers and cell suspensions and stimulate a change of the water structure near the macromolecule can result in new insight in the hydration structure and performance of biological functions (Rodin et al. 1984; Rodin 1997; Baldwin and Kay 2009; Rodin et al. 2017; Ponomarev et al. 2018). In complex systems, a relationship between the hydrated water and the protein surface is under permanent attention in the various studies (Kuntz and Kauzmann 1974; Foster et al. 2007; Rodin 2018a). Understanding the details of biopolymer participation in hydrated complex systems results in further development of the approaches for preservation and functionality of these systems (Galvosas et al. 2007; Baldwin and Kay 2009; Ponomarev et al. 2018; Rajan and Matsumura 2018). Therefore, the NMR methods considered above could be forwarded to the next stage for a deeper study of water intermolecular interactions in biotechnological dispersions and preparations.
Conclusions
Different NMR methods have been considered as the sensitive techniques for characterization of the changes in hydrated biopolymers, macromolecular complexes, and dispersions. These tools can provide the parameters related to changes in the cell/tissue microstructure and environment. The NMR methods have the advantage that the physicochemical properties of the cells and tissues can be studied on intact samples giving information on the conditions of growth and restoring/storage. The review showed the details and advantages of these NMR approaches in the analysis of biotechnological products and biomaterials. These advantages can be considered as new opportunities in studying samples for biomedical engineering.
Thus, specialists in cell/tissue engineering and biotechnology can realize all advantages of these offered MR techniques establishing reliable links with specialists in the techniques of magnetic resonance. Such a collaboration can lead further to development of new useful tools in studying biomaterials and formulations. An estimation of the formulation quality is associated with a development and an application of NMR techniques for the study of molecular interactions in changing water phase, i.e., in the state from solution to gel form or even to dried preparations with a small amount of residual water.
It has been shown how the methods of NMR relaxation, 1D and 2D NMR diffusion, and MQF NMR can be applied correctly to investigate the water phase in the porous structures. The findings and discussion presented new details in the application of NMR methods for characterization of hydrated biomacromolecules. The work clarified how NMR parameters (splitting, apparent diffusion coefficients, and NMR relaxation times) could help in studying water–biopolymer interaction in biotechnological preparations. In the state of low water content, the materials can show anisotropic properties. A restricted diffusion and anisotropy of water self-diffusion could be studied by one- and two-dimensional PFG NMR. This results in information about the microstructure of natural materials and the changes in biotechnological formulations. The findings of 1D PFG NMR showed that the main role in the decreasing apparent diffusion coefficient with diffusion time can be attributed to the restricted diffusion of water. An estimation of the barrier space and the barrier permeability coefficient could be evaluated. The diffusion constants measured in weakly hydrated natural materials were significantly lower than those in aqueous solutions. These results complement and extend the information on the properties of water in natural biomaterials. 2D diffusion–diffusion correlation maps as the results of DDCOSY experiments can discover an anisotropy of water self-diffusion in tissue-engineered materials. The approaches presented can be suitable to study the changes in diffusivities of water at different stages of tissue-engineered monitoring (from start to final construct or at any stage of repair/recovery). The results can involve changes in hydrated sites, cross-relaxation and anisotropy, and reorganization of macromolecules.
Compliance with ethical standards
Conflict of interest
The author declares that he has no conflict of interest.
Footnotes
Publisher’s note
Springer Nature remains neutral with regard to jurisdictional claims in published maps and institutional affiliations.
References
- Andrasko J. Water diffusion permeability of human erythrocytes studied by a pulsed gradient NMR technique. Biochim et Biophys Acta. 1976;428:304–311. doi: 10.1016/0304-4165(76)90038-6. [DOI] [PubMed] [Google Scholar]
- Baldwin AJ, Kay LE. NMR spectroscopy brings invisible protein states into focus. Nat Chem Biol. 2009;5(11):808–814. doi: 10.1038/nchembio.238. [DOI] [PubMed] [Google Scholar]
- Belton P. NMR studies of hydration in low water content biopolymer systems. Magn Reson Chem. 2011;49:S127–S132. doi: 10.1002/mrc.2848. [DOI] [PubMed] [Google Scholar]
- Bernini A, Spiga O, Consonni R, et al. Hydration studies on the archaeal protein Sso7d using NMR measurements and MD simulations. BMC Struct Biol. 2011;11:44. doi: 10.1186/1472-6807-11-44. [DOI] [PMC free article] [PubMed] [Google Scholar]
- Bernini A, Spiga O, Venditti V, et al. The use of a ditopic Gd (III) paramagnetic probe for investigating α-bungarotoxin surface accessibility. J Inorganic Biochem. 2012;112:25–31. doi: 10.1016/j.jinorgbio.2012.03.004. [DOI] [PubMed] [Google Scholar]
- Blinc R, Rutar V, Zupanĉiĉ I et al (1995) Proton NMR relaxation of adsorbed water in gelatin and collagen. Appl Magn Reson 9:193–216
- Blümich B (2019) Essential NMR (for scientists and engineers), 2nd edn. Springer,165 p ISBN: 978-3-030-10704-8. 10.1007/978-3-030-10704-8
- Bodenhausen G, Logler H, Ernst RR. Selection of coherence transfer pathways in NMR pulse experiments. J Magn Reson. 1984;58:370–388. doi: 10.1016/j.jmr.2011.08.033. [DOI] [PubMed] [Google Scholar]
- Bouazizi K, Guillot G. Cross-relaxation parameters in cortical bone assessed with different MR sequences (2019) NMR Biomed. 2019;32(7):e4098. doi: 10.1002/nbm.4098. [DOI] [PubMed] [Google Scholar]
- Brahm J. The permeability of red blood cells to chloride, urea, and water. J Exper Biol. 2013;216:2238–2246. doi: 10.1242/jeb.077941. [DOI] [PubMed] [Google Scholar]
- Cai T, Benjamini D, Komlosh M, et al. Rapid detection of the presence of diffusion exchange. J Mag Reson. 2018;297:17–22. doi: 10.1016/j.jmr.2018.10.004. [DOI] [PMC free article] [PubMed] [Google Scholar]
- Callaghan PT, Lelievre J. The influence of polymer size and shape on the self-diffusion of polysaccharides and solvents. Anal Chim Acta. 1986;189:145–166. [Google Scholar]
- Callaghan PT. Principles of nuclear magnetic resonance microscopy. Oxford: Clarendon Press; 2001. [Google Scholar]
- Callaghan PT, Furó I. Diffusion-diffusion correlation and exchange as a signature for local order and dynamics. J Chem Phys. 2004;120:4032–4038. doi: 10.1063/1.1642604. [DOI] [PubMed] [Google Scholar]
- Callaghan PT. How two pairs of gradient pulses give access to new information about molecular dynamics. Diffus Fundam. 2005;2:64.1–64.18. [Google Scholar]
- Callaghan PT, Arns CH, Galvosas P, et al. Recent Fourier and Laplace perspectives for multidimensional NMR in porous media. Magn Reson Imaging. 2007;25:441–444. doi: 10.1016/j.mri.2007.01.114. [DOI] [PubMed] [Google Scholar]
- Callaghan PT. Translational dynamics and magnetic resonance. Oxford: Oxford University Press; 2011. [Google Scholar]
- Cooper RL, Chang DB, Young AC, et al. Restricted diffusion in biological systems. Biophys J. 1974;14:161–177. doi: 10.1016/s0006-3495(74)85904-7. [DOI] [PMC free article] [PubMed] [Google Scholar]
- Cosgrove T, Rodin VV, Murray M et al (2007) Self-diffusion in solutions of carboxylated acrylic polymers as studied by pulsed field gradient NMR. 1. Solvent diffusion studies. J Polym Res 14(3):167–174 10.1007/s10965-006-9088-0
- Cotts RM, Hoch MJR, Sun T, Markert JT. Pulsed field gradient stimulated echo method for improved NMR diffusion measurements in heterogeneous system. J Magn Reson. 1989;83(2):252–266. [Google Scholar]
- Denisov PV, Halle B. Hydrogen exchange and protein hydration: the deuteron spin relaxation dispersions of bovine pancreatic trypsin inhibitor and ubiquitin. J Mol Biol. 1995;245:698–709. doi: 10.1006/jmbi.1994.0056. [DOI] [PubMed] [Google Scholar]
- Dong RY (ed) (2010) Nuclear magnetic resonance spectroscopy of liquid crystals. World Scientific Publishing Co. Pte. Ltd, 464 p. ISBN: 978-981-4273-66-4
- D’Orazio F, Bhattacharja S, Halperin WP, et al. Molecular diffusion and nuclear-magnetic-resonance relaxation of water in unsaturated porous silica glass. Phys Rev B Condens Matter. 1990;42(16):9810–9818. doi: 10.1103/physrevb.42.9810. [DOI] [PubMed] [Google Scholar]
- Eliav U, Comlosh M, Basser PJ, Navon G. Characterization and mapping of dipolar interactions within macromolecules in tissues using a combination of DQF, MT and UTE MRI. NMR Biomed. 2012;25(10):1152–1159. doi: 10.1002/nbm.2784. [DOI] [PMC free article] [PubMed] [Google Scholar]
- Eliav U, Navon G (2016) Multiple quantum MRS. eMagRes 5(1). 10.1002/9780470034590.emrstm1448
- Eykyn TR, Aksentijevic D, Aughton KL, et al. Multiple quantum filtered 23Na NMR in the Langendorff perfused mouse heart: ratio of triple/double quantum filtered signals correlates with [Na]i. J Mol Cell Cardiol. 2015;86:95–101. doi: 10.1016/j.yjmcc.2015.07.009. [DOI] [PMC free article] [PubMed] [Google Scholar]
- Fernandez C, Wider G. TROSY in NMR studies of the structure and function of large biological macromolecules. Curr Opin Struct Biol. 2003;13(5):570–580. doi: 10.1016/j.sbi.2003.09.009. [DOI] [PubMed] [Google Scholar]
- Foster RJ, Damion RA, Baboolal TG, et al. A nuclear magnetic resonance study of water in aggrecan solutions. Royal Soc Open Sci. 2016;3:150705. doi: 10.1098/rsos.150705. [DOI] [PMC free article] [PubMed] [Google Scholar]
- Foster MP, McElroy CA, Amero CD. Solution NMR of large molecules and assemblies. Biochim. 2007;46(2):331–340. doi: 10.1021/bi0621314. [DOI] [PMC free article] [PubMed] [Google Scholar]
- Galvosas P, Qiao Y, Schönhoff M, Callaghan PT. On the use of 2D correlation and exchange NMR spectroscopy in organic porous materials. Magn Reson Imaging. 2007;25:497–500. doi: 10.1016/j.mri.2006.11.009. [DOI] [PubMed] [Google Scholar]
- Grigera JR, Berendsen HJC. The molecular details of collagen hydration. Biopolymers. 1979;18:47–57. [Google Scholar]
- Gran HC, Hansent EW. Exchange rates of ethanol with water in water-saturated cement pastes probed by NMR. Adv Cement Base Mater. 1998;8:108–117. [Google Scholar]
- Halle B. Protein hydration dynamics in solution: a critical survey. Phil Trans Royal Soc Lond B. 2004;359:1207–1224. doi: 10.1098/rstb.2004.1499. [DOI] [PMC free article] [PubMed] [Google Scholar]
- Henkelman RM, Stanisz GJ, Kim JK, Bronskill MJ. Anisotropy of NMR properties of tissue. Magn Reson Med. 1994;32(5):592–601. doi: 10.1002/mrm.1910320508. [DOI] [PubMed] [Google Scholar]
- Hocking HG, Zangger K, Madl T. Studying the structure and dynamics of biomolecules by using soluble paramagnetic probes. ChemPhysChem. 2014;14:3082–3094. doi: 10.1002/cphc.201300219. [DOI] [PMC free article] [PubMed] [Google Scholar]
- Hoffmann F, Mulder F, Schafer LF (2019) Predicting NMR relaxation of proteins from molecular dynamics simulations with accurate methyl rotation barriers. ChemRxiv: preprint. DOI: 10.26434/chemrxiv.8982338 [DOI] [PubMed]
- Huang H, Melacini G. High-resolution protein hydration NMR experiments: probing how protein surfaces interact with water and other non-covalent ligands. Anal Chim Acta. 2006;564(1):1–9. doi: 10.1016/j.aca.2005.10.049. [DOI] [PubMed] [Google Scholar]
- Huang F, Pei YY, Zuo HH, et al. Bioconjugation of proteins with paramagnetic NMR and fluorescent tag. Chem Eur J. 2013;19:17141–17149. doi: 10.1002/chem.201302273. [DOI] [PubMed] [Google Scholar]
- Hurlimann MD, Venkataramanan L. Quantitative measurement of two-dimensional distribution functions of diffusion and relaxation in grossly inhomogeneous fields. J Magn Reson. 2002;157:31. doi: 10.1006/jmre.2002.2567. [DOI] [PubMed] [Google Scholar]
- Ikoma K, Takamiya H, Kusaka Y, et al. 1H double-quantum filtered MR imaging of joints tissues: bound water specific imaging of tendons, ligaments and cartilage. Magn Reson Imaging. 2001;19:1287–1296. doi: 10.1016/s0730-725x(01)00463-5. [DOI] [PubMed] [Google Scholar]
- Irmukhametova GS, Mun GA, Khutoryanskiy VV. Thiolated mucoadhesive and PEGylated nonmucoadhesive organosilica nanoparticles from 3-mercaptopropyltrimethoxysilane. Langmuir. 2011;27:9551–9556. doi: 10.1021/la201385h. [DOI] [PubMed] [Google Scholar]
- Ishima R, Torchia DA. Protein dynamics from NMR. Nat Struct Biol. 2000;7(9):740–743. doi: 10.1038/78963. [DOI] [PubMed] [Google Scholar]
- Jehng JY, Sprague DT, Halperin WP. Pore structure of hydrating cement paste by magnetic resonance relaxation analysis and freezing. Magn Reson Imaging. 1996;14(7/8):785–791. doi: 10.1016/s0730-725x(96)00164-6. [DOI] [PubMed] [Google Scholar]
- Keeler J (2010) Understanding NMR spectroscopy, 2nd edn. Wiley, p.511
- Kerch G. Polymer hydration and stiffness at biointerfaces and related cellular processes. Nanomedicine. 2018;14(1):13–25. doi: 10.1016/j.nano.2017.08.012. [DOI] [PubMed] [Google Scholar]
- Kotecha M, Ravindran S, Schmid TM, et al. The application of sodium triple-quantum coherence NMR spectroscopy for the study of growth dynamics in cartilage tissue engineering. NMR Biomed. 2013;26(6):709–717. doi: 10.1002/nbm.2916. [DOI] [PMC free article] [PubMed] [Google Scholar]
- Kotecha M, Yin Z, Magin RL (2013b) Monitoring tissue engineering and regeneration by magnetic resonance imaging and spectroscopy. J Tissue Sci Eng S11. 10.4172/2157-7552.S11-007
- Kotecha M, Klatt D, Magin RL. Monitoring cartilage tissue engineering using magnetic resonance spectroscopy, imaging, and elastography. Tissue Eng Part B. 2013;9(6):470–484. doi: 10.1089/ten.teb.2012.0755. [DOI] [PMC free article] [PubMed] [Google Scholar]
- Krishman VV. Determination of oligomeric state of proteins in solution from pulsed-field-gradient self-diffusion coefficient measurements. A comparison of experimental, theoretical and hard-sphere approximated values. J Magn Reson. 1996;124:468–473. [Google Scholar]
- Kuntz ID, Brassfield TS, Law D et al (1969) Hydration of macromolecules. Science 163(3873):1329–1331 [DOI] [PubMed]
- Kuntz ID. Hydration of macromolecules. III. Hydration of polypeptides. J Am Chem Soc. 1971;93(2):514–516. doi: 10.1021/ja00731a036. [DOI] [PubMed] [Google Scholar]
- Kuntz ID, Kauzmann W. Hydration of proteins and polypeptides. Adv Protein Chem. 1974;28:239–345. doi: 10.1016/s0065-3233(08)60232-6. [DOI] [PubMed] [Google Scholar]
- Liu H, Fan H, Wang Y, et al. The interaction between a combined knitted silk scaffold and microporous silk sponge with human mesenchymal stem cells for ligament tissue engineering. Biomaterials. 2008;29:662–674. doi: 10.1016/j.biomaterials.2007.10.035. [DOI] [PubMed] [Google Scholar]
- Mandal A, van der Wel PCA. MAS 1H NMR probes freezing point depression of water and liquid-gel phase transitions in liposomes. Biophys J. 2016;111(9):1965–1973. doi: 10.1016/j.bpj.2016.09.027. [DOI] [PMC free article] [PubMed] [Google Scholar]
- Mandala VS, Williams JK, Hong M. Structure and dynamics of membrane proteins from solid-state NMR. Annu Rev Biophys. 2018;47:201–222. doi: 10.1146/annurev-biophys-070816-033712. [DOI] [PMC free article] [PubMed] [Google Scholar]
- Martini S, Bonechi C, Foletti A et al (2013) Water-protein interactions: the secret of protein dynamics. Sci World J 138916. 10.1155/2013/138916 [DOI] [PMC free article] [PubMed]
- Mathur-De Vre R. The NMR studies of water in biological systems. Progr Biophys Molec Biol. 1979;35:103–134. doi: 10.1016/0079-6107(80)90004-8. [DOI] [PubMed] [Google Scholar]
- Mendelson KS, Halperin WP, Jehng JY, Song YQ. Surface magnetic relaxation in cement pastes. Magn Reson Imaging. 1994;12(2):207–208. doi: 10.1016/0730-725x(94)91517-2. [DOI] [PubMed] [Google Scholar]
- Menon RS, Rusinko MS, Allen PS. Multiexponential proton relaxation in model cellular systems. Magn Reson Med. 1991;20:196–213. doi: 10.1002/mrm.1910200204. [DOI] [PubMed] [Google Scholar]
- Migchelsen C, Berendsen HJC. Proton exchange and molecular orientation of water in hydrated collagen fibers. An NMR study of H2O and D2O. J Chem Phys. 1973;59(1):296–305. [Google Scholar]
- Mittermaier A, Kay LE. New tools provide new insights in NMR studies of protein dynamics. Science. 2006;312(5771):224–228. doi: 10.1126/science.1124964. [DOI] [PubMed] [Google Scholar]
- Moniz T, de Castro B, Rangel M, Ivanova G. NMR study of the interaction of fluorescent 3-hydroxy-4-pyridinone chelators with DMPC liposomes. Phys Chem Chem Phys PCCP. 2016;8(6):5027–5033. doi: 10.1039/C5CP05273D. [DOI] [PubMed] [Google Scholar]
- Navon G, Shinar H, Eliav U. Multiquantum filters and order in tissues. NMR Biomed. 2001;14(2):112–132. doi: 10.1002/nbm.687. [DOI] [PubMed] [Google Scholar]
- Neudecker P, Lundstrom P, Kay LE. Relaxation dispersion NMR spectroscopy as a tool for detailed studies of protein folding. Biophys J. 2009;96(6):2045–2054. doi: 10.1016/j.bpj.2008.12.3907. [DOI] [PMC free article] [PubMed] [Google Scholar]
- Nooeaid P, Salih V, Beier JP et al (2012) Osteochondral tissue engineering: Scaffolds, stem cells and applications. Journal of Cellular and Molecular Medicine 16(10):2247–2270 [DOI] [PMC free article] [PubMed]
- Otting G. NMR studies of water bound to biological molecules. Progr NMR Spectr. 1997;31:259–285. [Google Scholar]
- Palmer AG. Chemical exchange in biomacromolecules: past, present, and future. J Magn Reson. 2014;241:3–17. doi: 10.1016/j.jmr.2014.01.008. [DOI] [PMC free article] [PubMed] [Google Scholar]
- Peemoeller H, Shenoy RK, Pintar MM. Two-dimensional nmr time evolution correlation spectroscopy in wet lysozyme. J Magn Reson. 1981;45(2):193–204. [Google Scholar]
- Ponomarev A, Rodin VV, Gurevich L, et al. Hypothermic preservation of red blood cells in different conditions of inert gas xenon: hyperbaria and clathrates. CryLetters. 2018;39(6):391–400. [PubMed] [Google Scholar]
- Pothirajan P, Ravindran S, George A, et al. IEEE 36th annual international IEEE EMBS conference. 2014. Magnetic resonance spectroscopy and imaging can differentiate between engineered bone and engineered cartilage; pp. 3929–3932. [DOI] [PubMed] [Google Scholar]
- Rajan R, Matsumura K. Development and application of cryoprotectants. Adv Exp Med Biol. 2018;1081:339–354. doi: 10.1007/978-981-13-1244-1_18. [DOI] [PubMed] [Google Scholar]
- Rodin VV, Isangalin FS, Volkov VY (1984) Structure of water protein solutions in a presence of xenon clathrates. Cryobiol CryoMed 14:3–7
- Rodin VV, Isangalin FS, Volkov VY (1986) Investigation of formation of the xenon clathrates in E.coli suspensions using the NMR method of paramagnetic doping. Biophysics 31(2):274–277. https://eurekamag.com/research/005/481/005481755.php
- Rodin VV, Izmailova VN (1994) Influence of disaccharides on the stability of PhL-vesicles to low temperature action by NMR-data. Colloid J 56(6):833–839. Google Scholar
- Rodin VV, Izmailova VN (1995) Lipid-nucleic interactions in dispersions of PhL-vesicles by NMR-data. Colloid J 57(2):231–239
- Rodin VV (1997) Characterization of the biotechnological dispersion systems using magnetic resonance methods. Moscow State University, M., PhD Thesis, Doctor of Chem. Sciences: Macromolecular and colloid chemistry. 278 p. Google Scholar
- Rodin VV, Izmailova VN (1998) Study of biocolloids by radiospectroscopy methods (interactions of phospholipid vesicles with polynucleotides), ACH-models in chemistry 134(6): 833–844. Google Scholar
- Rodin VV, Knight DP (2003a) Natural materials by NMR data: cross-relaxation in macromolecules of natural silk. Mater Sci 10:16–21. Google Scholar
- Rodin VV, Knight DP (2003b) Self-diffusion of water into silk fibers from magnetic field pulse gradient data. Biophysics 48(3):429–435. https://pubmed.ncbi.nlm.nih.gov/12815853/ [PubMed]
- Rodin VV (2004) Magnetic resonance methods, 1st edn. Press MIPhT, Moscow, 95 p
- Rodin VV, Knight DP (2004) Molecular mobility in natural polymers: Bombyx mori silk with low water content as studied by DQF NMR. Biophysics 49(5):730–737. https://www.ncbi.nlm.nih.gov/pubmed/15526463 [PubMed]
- Rodin VV, Reznichenko GM, Vasina EL (2004b) Properties of natural polymer fibers with low water content. Materials science 1:34–42. Google Scholar
- Rodin VV, Foucat L, Renou JP (2004c) The dipolar interactions and dynamics of water molecules in collagen fibres from two connective tissues of different ages by 1H double-quantum-filtered NMR spectroscopy. Materials science 5:2–10. https://www.ncbi.nlm.nih.gov/pubmed/15458243
- Rodin VV (2013) Translational dynamics of molecules in synthetic and natural polymers as studied by NMR. 27th ECIS Conference, 2013 September 1–6, Sofia, Bulgaria
- Rodin VV, McDonald PJ, Zamani Z (2013) A nuclear magnetic resonance pulsed field gradient study of self-diffusion of water in hydrated cement pastes. Diffus Fundam 18(3):1–7. Google Scholar
- Rodin VV, Nikerov VA (2014) NMR-relaxation and PFG NMR studies of water dynamics in oriented collagen fibres with different degree of cross-linking. Current Tissue Eng 3(1):47–61 10.2174/2211542003666140626211652
- Rodin VV, McDonald PJ, Jones M (2014) Two-dimensional distribution function of diffusion in wood obtained using 2D Laplace inversion. Appl Phys Math 6:3–7. Google Scholar
- Rodin VV, Cosgrove T (2016) Nuclear magnetic resonance study of water-polymer interactions and self-diffusion of water in polymer films. OALJ Chem Mater Sci 3(10):1–17. 10.4236/oalib.1103018
- Rodin VV (2017) Methods of magnetic resonance in studying natural biomaterials. In: Wang Z (ed) Encyclopedia of physical organic chemistry, 1st edn. Wiley, New York, part 4, pp 2861–2908. http://eu.wiley.com/WileyCDA/WileyTitle/productCd-1118470451.html10.1002/9781118468586.epoc4008
- Rodin VV, Ponomarev A, Gerasimov M, Gurevich L (2017) Inter J Biochem & Biophys 5:26–36. http://www.hrpub.org/download/20170330/IJBB4-10890467.pdf
- Rodin VV (2018a) Magnetic resonance in studying cells, biotechnology dispersions, fibers and collagen based tissues for biomedical engineering. In: Artmann G (ed) Biological, physical and technical basics of cell engineering. 1st edn. Springer, Publishing Company Springer Nature, p 339–363. https://link.springer.com/chapter/10.1007/978-981-10-7904-7_15
- Rodin VV (2018b) Macromolecular hydration: NMR studies. In: Roberts GCK, Watts A (eds) Encyclopedia of biophysics, 2nd edn. European Biophysical Societies’ Association 10.1007/978-3-642-35943-9_10075-2
- Rodin VV (2018c) Magnetic resonance in studying natural and synthetic materials Bentham science publishing, P.244. https://www.eurekalert.org/pub_releases/2018-11/bsp-mri112218.php
- Rodin VV (2019) One- and two-dimensional NMR in studying wood-water interaction at moisturizing spruce. Anisotropy of water self-diffusion. Colloids Interfaces 3(3):54 10.3390/colloids3030054
- Sell SA, Wolfe PS, Garg K, et al. The use of natural polymers in tissue engineering: a focus on electrospun extracellular matrix analogues. Polymers. 2010;2:522–553. doi: 10.3390/polym2040522. [DOI] [Google Scholar]
- Senturia SD, Robinson JD. Nuclear spin lattice relaxation of liquid confined in porous solids. SPE J. 1970;10:237–244. [Google Scholar]
- Seo Y, Ikoma K, Takamiya H, et al. 1H double-quantum-filtered MR imaging as a new tool for assessment of healing of the ruptured Achilles tendon. Magn Reson Med. 1999;42:884–889. doi: 10.1002/(sici)1522-2594(199911)42:5<884::aid-mrm7>3.0.co;2-0. [DOI] [PubMed] [Google Scholar]
- Seo YK, Choi GM, Kwon SY, et al. The biocompatibility of silk scaffold for tissue engineered ligaments. Key Eng Mater. 2007;342:73–76. [Google Scholar]
- Shinar H, Navon G. Multinuclear NMR and microscopic MRI studies of the articular cartilage nanostructure. NMR Biomed. 2006;19(7):877–893. doi: 10.1002/nbm.1068. [DOI] [PubMed] [Google Scholar]
- Siemer AB, Huang KY, McDermott AE. Protein linewidth and solvent dynamics in frozen solution NMR. PLoS One. 2012;7(10):e47242. doi: 10.1371/journal.pone.0047242. [DOI] [PMC free article] [PubMed] [Google Scholar]
- Soffer L, Wang X, Zhang X, et al. Silk-based electrospun tubular scaffolds for tissue-engineered vascular grafts. Journal of biomaterials science Polymer Edition. 2008;19:653–664. doi: 10.1163/156856208784089607. [DOI] [PMC free article] [PubMed] [Google Scholar]
- Song YQ, Venkataramanan L, Hürlimann MD, et al. Correlation spectra obtained using a fast two-dimensional Laplace inversion. J Magn Reson. 2002;154(2):261–268. doi: 10.1006/jmre.2001.2474. [DOI] [PubMed] [Google Scholar]
- Song YQ, Cho H, Hopper T, et al. Magnetic resonance in porous media: recent progress. J Chem Phys. 2008;128(5):052212–052212. doi: 10.1063/1.2833581. [DOI] [PubMed] [Google Scholar]
- Song YQ. Focus on the physics of magnetic resonance on porous media. New J Phys. 2012;14:055017. [Google Scholar]
- Szuminska K, Gutsze A, Kowalczyk A (2001) Relaxation of water protons in highly concentrated aqueous protein systems studied by nmr spectroscopy. Z Naturforsch 56c:1075-1081 [DOI] [PubMed]
- Takamiya H, Kusaka Y, Seo Y, et al. Characteristics of proton NMR T2 relaxation of water in the normal and regenerating tendon. The Japanese Journal of Physiology. 2000;50:569–576. doi: 10.2170/jjphysiol.50.569. [DOI] [PubMed] [Google Scholar]
- Takemura K, Kitao A (2012) Water Model Tuning for Improved Reproduction of Rotational Diffusion and NMR Spectral Density. J Phys Chem B 116:6279–6287 [DOI] [PubMed]
- Takeuchi K, Arthanari H, Shimada I et al (2015) Nitrogen detected TROSY at high field yields high resolution and sensitivity for protein NMR. J Biomol NMR [DOI] [PMC free article] [PubMed]
- Tanner JE, Stejskal EO. Restricted self-diffusion of protons in colloidal systems by the pulsed gradient spin-echo method. J Chem Phys. 1968;49(4):1768–1777. [Google Scholar]
- Tanner JE. Self-diffusion of water in frog muscle. Biophys J. 1979;28(1):106–116. doi: 10.1016/S0006-3495(79)85162-0. [DOI] [PMC free article] [PubMed] [Google Scholar]
- Tarannum A, Adams A, Blümich B, Fathima NN. Impact of ionic liquids on the structure and dynamics of collagen. J Phys Chem. 2018;122(3):1060–1065. doi: 10.1021/acs.jpcb.7b09626. [DOI] [PubMed] [Google Scholar]
- Tsoref L, Shinar H, Seo Y, et al. Proton doubsle-quantum filtered MRI-A new method for imaging ordered tissues. Magn Reson Med. 1998;40(5):720–726. doi: 10.1002/mrm.1910400512. [DOI] [PubMed] [Google Scholar]
- Van-Quynh A, Willson S, Bryant R. Protein reorientation and bound water molecules measured by 1H magnetic spin-lattice relaxation. Biophys J. 2003;84:558–563. doi: 10.1016/S0006-3495(03)74875-9. [DOI] [PMC free article] [PubMed] [Google Scholar]
- van Beek JD, Kümmerlen J, Vollrath F, Meier BH. Supercontracted spider dragline silk: a solid-state NMR study of the local structure. Int J Biol Macromol. 1999;24(2–3):173–178. doi: 10.1016/s0141-8130(98)00083-x. [DOI] [PubMed] [Google Scholar]
- Venkataramanan L, Song YQ, Hurlimann MD. Solving Fredholm integrals of the first kind with tensor product structure in 2 and 2.5 dimensions. IEEE Trans Signal Process. 2002;50(5):1017–1026. [Google Scholar]
- Wider G. Technical aspects of NMR spectroscopy with biological macromolecules. Prog NMR Spectr. 1998;32:193–275. [Google Scholar]
- Wider G (1999) Transverse relaxation-optimized NMR spectroscopy (TROSY). European patent EP 0 916963 B1
- Wüthrich K, Billeter M, Bill P, et al. NMR studies of the hydration of biological macromolecules. Faraday Discuss. 1996;103:245–253. [Google Scholar]
- Xie M, Yu L, Bruschweiler-Li L, Xiang X et al (2019) Functional protein dynamics on uncharted time scales detected by nanoparticle-assisted NMR spin relaxation. Sci Adv 5(8): eaax5560. DOI: 10.1126/sciadv.aax5560 [DOI] [PMC free article] [PubMed]
- Xu Y, Matthew S. TROSY NMR spectroscopy of large soluble proteins. Top Curr Chem. 2013;335:97–119. doi: 10.1007/128_2011_228. [DOI] [PubMed] [Google Scholar]
- Yazawa K, Ishida K, Masunaga H, et al. Influence of water content on the β-sheet formation, thermal stability, water removal, and mechanical properties of silk materials. Biomacromol. 2016;17:1057–1060. doi: 10.1021/acs.biomac.5b01685. [DOI] [PubMed] [Google Scholar]
- Zeugolis D, Khew ST, Elijah SY, et al. Electro-spinning of pure collagen nano-fibres—just an expensive way to make gelatin? Biomaterials. 2008;29:2293–2305. doi: 10.1016/j.biomaterials.2008.02.009. [DOI] [PubMed] [Google Scholar]
- Zhang A, Sun H, Xu H, et al. Cell metabolomics. OMICS: A Journal of Integrative Biology. 2013;17(10):495–501. doi: 10.1089/omi.2012.0090. [DOI] [PMC free article] [PubMed] [Google Scholar]
- Zhang B, Xie M, Bruschweiler-Li L, et al. Use of charged nanoparticles in NMR-based metabolomics for spectral simplification and improved metabolite identification. Anal Chem. 2015;87(14):7211–7217. doi: 10.1021/acs.analchem.5b01142. [DOI] [PMC free article] [PubMed] [Google Scholar]
- Zhdanov RI, Volkova LA, Rodin VV. Lipid spin labeling and NMR study of interaction between polyadenylic acid: polyuridilic acid duplex and egg phosphatidylcholine liposomes. Evidence for involvement of surface groups of bilayer, phosphoryl groups and metal cations. Applied Magnetic Resonance. 1994;7(1):131–146. [Google Scholar]
- Zubow K, Zubow VA, Zubow A (2016) Phenomenal properties of the domain ensembles in proteins. Biochem & Molecular Biol Journal 2(1:5):1–10