

Abstract
Background:
Autism and attention-deficit/hyperactivity disorder (ADHD) are associated with complex changes as revealed by functional magnetic resonance imaging (fMRI). To date, neuroimaging-based models are not able to characterize individuals with sufficient sensitivity and specificity. Further, although evidence demonstrates occurrence of ADHD traits in individuals with autism, and autism traits in individuals with ADHD, the neurofunctional basis of the overlap is undefined.
Methods:
Using individuals from the Autism-Brain-Imaging-Data-Exchange and ADHD- 200, we apply a data-driven subject-level approach, connectome-based-predictive-modeling, to resting-state fMRI data to identify brain-behavior associations which are predictive of symptom severity. We examine cross-diagnostic commonalities and differences.
Results:
Using leave-one-subject-out and split-half analyses, we define networks that predict Social Responsiveness Scale (SRS), Autism Diagnostic Observation Schedule, and ADHD Rating-Scale scores and confirm that these networks generalize to novel subjects. Networks share minimal overlap of edges (<2%), but some common high hub-ness regions (BA10,11,21, cerebellum, and thalamus). Further, predicted SRS scores for individuals with ADHD are linked to ADHD symptoms, supporting the hypothesis that brain organization relevant to autism severity shares a component associated with attention in ADHD. Predictive connections and high hub-ness regions are found within a wide range of brain areas and across conventional networks.
Conclusions:
An individual’s functional connectivity profile contains information that supports dimensional, non-binary classification in autism and ADHD. Furthermore, we can determine disorder-specific and shared neurofunctional pathology using our method.
Keywords: Functional MRI, magnetic resonance imaging, autism spectrum disorder, ADHD, functional connectivity, predictive modeling
INTRODUCTION
The assessment of autism spectrum disorder (ASD) is challenging, in part because ASD includes a spectrum of symptoms, skills, and levels of impairment(1). As such, diagnosis, estimating severity, and treatment choices often vary widely across individuals. Reflecting this clinical complexity, the associated neural correlates are also complex, have been difficult to characterize, and are not well understood(2). Similarly, attention-deficit/hyperactivity disorder (ADHD) is characterized by multi-system structural and functional brain abnormalities which present in varied ways within the population(3). Together, ASD (prevalence ~2%) and ADHD (~6%) are the most common childhood neurodevelopmental disorders(4,5). Furthermore, across referred/non-referred populations, symptoms of ASD occur with greater frequency (20%) in children with ADHD, and ADHD symptoms occur with greater frequency (30–50%) in children with ASD(6–8). Yet, the underlying neurofunctional basis of the interplay between disorders is undefined and understudied(9,10).
Despite the overlap in clinical presentation, ASD and ADHD are defined as distinct disorders(11). As such, there are a limited number of studies which investigate these disorders together within the same work. Among the exceptions, there is a lack of consensus(10,12–14). Furthermore, there are controversial findings regarding genetic overlap between ASD and ADHD(15–17).
Functional magnetic resonance imaging (fMRI) is a non-invasive methodology that can measure a correlate of brain activity(18). The dynamic time-series fMRI data can be analyzed to identify patterns of coupling between distinct anatomical regions: a measure referred to as functional connectivity (FC)(B19). A map of all the connections in the brain is referred to as the functional connectome(20). Recent work has demonstrated that individuals have unique FC patterns, that contain information about behavioral traits and/or clinical symptoms which may prove useful in guiding individualized clinical management(12,21–25). Specifically, Finn et al. 2015 demonstrates that FC can be used to predict fluid intelligence(21). Furthermore, others have demonstrated the utility of this method in predicting openness, attention and intelligence(22–25).
FC studies of ASD show alterations in multiple functional networks compared to typically developing (TD) individuals(2, 9, 26–30). Similarly, altered FC has been documented in individuals with ADHD, and transdiagnostically(9, 30–33). However, studies demonstrating a continuous relationship between behavioral measures (gold-standard clinical evaluation) and FC are very limited, as the vast majority focus on diagnosis(26, 34). Furthermore, few studies predict out-of-sample — rather than explain within-sample — clinical scores, many are under-powered, and the results are rarely replicated(3, 26, 34–36). As recent reviews summarize, findings in this area are generally complex and non-converging, likely reflecting both the heterogeneity of these disorders and the disparate but relevant brain circuits investigated(37–39).
Given the substantial individual differences in ASD and ADHD symptomatology and the complex imaging correlates, a whole-brain data-driven dimensional approach focused on individual differences rather than categorical/binary grouping may be more useful in capturing features across multiple brain circuits. Here, we test the hypothesis that connectome-based predictive modeling (CPM) can be used to identify complex whole-brain networks that predict symptom severity(21, 25, 40). Notably, CPM networks can be difficult to interpret. Therefore, we implement two strategies to describe our results in more familiar framework: overlap of edges with a priori networks, and regions of high ‘hub-ness’(41, 42).
We focus on two clinical scores relevant to autism, the Social Responsiveness Scale (SRS) and the Autism Diagnostic Observation Schedule (ADOS), available from the Autism Brain Imaging Data Exchange (ABIDE) as well as the ADHD Rating Scale (IV) (ADHD-RS) available from the ADHD-200(43–45). Using both leave-one-subject-out (LOO) and split-half cross-validation, we validate our models and define three functional networks related to SRS, ADOS, and ADHD-RS scores. We explore the generalizability of our models within and across disorders(6–8, 17, 46–48).
METHODS
2.0. Data sets
We analyzed data from ABIDE-I/II and the ADHD-200 consortium, two publicly available multi-site data sets of resting-state fMRI (rs-fMRI), demographic, and clinical assessment data(43–45). Details available for ABIDE-I/II at fcon_1000.projects.ni-trc.org/indi/abide/ and ADHD-200 at fcon_1000.projects.nitrc.org/indi/adhd200/. Refer to supplementary material for imaging parameters.
2.1. Data processing
Standard pre-processing was applied (see supplementary material)(23, 49, 50). For each individual, a 268×268 connectivity matrix was calculated using a functional atlas defined on a separate population(21, 41). Each entry in the matrix represents the strength of the functional connection between two nodes, also referred to as an “edge” and the matrix as a whole is the individual’s functional connectome.
2.2. Behavior metrics
Briefly, from ABIDE-I/II, we use SRS scores which serve as a broad-spectrum estimate of autistic traits across ASD and TD individuals(51). We also use a more intensive scale, ADOS, which is exclusive to ASD(52). From ADHD-200, we include the ADHD-RS (IV)(53). Refer to supplementary material for details and examples.
2.3. Model building: behavior prediction
Models were built using LOO cross-validation CPM(21, 23, 40). Briefly, there are three steps: (1) feature selection (N-1 training set), (2) building of a predictive model (N- 1 training set), (3) testing the left-out subject. Each individual is left-out once in an iterative framework which builds a network of predictive edges, and predicted scores for all individuals. Refer to Supplementary Figure 2 for an illustrated description(54). Note, motion was not regressed during this analysis and diagnosis does not enter into the model. No normalization of score (across module/version) is necessary as only one is used to build each model [Supplementary Table 1]. Finally, while partial correlation-based functional connectivity measures have been validated; here, there are fewer observations (i.e. frames or time points) than nodes(55–57). Therefore, to avoid the pitfalls of arbitrary parameterization, we chose to not do partial correlation. We apply Bonferroni correction for multiple comparisons (6 SRS, 4 ADOS, and 3 ADHD-RS scores).
2.4. Internal validation: split-half cross-validation, permutation testing, and extrapolation
To test model robustness, we use split-half validation (n=200 iterations) and permutation testing (n=1,000 iterations). For split-half validation, individuals are divided equally between train and test groups by random selection. Network/model building is conducted within the training group as described above (2.3) and the model is applied to the test group. For permutation testing, subject labels and clinical scores are randomly shuffled to break the true brain-behavior relationship, then prediction performed on the shuffled data to generate a null result(40). We test if correlations from train/test and shuffled data come from different distributions (kruskalwallis, MATLAB). Within each split-half iteration, networks/models are applied (extrapolated) to all individuals (less those used to generate the model) whether or not clinical scores are available from these individuals. Thus, for each individual, we generate an average clinical score prediction which we compare between diagnosis groups (anova1, MATLAB). We apply Bonferroni correction for multiple comparisons. To avoid ‘double-dipping’, scores are never predicted for individuals who are within the network/model building group.
2.5. Network anatomy of edges
The brain is complex and the networks identified by CPM reflect this complexity. In order to assess the extent to which our models share common features, we compute the probability that n shared edges exist between our networks and edges within or between 10 atlas networks(41, 42). Significance was determined using the hypergeometric cumulative distribution function (hygecdf, MATLAB, Bonferroni correction for 55 comparisons). We report the likelihood (1.0-Pvalue) that each atlas network (and internetwork pair) contributes to our networks.
Furthermore, we analyze the distribution of edge lengths within our networks (defined as the Euclidean distance between the center of mass between nodes). Using MATLAB, we test for outliers (kurtosis), normalcy (lillietest), a tendency towards long/short connections (skewness) and differences between +ve/−ve network distributions (ranksum). In addition, we evaluate the anatomy of shared features between networks by taking the products of +ve/+ve, +ve/−ve, −ve/+ve and −ve/−ve network pairs across scales and compute the likelihood that each of the resulting sets of shared features contain n edges.
2.6. Node hub-ness
Above, we describe overlap using shared edges. Here, we identify nodes within our networks with high ‘hub-ness’ (i.e. with a greater number of connections to other nodes). We calculate hub-ness by taking the node with the greatest number of edges (connections to other nodes) within a network and dividing the number of edges connecting to each node within the given network by this maximum value. Thus, for each node in a network we obtain a number (0–1) which scales relative to the greatest number of connections (or highest hub-ness). Although this allows inferences to be made about the most connected nodes within our networks, it should be emphasized that CPM is driven by edges not nodes.
RESULTS
Results generated from ABIDE-I/II data precede results generated from ADHD- 200 data followed by the cross-diagnosis comparison.
3.0. Participants
Exclusion criteria are described in supplementary material(58). To account for site effects, we repeat our analysis in a leave-one-site out framework [Supplementary Figure 3]. We observe no change in our findings. However, it should be noted that this is an imperfect method and site effects could still be influencing our observations. On the other hand, a study such as the present work is impossible without the participation of multiple sites.
3.1. ASD behavior prediction (ABIDE-I/II)
For all SRS sub-scales, predicted behavior correlated with known scores (R=0.23–37, P<0.00002) [Figure 1.A.]. Similar, results were obtained for ADOS scores (R=0.43–0.60, P<0.0002) [Figure 1.B.]. In all cases, age, FIQ and motion were included along with our model as covariates [Supplementary Table 1]. As a secondary analysis, we considered male individuals and obtained comparable results [Supplementary Table 1.C./D.]. Insufficient data was available for a female group. These results affirm our hypothesis that CPM can be used to predict severity of ASD symptoms. That is, the individual’s functional connectome contains information reflecting social behavioral scores as measured by SRS and ADOS.
Figure 1. LOO cross-validation CPM results for SRS and ADOS sub-scale score.

(A.) LOO cross-validation CPM results for SRS sub-scale scores. For each SRS sub-scale (i.-vi.), the sum of the predicted SRS score from +ve and −ve models are plotted against known scores. (B.) As in (A.) for ADOS sub-scale scores. The linear regression and 95% confidence interval are shown in black/grey.
3.2. Internal validation of SRS/ADOS models
To test the robustness of our models and generalizability within ABIDE-I/II, we used split-half cross-validation and permutation testing. Correlations between known and predicted behavior for split-half train/test groups are plotted alongside correlations obtained from shuffled data (null results) [Figure 2.A.]. For all SRS/ADOS sub-scales, correlations from train/test data were greater than shuffled data. When SRS/ADOS models were applied to all individuals (less those used to generate the model), mean predicted scores (across iterations) were greater for ASD relative to TD individuals (N=632) [Figure 2.B] with the exception of the ADOS severity sub-scale. As a control, whole-brain connectivity in place of SRS/ADOS networks showed no difference between diagnostic groups [Supplementary Figures 5&6.C.]. Note, networks/models generated within this section are not used in future sections. Networks from Section 3.1 (generated from all individuals) are applied in all following analyses.
Figure 2. SRS and ADOS split-half cross-validation and permutation testing results, and application to all individuals (ABIDE-I/II).
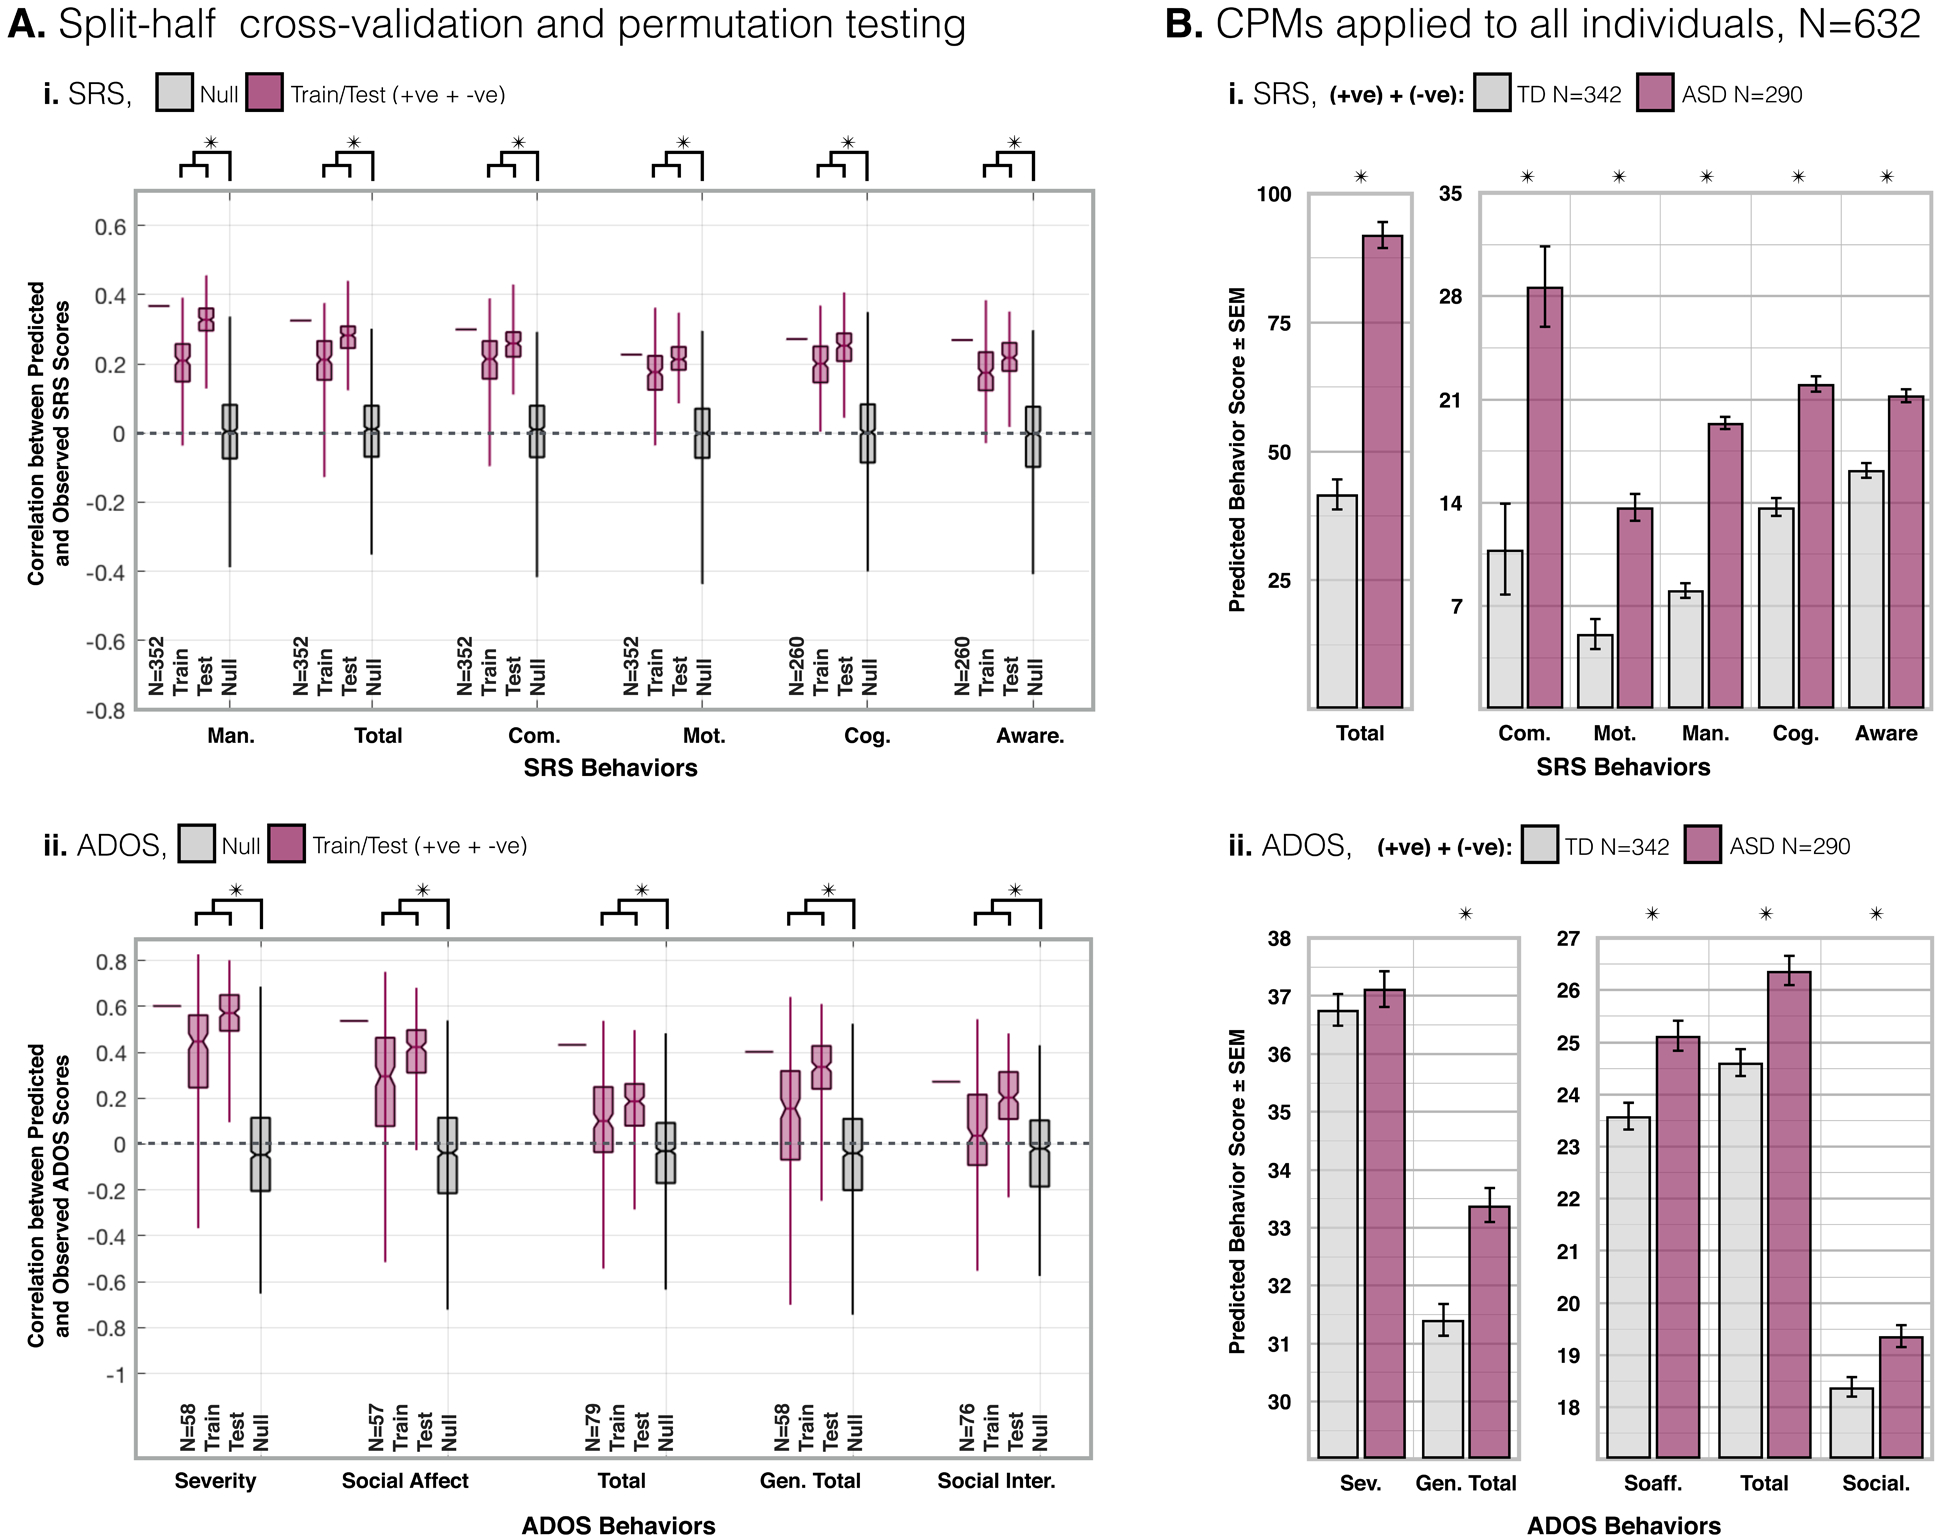
(A.) Correlation (R-value) for split-half cross-validation. (i.) For each SRS sub-scale, the bar in the left-most column is reproduced for reference from the LOO cross-validation CPM results reported in Figure 1. N=352/260. The middle two columns are from split-half train/test cross-validation CPMs (n=200 iterations). The final column shows the null results from permutation testing where subjects and scores are scrambled prior to LOO cross-validation (n=1,000). For all SRS sub-scales, train/test results are greater than null results (P<2E-144). (ii.) Same as (i.) for ADOS sub-scales (P<0.03). See Supplementary Figure 3.A.&4.A. for results from SRS&ADOS +ve/−ve feature sets. (B.) From each iteration of the split-half cross-validation, the model was applied to all individuals from ABIDE-I/II less those in the training group (N=632 training) to predict clinical scores. Across iterations (n=200) mean predicted scores are compared between TD and ASD individuals. For all sub-scales, predicted SRS (P<1E-07) scores are greater for ASD than TD individuals (i.). Likewise, all but the severity ADOS sub-scale score was greater for ASD than TD individuals (P<0.02) (ii.). Between ASD and TD groups, motion (P>0.14), and age (P>0.96) were not different.
3.3. Anatomy of SRS/ADOS networks
Unsurprisingly, given that sub-scale scores are highly correlated [Supplementary Figure 1.A.], the anatomy of sub-scale networks are similar (e.g. across SRS subscales, +ve edges are very likely to overlap with edges within the cerebellum). On the other hand, there are notable exceptions where sub-scale network anatomy diverges (e.g. edges between medial-frontal and motor networks were very likely to occur within SRS total, communication, motivation and mannerism +ve sub-scale networks, but unlikely to occur within SRS cognition and awareness +ve sub-scale networks) [Figure 3. examples highlighted]. Although it is difficult to summarize the complex networks generated with CPM, here feature sets which contribute most to SRS and ADOS networks are described in a more familiar framework.
Figure 3. Anatomy of SRS and ADOS sub-scale networks.
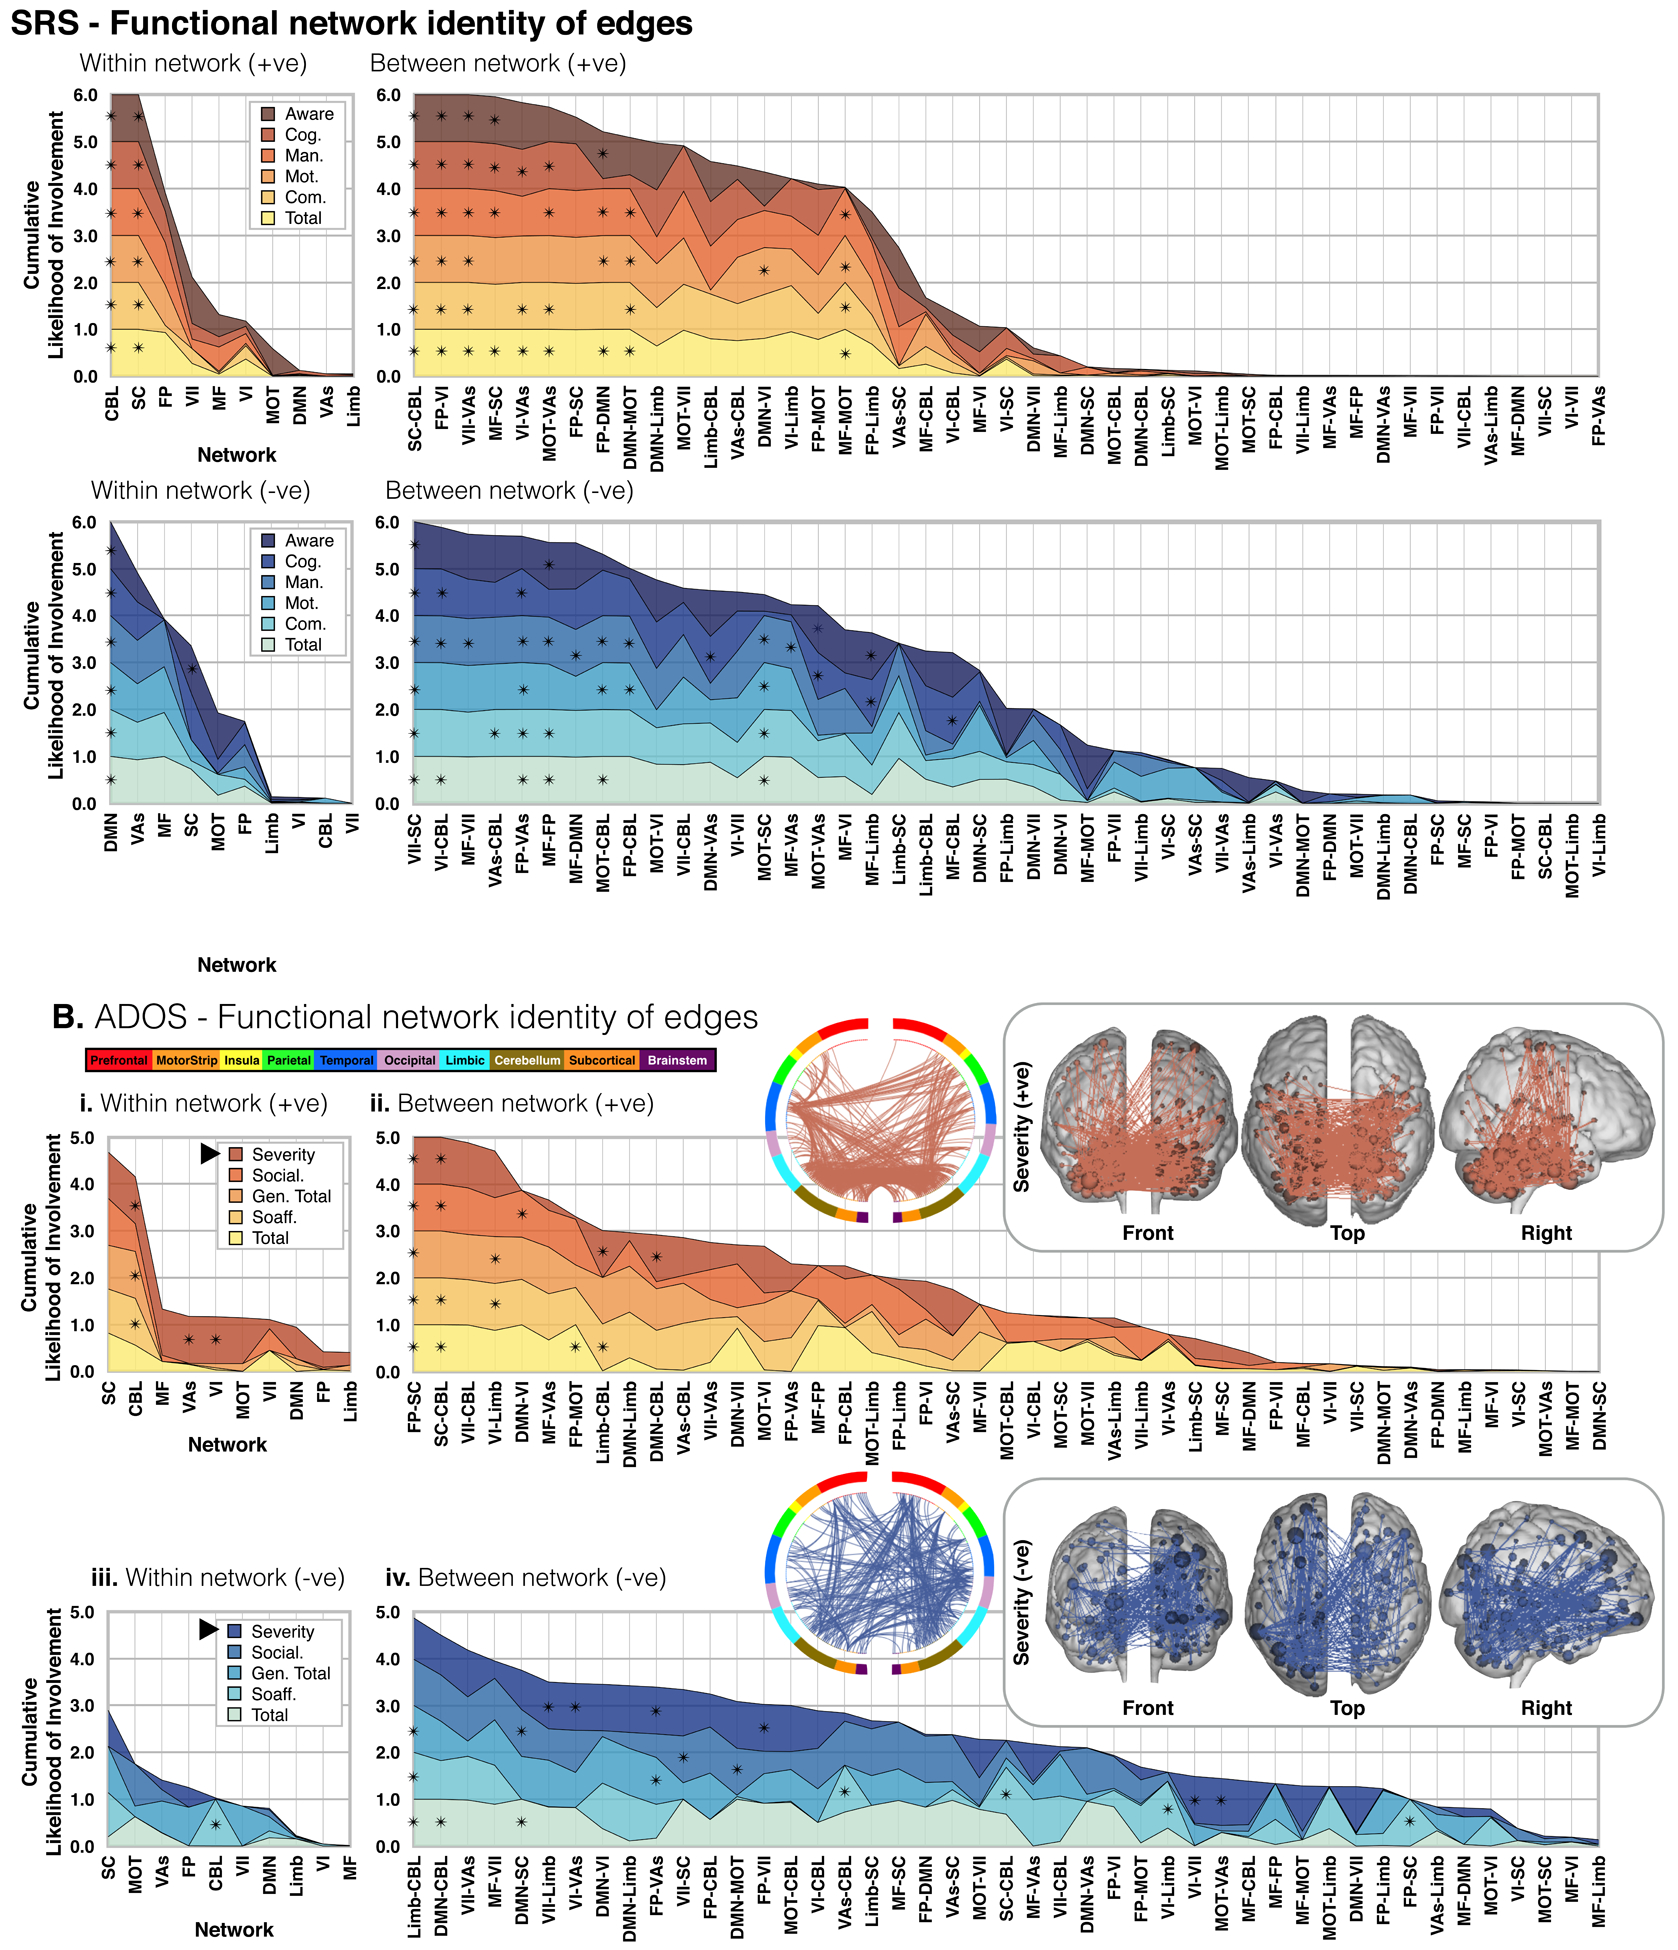
For SRS (A.) and ADOS (B.), edge overlap within (i./iii.) and between (ii./iv.) ten a priori atlas networks and our CPM networks are plotted for +ve (i./ii.) and −ve (iii./iv.) feature sets. Each layered plot shows the cumulative (sum) likelihood (1.0-Pvalue) estimated from the probability of edges being shared between a priori networks and each SRS/ADOS sub-scale network. Likelihoods greater than chance are indicated with an asterisk. Notice that in all plots, networks, and internetwork pairs, are ordered from greatest to least cumulative likelihood (i.e. the x-axis is ordered differently in each plot). Inlays show the edges of example SRS/ADOS +ve/−ve sub-scale networks as circle-plots as well as edges/nodes overlaid on glass brains.
3.4. Composite SRS/ADOS networks
As a data reduction strategy before investigating model generalizability, and to identify edges that contribute across sub-scales, ‘low’ to ‘high’ threshold, ‘composite’ networks are defined as follows: lowest - edges which appear in any sub-scale network at least once, to highest - edges which appear in all sub-scale networks. Note that this is not a threshold applied at the feature selection step, but at the level of comparing networks for cross sub-scale relevance. The anatomy of composite networks across thresholds is summarized in Supplementary Figure 7. Despite similar anatomy at the network-level between sub-scale networks, at the edge-level, there was an order of magnitude difference in the number of edges contained within composite networks at the lowest versus highest threshold [Supplementary Figure 7].
The anatomy and distribution of edge lengths (ref. below 3.5) in composite networks was similar across thresholds. The feature that distinguished edges in the low- from those in the high-threshold networks was the magnitude of the slope in the linear model relating edge strength to clinical score. Yet, composite network predictive power changed little with threshold, which is notable considering the difference in the number of edges between thresholds [Supplementary Figure 8.C.]. For all between scale comparisons (ref. below 3.6 and 3.7), composite networks were formed with edges that appeared in three or more sub-scale networks.
3.5. Edge lengths (ASD)
Motivated by controversy in the literature regarding long/short-range hyper/hypoconnectivity in ASD, we analyze the distribution of edge lengths in +/−ve sub-scale and composite networks [Supplementary Figure 8.A./B.]. None of our networks contain outliers. For networks that were not normally distributed, edges skewed towards longer lengths. For sub-scale and composite SRS networks, there was no difference in median edge length between +ve and −ve networks. On the other hand, although the difference was small (~0.5cm), −ve were longer than +ve edges in most sub-scale and composite ADOS networks. In summary, we find weak evidence of longer edges contributing more to symptom severity in ASD.
3.6. Model generalizability (ADOS vs SRS)
Model generalizability was tested within ABIDE-I/II, and across data-sets/diagnoses (ref. below 3.7). Within ABIDE-I/II, SRS composite networks were applied to individuals from ABIDE-I/II for whom ADOS, but not SRS, scores were available. Likewise, ADOS composite networks were applied to individuals with SRS but without ADOS scores. Predicted SRS scores correlated with known ADOS social affect (R=0.36, P<0.01), and generic total (R=0.29, P<0.03) scores. Likewise, predicted ADOS scores correlated with known SRS mannerisms (R=0.16, P<0.01) and cognition scores (R=0.20, P<2E-03) [Figure 5.A.]. Note, the predicted scores here are not ‘true’ SRS/ADOS scores as they are generated using composite networks.
Figure 5. Generalizability of composite networks and overlap of composite network edges: SRS and ADOS (+ve/−ve) & SRS and ADHD (+ve/−ve).

Plotted in (A.) and (B.) are correlations of predicted versus known behavior using composite networks applied across scales. All composite networks were thresholded at three. In (A.), the SRS (i.) and ADOS (ii.) composite networks were used to predict scores for individuals from ABIDE-I/II for whom only the other score was available (i.e. the SRS network was used to predict scores for individuals for whom ADOS scores (not SRS scores) were available). Composite networks were also applied across the ABIDE-I/II and ADHD-200 data sets. (B.) Predicted SRS scores correlate with known ADHD scores in individuals from the ADHD-200 data set. Layer plots showing the shared anatomy of SRS and ADOS (C.) and SRS and ADHD (D.) composite networks across thresholds. Composite network overlap of +ve and −ve feature sets was computed by taking the products: +ve/+ve (upper left, red/grey), +ve/−ve (upper right, purple/grey), −ve/+ve (lower left, purple/grey), and ve/−ve (lower right, blue/grey) of paired networks and computing the likelihood that each atlas network contribute the observed number of edges to each set of shared features.
3.7. Model generalizability (SRS/ADOS models in ADHD)
Motivated by the idea that the underlying biology of mental health disorders is not merely categorical, but rather transdiagnostic, we tested network specificity by applying our SRS/ADOS models to children with ADHD and our ADHD model to children with ASD(32, 47, 59, 60). To facilitate this comparison, we first implement the same procedures described above for ABIDE-I/II data, to predict ADHD symptoms within the ADHD-200 data set [Figure 4.A.]. Correlations between known and predicted scores were found to be significant using split-half cross-validation and permutation testing [Figure 4.B.]. As above, we also examined the anatomy of ADHD sub-scale [Figure 4.C.D.] and composite [Supplementary Figure 9.] networks.
Figure 4. Results from ADHD/TD individuals from ADHD-200 data set.

As in Figure 1.A./B., (A.) LOO cross-validation CPM results for ADHD sub-scale scores. For each sub-scale (i.-iii.) the sum of the predicted ADHD score from the +ve/−ve models are plotted against known score. As in Figure 2.A., (B.i.) Correlation (R-value) of split-half cross-validation CPMs (n=200) for each ADHD sub-scale and null results from shuffled data (n=1,000). As in Supplementary Figure 1.A., (B.ii.) correlation matrix of ADHD behavior sub-scale scores. As with SRS and ADOS, ADHD sub-scale scores are highly correlated. As in Supplementary Figure 7.A.i./B.i., (C.) shows layer plots of the cumulative number of edges versus edge length for ADHD sub-scale networks. Networks with edge lengths which are not normally distributed are denoted by a cross (☨). For all not normally distributed networks, edges are skewed towards longer lengths. None of the networks are prone to outliers. There is a difference between +ve and −ve feature set edge lengths for all sub-scale networks (P<4E-03). As in Figure 3., (D.) ADHD edge overlap within (i./iii.) and between (ii./iv.) ten a priori atlas networks and ADHD networks are plotted for +ve (i./ii.) and −ve (iii./iv.) feature sets. Inlays show the edges of example sub-scale networks as circle-plots as well as edges/nodes overlaid on glass brains.
Across neurodevelopmental disorders, predicted SRS scores correlated with known ADHD score (R=0.31/32, P<0.01) [Figure 5.B.]. This result indicates that the SRS model contains components related to attention that account for significant variance in predicting ADHD symptoms. However, in each cross-index model test (present and previous section), predictive power was worse than the model constructed with the score of interest (e.g. predicted inattention for individuals with ADHD, Figure 4 A.ii. R=0.40, is a stronger relationship than predicted ‘SRS’ score from applying the composite SRS network to individuals with ADHD, Figure 5 B.i. R=0.32).
3.8. Shared anatomy of composite networks across scales at the edge and network level
To investigate whether predictions across scales were a byproduct of common anatomy, shared features were quantified at the edge, network, and regional level. The anatomy of shared edges was estimated by taking the products of composite network pairs and computing the likelihood (1.0-Pvalue) that each of the resulting sets of shared features contain n edges from atlas-networks. These results are summarized in 2×2 matrices of layer plots for all thresholds [Figure 5.C./D.]. Shared network-level features are summarized and compared to shared edge-level features [Supplementary Figure 10]. For each composite network, the contributing atlas-networks and atlas-network pairs are listed. Common atlas-network features are indicated between composite networks, as are features implicated at the edge level. Broadly, the cerebellum contributes to SRS&ADOS (+ve), frontal-parietal to visual areas contribute to SRS&ADOS (−ve), subcortical and frontal-parietal to visual-I contributes to SRS&ADHD (+ve), and default mode contributes to SRS&ADHD (−ve). However, only SRS&ADHD (−ve) share edges that contribute significantly to both networks.
3.9. Regions of high hub-ness ASD/ADHD
Above, networks are described in terms of overlapping edges contained within and between 10 a priori atlas networks. Here, nodes with high hub-ness (i.e. with a greater number of connections to other nodes) are identified to further characterize ASD&ADHD networks. Supplementary Figures 11, 12, and 13 show surface maps of SRS, ADOS, and ADHD networks using hub-ness to illustrate nodes which play a greater role in the brain-behavior relationships we observe. Nodes with high hub-ness (>0.5) span a wide range of brain functions. At this moderate threshold, several regions are shared between ASD and ADHD [Supplementary Table 2 and 3]. However, as described above, edges do not overlap between ASD and ADHD networks. Thus, although many of the same regions are implicated when we use hub-ness to describe our findings, this is perhaps misleading because it is the connections between regions which drive the brain-behavior relationships observed here.
3.10. Replication without GSR
LOO CPM and split-half cross-validation on ADBIE-I/II and ADHD-200 data without GSR was performed [Supplementary Table 4, and Supplementary Figure 14]. Overall, our findings are unchanged, although stronger results are obtained when GSR is applied.
DISCUSSION
Using open-source data and a novel prediction framework, we find meaningful FC patterns that can independently predict clinical measures of ASD and ADHD symptom severity(48). Specifically, we build models which link brain and behavior, by identifying patterns of activity associated with clinical scores as well as cross-over between scores (ADOS and SRS) and disorders (ASD and ADHD). We find that SRS, ADOS and the ADHD-RS implicate different brain circuitry (share minimal edge overlap), yet there are components which are predictive of severity that translate across scales/disorders. The power of CPM is validated by predicting clinical scores of unseen individuals. Our models provide insight into the complex brain organization associated with ASD/ADHD, and the diffuse nature of the identified circuits helps to explain the historical difficulty of characterizing these disorders with more spatially limited approaches. The network metrics we identify map behavioral differences onto brain circuitry. Thus, the present work does not replace/replicate the utility of these tests, but instead provides a link between behavioral differences and brain functional connectivity differences.
Our results are consistent with a growing body of literature suggesting that ASD and ADHD contain partially overlapping but independent comorbidities(32, 47, 59, 60). Notably, this relationship is not a byproduct of high edge overlap: <2% of edges are shared between any network pair. In line with previous results, our predictive networks are complex and widely distributed. Thus, they are not easily described. Nevertheless, we summarize our findings using a priori functional networks and high hub-ness regions. We observe networks which have been implicated in the ASD literature: default mode, limbic, visuo-spatial, motor, subcortical, and cerebellum regions, and ADHD literature: cerebellum, subcortical to frontal-parietal, subcortical, default mode, medialfrontal, medial-frontal to limbic, motor and visual areas(2, 27–29, 61, 62). With our approach, we cannot conclude that one or a few networks ‘cause’ ASD/ADHD symptoms. Rather, we observe a convergence of functional connections that relate to a spectrum of behaviors. We assert that this is indeed a strength of the CPM approach which affords the ability to resolve more nuanced information by requiring fewer statistical tests. Furthermore, our methodology is designed to model the underlying biology of mental health disorders as a continuous spectrum not merely a categorical definition. Such models can also be transdiagnostic, as we have demonstrated(63).
Overall, few high hub-ness regions are shared between +ve/−ve ASD/ADHD networks. Within +ve networks, the thalamus and cerebellum both have high hub-ness indicating shared alterations in movement and sensation. Similarly, within −ve networks, BA10,11, and 21 show high hub-ness indicating common connectivity changes associated with changes in executive function and processing of language/semantics. On the other hand, if we consider high hub-ness collapsing across +ve/−ve networks and compare ASD (SRS and ADOS) versus ADHD, we observe more widespread patterns of connectivity alterations.
Specifically, transdiagnostically, we identify areas integral to executive function (BA9, 10, 11 and 46), and vision (BA7, and 19, primary and association vision areas). Likewise, we find representation/recognition (BA31, 40, and insula), and language/semantics (BA21, 22, 44, 47, primary auditory and cerebellum) areas which are shared between disorders. However, for this latter pair, we find additional areas within ASD networks (fusiform, BA20, 39 and 45) which could indicate more ASD-specific dysfunction. Similarly, areas important for sensation (BA 40 and thalamus) and movement (BA6,7, 8, cerebellum and thalamus) are found in ASD and ADHD. In ADHD, we identify additional areas (primary/association sensory areas, and primary motor). Finally, areas important for emotion (BA24, 31, and 38, the hippocampus and insula), processing (BA19, 21, 32, 47, and visual association), and memory (BA38, para-hippocampus and hippocampus) are identified in both networks. Furthermore, across the same three dimensions, we identify additional areas unique to ASD: emotion (amygdala), processing (BA39 and caudate), and memory (caudate). As well as areas unique to ADHD: emotion (BA23 and 25), processing (BA25 and sensory association areas), and memory (BA30). In summary, we find that ASD and ADHD share areas which are integral to a broad range of brain functions. This is not surprising given the heterogeneity and complexity of these disorders as well as the overall complexity of the human brain. Furthermore, our findings echo as well as extend previous work(9, 10, 12–14), see supplementary material.
Our results should be viewed in light of a few limitations, one of which is our strict inclusion criteria. On one hand, we include individuals on medication and both sexes in an attempt to reflect the true patient population, and because we determined clinical scores are independent of medication status and sex. Conversely, because age, FIQ, and motion are significantly correlated with clinical scores, we chose to limit these attributes to uncover connectivity features that relate only to clinical measures. Furthermore, to ensure that the features we identify are indeed specific to our metrics of interest, we built a model to predict FIQ, using the same data. We find that the underlying predictive features of the FIQ model are non-overlapping with the features predictive of SRS/ADOS scores. Importantly, this indicates that the features within the SRS/ADOS models are specific to these measures.
Another consideration is the inherent heterogeneity of publicly available data, which likely made prediction more challenging. That we find CPM works despite this challenge should be considered a strength that may have improved generalizability(64). Our models capture ~10–45% of the variance, which is in part due to the aforementioned heterogeneity. However, as we are building predictive (not explanatory) models and pooling from a large representative population, we expected modest effect sizes which are more generalizable(35, 65). Finally, it should be noted that the correlative relationships between the functional connectome and clinical scores revealed by CPM cannot be used to infer causality.
Future studies could be improved by implementing longer imaging times and harmonized scanners/protocols, to provide more reliable FC measurements(42, 66). It has also been suggested that data obtained while subjects perform a task aimed at enhancing differences in connectivity can lead to better predictive models(67, 68). Furthermore, the use of naturalistic conditions such as movie-watching can reduce motion, and tolerance of longer scan durations while enhancing individual differences(69,70).
In conclusion, the present work uses a data-driven approach to develop objective quantitative models that establish a link between FC and behavior in ASD and ADHD. We observe widespread differences in functional organization, congruent with the complex behavioral and cognitive abnormalities that are a hallmark of these disorders. We also demonstrate the generalizability and transdiagnostic utility of this approach. In the future, understanding the changes in functional organization of the brain that relate to various dimensional aspects of behavior may provide the needed inferential leverage at the individual level to inform more comprehensive treatment strategies for an individual patient and their family.
Supplementary Material
Acknowledgements
A version of some material presented here appears on bioRxiv (bioRxiv 290320; doi: https://doi.org/10.1101/290320). ABIDE-I, primary support for the work by Adriana Di Martino was provided by the NIMH (K23MH087770) and the Leon Levy Foundation. Primary support for the work by Michael P. Milham and the INDI team was provided by gifts from Joseph P. Healy and the Stavros Niarchos Foundation to the Child Mind Institute, as well as by an NIMH award to MPM (R03MH096321). ABIDE-II, primary support for the work by Adriana Di Martino and her team was provided by the National Institute of Mental Health (NIMH 5R21MH107045). Primary support for the work by Michael P. Milham and his team provided by the National Institute of Mental Health (NIMH 5R21MH107045); Nathan S. Kline Institute of Psychiatric Research). Additional Support was provided by gifts from Joseph P. Healey, Phyllis Green and Randolph Cowen to the Child Mind Institute. ADHD-200, coordinated by Michael P. Milham, M.D., Ph.D. Data collection at Peking University was supported by the following funding sources: The Commonwealth Sciences Foundation, Ministry of Health, China (200802073); The National Foundation, Ministry of Science and Technology, China (2007BAI17B03); The National Natural Sciences Foundation, China (30970802); The Funds for International Cooperation of the National Natural Science Foundation of China (81020108022); The National Natural Science Foundation of China (8100059); Open Research Fund of the State Key Laboratory of Cognitive Neuroscience and Learning.
Footnotes
Conflict of interest
The authors report no biomedical financial interests or potential conflicts of interest.
Contributor Information
Evelyn MR Lake, Department of Radiology and Biomedical Imaging, Yale School of Medicine, a. Anlyan Center, 300 Cedar St. New Haven, CT 06519, Emily S Finn, Ph.D., Section on Functional Imaging Methods, NIMH
Stephanie M Noble, Interdepartmental Neuroscience Program, Yale University.
Tamara Vanderwal, Yale Child Study Center, Yale University.
Xilin Shen, Department of Radiology and Biomedical Imaging, Yale School of Medicine
Monica D Rosenberg, Department of Psychology, Yale University
Marisa N Spann, Department of Psychiatry, College of Physicians and Surgeons, Columbia University
Marvin M Chun, Department of Psychology, Interdepartmental Neuroscience Program & Department of Neurobiology, Yale University.
Dustin Scheinost, Department of Radiology and Biomedical Imaging, Yale School of Medicine
R Todd Constable, Interdepartmental Neuroscience Program, Department of Radiology and Biomedical Imaging & Department of Neurosurgery, Yale School of Medicine, Yale University
REFERENCES
- 1.de Bildt A, Sytema S, Ketelaars C, Kraijer D, Mulder E, Volkmar F, et al. Interrelationship between autism diagnostic observation schedule-generic (ADOS-G), autism diagnostic interview-revised (ADI-R0, and the diagnostic and statistical manual of metal disorders (DSM-IV-TR) classification in children and adolescents with mental retardation. J Autism Dev Disord. 2004;34(2):129–137. [DOI] [PubMed] [Google Scholar]
- 2.Minshew NJ, Williams DL. The new neurobiology of autism: cortex, connectivity, and neuronal organization. Arch Neurol. 2007;64(7):945–950. [DOI] [PMC free article] [PubMed] [Google Scholar]
- 3.Baroni A, Castellanos FX. Neuroanatomic and Cognitive Abnormalities in Attention- Deficit/Hyperactivity Disorder in the Era of “High Definition” Neuroimaging. Curr Opin Neurobiol. 2015;30:1–8. [DOI] [PMC free article] [PubMed] [Google Scholar]
- 4.Boyle CA, Boulet S, Schieve LA, Cohen RA, Blumberg SJ, Yeargin-Allsopp M, et al. Trends in the prevalence of developmental disabilities in US children, 1997–2008. Pediatrics. 2011;127:1034–1042. [DOI] [PubMed] [Google Scholar]
- 5.Erskine HE, Ferrari AJ, Nelson P, Polanczyk GV, Flaxman AD, Vos T, et al. Research review: Epidemiological modelling of attention-deficit/hyperactivity disorder and conduct disorder for the Global Burden of Disease Study 2010. J of Child Psychol Psychiatry. 2013;54(12):1263–1274. [DOI] [PubMed] [Google Scholar]
- 6.Reiersen AM, Constantino JN, Volk HE, Todd RD. Autistic traits in a population- based ADHD twin sample. J of Child Psychol Psychiatry. 2007;48:464–472. [DOI] [PubMed] [Google Scholar]
- 7.Simonoff EMD, Pickles APD, Charman TPD, Chancler SPD, Loucas TPD, Baird GF. Psychiatric disorders in children with autism spectrum disorders: Prevalence, comorbidity, and associated factors in a population-derived sample. J Am Acad Child Adolesc Psychiatry. 2008;47:921–929. [DOI] [PubMed] [Google Scholar]
- 8.Sinzig J, Walter D, Doepfner M. Attention deficit/hyperactivity disorder in children and adolescents with autism spectrum disorder: symptom or syndrome? J Atten Disord. 2009;13(2):117–26. [DOI] [PubMed] [Google Scholar]
- 9.Ray S, Miller M, Karalunas S, Robertson C, Grayson DS, Cary RP et al. Structural and functional connectivity of human brain in autism spectrum disorders and attention-deficit/hyperactivity disorder: a rich club-organization study. Hum Brain Mapp. 2014;35(12):6032–6048. [DOI] [PMC free article] [PubMed] [Google Scholar]
- 10.Bethlehem RAI, Romero-Garcia R, Mak E, Bullmore ET, Baron-Cohen S. Structural covariance networks in children with autism or ADHD. Cereb Cortex. 2017;27(8):4267–4276. [DOI] [PMC free article] [PubMed] [Google Scholar]
- 11.American Psychiatric Association. Diagnostic and statistical manual of mental disorders. 5th ed Author; Washington, DC: 2013. www.dsm5.org [Google Scholar]
- 12.Kern JK, Geier DA, Sykes LK, Geier MR, Seth RC. Are ASD and ADHD a continuum? A comparison of pathophysiological similarities between the disorders. J Atten Disord. 2015;19(9):805–827. [DOI] [PubMed] [Google Scholar]
- 13.Kern JK, Geier DA, King PG, Sykes LK, Mehta JA, Geier MR. Shared brain connectivity issues, symptoms, and comorbidities in autism spectrum disorder, attention deficit/hyperactivity disorder, and Tourette syndrome. Brain Connect. 2015;5(6):321–335. [DOI] [PubMed] [Google Scholar]
- 14.Dougherty CC, Evans DW, Myers SM, Moore GJ, Michael AM. A comparison of structural brain imaging findings in autism spectrum disorder and attention-deficit hyperactivity disorder. Neuropsychol Rev. 2016;26(1):25–43. [DOI] [PubMed] [Google Scholar]
- 15.Zhao H, Nyholt DR. Gene-based analyses reveal novel genetic overlap and allelic heterogeneity across five major psychiatric disorders. Hum Genet. 2017;136(2):263–274. [DOI] [PubMed] [Google Scholar]
- 16.Cross-Disorder Group of the Psychiatric Genomics Consortium. Genetric relationship between five psychiatric disorders estimated from genome-wide SNPs. Nat Genet. 2013;45(9):984–994. [DOI] [PMC free article] [PubMed] [Google Scholar]
- 17.Rommelse NN, Franke B, Geurts HM, Hartman CA, Buitelaar JK. Shared heritability of attention-deficit/hyperactivity disorder and autism spectrum disorder. Our Child Adolesc Psychiatry. 2010;19(3):281–295. [DOI] [PMC free article] [PubMed] [Google Scholar]
- 18.Ogawa S, Lee TM, Kay AR, Tank DW. Brain magnetic resonance imaging with contrast dependent on blood oxygenation. Proc Natl Acad Sci USA. 1990;87(24):9868–72. [DOI] [PMC free article] [PubMed] [Google Scholar]
- 19.Biswal B, Yetkin FZ, Heughton VM, Hyde JS. Functional connectivity in the motor cortex of resting human brain using echo-planar MRI. Magn Reson Med. 1995;34(4):537–41. [DOI] [PubMed] [Google Scholar]
- 20.Biswal BB, Mennes M, Zuo XN, Gohel S, Kelly C, Smith SM, et al. Toward discovery science of human brain function. Proc Natl Acad Sci USA. 2010;107(10):4734–9. [DOI] [PMC free article] [PubMed] [Google Scholar]
- 21.Finn ES, Shen X, Scheinost D, Rosenberg MD, Huang J, Cun MM, et al. Functional connectome fingerprinting: identifying individuals using patterns of brain connectivity. Nat Neurosci. 2015;18(11):1664–1671. [DOI] [PMC free article] [PubMed] [Google Scholar]
- 22.Beaty RE, Kenett YN, Christensen AP, Rosenberg MD, Benedek M, Chen Q, et al. Robust prediction of individual creative ability from brain functional connectivity. Proc Natl Acad SCi USA. 2018;115(5):1087–1092. [DOI] [PMC free article] [PubMed] [Google Scholar]
- 23.Rosenberg MD, Finn ES, Scheinost D, Papademetris X, Shen X, Constable RT, Chun MM. A neuromarker of sustained attention from whole-brain functional connectivity. Nat Neurosci. 2016;19(1):165–7. [DOI] [PMC free article] [PubMed] [Google Scholar]
- 24.Rosenberg MD, Finn ES, Scheinost D, Constable RT, Chunn MM. Characterizing attention with predictive network models. Trends Cogn Sci. 2017;21(4):290–302. [DOI] [PMC free article] [PubMed] [Google Scholar]
- 25.Hearne LJ, Mattingley JB, Cocchi L. Functional brain networks related to individual differences in human intelligence at rest. Sci Rep. 2016;6:32328. [DOI] [PMC free article] [PubMed] [Google Scholar]
- 26.Uddin LQ, Supekar K, Menon V. Reconceptualizing functional brain connectivity in autism from a developmental perspective. Front Hum Neurosci. 2013;7:458. [DOI] [PMC free article] [PubMed] [Google Scholar]
- 27.Redcay E, Moran JM, Mavros PL, Tager-Flusberg H, Gabrieli JD, Whitfield-Gabrieli S. Intrinsic functional network organization in high-functioning adolescents with autism spectrum disorder. Front Hum Neurosci. 2013;7(573):1–11. [DOI] [PMC free article] [PubMed] [Google Scholar]
- 28.Ypma RJ, Moseley RL, Holt RJ, Rughooputh N, Floris DL, Chura LR, et al. Default Mode hypoconnectivity underlies a sex-related autism spectrum. Biol Psychiatry Cogn Neurosci Neuroimaging. 2016;1(4):364–371. [DOI] [PMC free article] [PubMed] [Google Scholar]
- 29.Cerlinani L, Mennes M, Thomas RM, Di Martino A, Thioux M, Keysers C. Increased functional connectivity between subcortical and cortical resting-state networks in autism spectrum disorder. JAMA Psychiatry. 2015;72(8):767–777. [DOI] [PMC free article] [PubMed] [Google Scholar]
- 30.Wolfers T, Buitelaar JK, Beckmann CF, Franke B, Marquand AF. From estimating activation locality to predicting disorder: A review of pattern recognition for neuroimaging-based psychiatric diagnostics. Neurosci Biobehav Rev. 2015;(57):328–349. [DOI] [PubMed] [Google Scholar]
- 31.Dos Santos Siqueira A, Biazoli Junior CE, Comfort WE, Rohde LA, Sato JR. Abnormal functional resting-state networks in ADHD: graph theory and pattern recognition analysis of fMRI data. Biomed Res Int. 2014;2014:380531. [DOI] [PMC free article] [PubMed] [Google Scholar]
- 32.Proal E, Olvera JG, White AS, Chalita PJ, Castellanos FX. Neurobiology of autism and ADHD using neuroimaging techniques: divergences and convergences. Rev Neurology. 2013;57:S163–S175. [PMC free article] [PubMed] [Google Scholar]
- 33.Chantiluke K, Christakou A, Murphy CM, Giampietro V, Daly EM, Ecker C, et al. Disorder-specific functional abnormalities during temporal discounting in youth with attention deficit hyperactivity disorder (ADHD), autism and comorbid ADHD and autism. Psychiatry Res. 2014;223(2):113–120. [DOI] [PubMed] [Google Scholar]
- 34.Rane P, Cochran D, Hodge SM, Haselgrove C, Kennedy DN, Frazier JA. Connectivity in autism: a review of MRI connectivity studies. Harv Rev Psychiatry. 2015;23(4):223–244. [DOI] [PMC free article] [PubMed] [Google Scholar]
- 35.Yarkoni T, Westfall J. Choosing prediction over explanation in psychology: Lessons from machine learning. Perspect Psychol Sci. 2017;12(6):1100–1122. [DOI] [PMC free article] [PubMed] [Google Scholar]
- 36.Rausch A, Zhang W, Beckmann CF, Buitelaar JK, Groen WB, Haak KV. Connectivity-based parcellation of the amygdala predicts social skills in adolescents with autism spectrum disorder. J Autism Dev Disord. 2018;48(2):572–582. [DOI] [PMC free article] [PubMed] [Google Scholar]
- 37.Bernhardt BC, Di Martino A, Valk SL, Wallace GL. Neuroimaging-based phenotyping of the autism spectrum. Curr Top Behav Neurosci. 2017;30:341–355. [DOI] [PubMed] [Google Scholar]
- 38.Hull JV, Jacokes ZJ, Torgerson CM, Irimia A, Van Horn JD. Resting-state functional connectivity in autism spectrum disorder: A review. Front Psychiatry. 2017;7:205. [DOI] [PMC free article] [PubMed] [Google Scholar]
- 39.Nunes AS, Peatfield N, Vakorin V, Doesburg SM. Idiosyncratic organization of cortical networks in autism spectrum disorder. Neuroimage. 2018;S1053–8119(18)30022–3. [DOI] [PubMed] [Google Scholar]
- 40.Shen X, Finn ES, Scheinost D, Rosenberg MD, Chun MM, Papademetris X, et al. Using connectome-based predictive modeling to predict individual behavior from brain connectivity. Nat Protoc. 2017;12(3):506–518. [DOI] [PMC free article] [PubMed] [Google Scholar]
- 41.Shen X, Tokoglu F, Papademetris X, Constable RT. Groupwise whole-brain parcellation from resting-state fMRI data for network node identification. Neuroimage. 2013;82:403–15. [DOI] [PMC free article] [PubMed] [Google Scholar]
- 42.Noble S, Scheinost D, Finn ES, Shen X, Papademetris X, McEwen SC, et al. Multisite reliability of MR-based functional connectivity. Neuroimage. 2017;146:959–970. [DOI] [PMC free article] [PubMed] [Google Scholar]
- 43.Di Martino A, Yan CG, Li Q, Denio E, Castellanos FX, Alaerts K, et al. The autism brain imaging data exchange: towards a large-scale evaluation of the intrinsic brain architecture in autism. Mol Psychiatry. 2014;19(6):659–67. [DOI] [PMC free article] [PubMed] [Google Scholar]
- 44.Di Martino A, O’Connor D, Chen B, Alaerts K, Anderson JS, Assaf M, et al. Enhancing studies of the connectomre in autism using the aytusm imaging data exchange II. Sci Data. 2017;4:170010. [DOI] [PMC free article] [PubMed] [Google Scholar]
- 45.Consortium TA −200. The ADHD-200 Consortium. A Model to Advance the Translational Potential of Neuroimaging in Clinical Neuroscience. Front Syst Neurosci. 2012;6:62. [DOI] [PMC free article] [PubMed] [Google Scholar]
- 46.Grzadzinski R, Dick C, Lord C, Bishop S. Parent-reported and clinician-observed autism spectrum disorder (ASD) symptoms in children with attention deficit/hyperactivity disorder (ADHD): implications for practice under DSM-5. Molecular Autism. 2016;7:7. [DOI] [PMC free article] [PubMed] [Google Scholar]
- 47.Grzadzinski R, Di Martino A, Brady E, Mairena MA, O’Neale M, Petkova E, et al. Examining autistic traits in children with ADHD: Does the Autism Spectrum Extend to ADHD? J Autism Dev Disord. 2011;41(9):1178–1191. [DOI] [PMC free article] [PubMed] [Google Scholar]
- 48.Insel T, Cuthbert B, Garvey M, Heinssen R, Pine DS, Quinn K, Sanislow C, Wang P. Research domain criteria (RDoC): toward a new classification framework for research on mental disorders. Am J Psychiatry. 2010;167(7):748–51. [DOI] [PubMed] [Google Scholar]
- 49.Scheinost D, Papademetris X, Constable RT. The impact of image smoothness on intrinsic functional connectivity and head motion confounds. Neuroimage. 2014;95:13–21. [DOI] [PMC free article] [PubMed] [Google Scholar]
- 50.Joshi A, Scheinost D, Okuda H, Belhachemi D, Murphy I, Staib LH, et al. Unified framework for development, deployment and robust testing of neuroimageing algorithms. Neuroinformatics. 2011;9(1):69–84. [DOI] [PMC free article] [PubMed] [Google Scholar]
- 51.Constantino JN, Davis SA, Todd RD, Schindler MK, Gross MM, Brophy SL, et al. Validation of a brief quantitative measure of autistic traits: comparison of the social responsiveness scale with the Autism Diagnostic Interview-Revised. J Autism Dev Disord. 2003;33(4):427–33. [DOI] [PubMed] [Google Scholar]
- 52.Lord C, Risi S, Lambrecht L, Cook EH Jr, Leventhal BL, DiLavore PC, et al. The autism diagnostic observation schedule-generic: a standard measure of social and communication deficits associated with the spectrum of autism. J Autism Dev Disord. 2000;30(3):205–23. [PubMed] [Google Scholar]
- 53.DuPaul GJ, Power TJ, Anastopoulos AD, Reid R. ADHD Rating Scale-IV: Checklists, norms, and clinical interpretation Guilford Press; New York: 1998:25. [Google Scholar]
- 54.Rubinov M, Sporns O. Complex network measures of brain connectivity: uses and interpretations. Neuroimage. 2010;52:1059–1069. [DOI] [PubMed] [Google Scholar]
- 55.Smith SM, Miller KL, Salimi-Khorshidi G, Webster M, Beckmann CF, Nichols TE et al. Network modelling methods for FMRI. Neuroimage. 2011;54(2):875–891. [DOI] [PubMed] [Google Scholar]
- 56.Wang Y, Kang J, Kemmer PB, Guo Y. An efficient and reliable statistical method for estimating functional connectivity in large scale brain networks using partial correlation. Front Neurosci. 2016;10:123. [DOI] [PMC free article] [PubMed] [Google Scholar]
- 57.Greene AS, Gao S, Scheinost D, Constable RT. Task-induced brain state manipulation improves prediction of individual traits. Nat Commun. 2018;9(1):2807. [DOI] [PMC free article] [PubMed] [Google Scholar]
- 58.Power JD, Barnes KA, Snyder AZ, Schlaggar BL, Petersen SE. Spurious but systematic correlations in functional connectivity MRI networks arise from subject motion. Neuroimage. 2012;59(3):2142–54. [DOI] [PMC free article] [PubMed] [Google Scholar]
- 59.Taurines R, Schwenck C, Westerwald E, Sachse M, Siniatchkin M, Freitag C. ADHD and autism: differential diagnosis or overlapping traits? A selective review. Atten Defic Hyperact Disord. 2012;4(3):115–39. [DOI] [PubMed] [Google Scholar]
- 60.Craig F, Margari F, Legrottaglie AR, Palumbi R, de Giambattista C, Margari L. A review of executive function deficits in autism spectrum disorder and attention-deficit.hyperactivity disorder. Neuropsychiatr Dis Treat. 2016;12:1191–202. [DOI] [PMC free article] [PubMed] [Google Scholar]
- 61.Rubia K Cognitive neuroscience of attention deficit hyperactivity disorder (ADHD) and its clinical translation. Front Hum Neurosci. 2018;12:100. [DOI] [PMC free article] [PubMed] [Google Scholar]
- 62.Cortese S, Kelly C, Chabernaud C, Proal E, Di Martino A, Milham MP, et al. Towards systems neuroscience of ADHD: A meta-analysis of 55 fMRI studies. Am J Psychiatry. 2012;169(10):1038–1055. [DOI] [PMC free article] [PubMed] [Google Scholar]
- 63.Insel TR. The NIMH research domain criteria (RDoC) project precision medicine for psychiatry. Am J Psychiatry. 2014;171(4):395–7. [DOI] [PubMed] [Google Scholar]
- 64.Orban P, Dansereau C, Desbois L, Mongeau-Pérusse V, Giguère CÉ, Nguyen, et al. Multisite generalizability of schizophrenia diagnosis classification based on functional brain connectivity. Schizophr Res. 2018;192:167–171. [DOI] [PubMed] [Google Scholar]
- 65.Cremers HR, Wager TD, Yarkoni T. The relation between statistical power and inference in fMRI. PLoS One. 2017;12(11):e0184923. [DOI] [PMC free article] [PubMed] [Google Scholar]
- 66.Noble S, Spann MN, Tokoglu F, Shen X, Constable RT, Scheinost D. Influences of the test-retest reliability of functional connectivity MRI and its relationship with behavioral utility. Cereb Cortex. 2017;27(11):5415–5429. [DOI] [PMC free article] [PubMed] [Google Scholar]
- 67.Rosenberg MD, Hsu WT, Scheinost D, Todd Constable R, Chun MM. Connectome- based models predict separable components of attention in novel individuals. J Cogn Neurosci. 2018;30(2):160–173. [DOI] [PubMed] [Google Scholar]
- 68.Finn ES, Scheinost D, Finn DM, Shen X, Papademetris X, Constable RT. Can brain state be manipulated to emphasize individual differences in functional connectivity. Neuroimage. 2017;160:140–151. [DOI] [PMC free article] [PubMed] [Google Scholar]
- 69.Vanderwal T, Kelly C, Eibott J, Mayes LC, Castellanos FX. Inscapes: a movie paradigm to improve compliance in functional magnetic resonance imaging. Neuroimage. 2015;122:222–32. [DOI] [PMC free article] [PubMed] [Google Scholar]
- 70.Vanderwal T, Eilbott J, Finn ES, Craddock RC, Turnbull A, Castellanos FX. Individual difference in functional connectivity during naturalistic viewing conditions. Neuroimage. 2017;157:521–530. [DOI] [PubMed] [Google Scholar]
Associated Data
This section collects any data citations, data availability statements, or supplementary materials included in this article.