

New developments in the program CrystalCMP are presented, and the program is tested on a large number of crystal structures extracted from the Cambridge Structural Database.
Keywords: comparisons, similarity, molecular packing, fragment selections
Abstract
This article describes new developments in the CrystalCMP software. In particular, an automatic procedure for comparison of molecular packing is presented. The key components are an automated procedure for fragment selection and the replacement of the angle calculation by root-mean-square deviation of atomic positions. The procedure was tested on a large data set taken from the Cambridge Structural Database (CSD) and the results of all the comparisons were saved as an HTML page, which is freely available on the web. The analysis of the results allowed estimation of the threshold for identification of identical packing and allowed duplicates and entries with potentially incorrect space groups to be found in the CSD.
1. Introduction
Similarity between crystal structures can be defined on the basis of various criteria, e.g. symmetry, unit-cell dimensions, composition, or position of atoms or molecules in the crystal structure. It always depends on the purpose of the comparison. Perhaps the most used and known nomenclature based on crystal structure similarities is sorting crystal structures into groups of structure types such as isopointal, isoconfigurational and homeotypic, as reported by Lima-de-Faria et al. (1990 ▸). This nomenclature is widely used for sorting inorganic compounds into similarity classes. However, its usefulness for molecular crystal structures is limited.
In recent years, several methods have been published to determine similarities of crystal structures on the basis of the similarity of atomic positions. These include methods that are based on the comparison of ‘fingerprints’ of the crystal structures (Valle & Oganov, 2010 ▸; Willighagen et al., 2005 ▸; Karfunkel et al., 1993 ▸; de Gelder et al., 2001 ▸), methods that directly compare the positions of atoms or even whole fragments in the structures (Dzyabchenko, 1994 ▸; Hundt et al., 2006 ▸; Van Eijck & Kroon, 1997 ▸; de la Flor et al., 2016 ▸; Chisholm & Motherwell, 2005 ▸), and methods that simplify the arrangements of the crystal structures to the connection rods and create structural motifs (Blatov et al., 2014 ▸). Another strategy for comparison of local atomic and molecular environments is based on the definition of a similarity kernel between local environments – the smooth overlap of atomic positions (De et al., 2016 ▸).
In the case of molecular crystals, the similarity of crystal structures can be studied via the packing similarity of molecules in a molecular cluster. There are already three approaches represented by the COMPACK (Chisholm & Motherwell, 2005 ▸), xPac (Gelbrich & Hursthouse, 2005 ▸; Gelbrich et al., 2012 ▸) and CrystalCMP (Rohlíček et al., 2016 ▸) codes. Working with a molecular cluster instead of atoms in the unit cell brings major benefits for organic crystals. In particular, by using this approach, crystal structures that have different space groups or even different crystallographic systems can be compared together. It is therefore possible to compare, for example, a triclinic crystal structure with a cubic one.
CrystalCMP’s method (Rohlíček et al., 2016 ▸) is based on the comparison of representative molecular clusters, in which only one type of molecule is included. During the comparison process, the generated molecular clusters of the individual crystal structures are overlapped according to their central molecules, and the similarity is calculated as the deviation of the centroids of the overlapping molecules and the angles of rotation of the molecules from each other. The resulting similarity is given by the relationship
where D c is the average centroid–centroid distance of overlapped molecules, A d is the average angle between overlapped molecules, and the value of w is user defined and represents the weight between D c and A d (see Fig. 1 ▸).
Figure 1.

Graphical description of the method. Left: two crystal structures are represented by two molecular clusters of seven molecules (red and blue). The light-red points represent mass centers of molecules. Right: overlaid molecular clusters according to the central molecule. D c represents the average distance of centroids of the closest molecules in red and blue clusters and A d is the average angle of rotation between them.
The weight represented by the term w can be used for adjusting the influence of the A d term on the final Psa,b value. The default weight supports the average angle difference because we believe that the similarity of molecular packing is mainly determined by molecular rotation rather than by the position of the molecules in the molecular cluster. A consequence of such a weighting is the possibility to identify similar molecular packing in two crystal structures, one of which is expanded compared with the other (either because they have been measured at different temperatures or because they crystallize with different solvent molecules of various sizes). This was confirmed in previous work on several selected data sets [see Rohlíček et al. (2016 ▸)]. However, this method required user interaction and, as a result, the software could not be used to automatically compare large quantities of data. Therefore, we have modified the algorithm so that the user interaction is no longer necessary.
2. New developments
2.1. Adding SMILES identification of atoms in the molecule
In the previous version of CrystalCMP, identical atoms were identified by using a HASH description that is based on the closest atomic connections. HASH strings were used instead of atomic labeling and allowed proper overlapping of compared molecular clusters according to the central molecule as well as calculation of the angle of rotation of related molecular pairs in the case of surrounding molecules. However, use of the HASH description has two limitations. First, it is not a standardized description of atoms in a molecule and, second, atoms of the molecule that are selected according to the several HASH strings do not necessarily create a connected fragment. This may be an advantage or a disadvantage depending on the case.
On the other hand, the SMILES description is standardized and used by many programs and scientists worldwide, and atoms selected by a proper SMILES description create a connected fragment. For that reason, SMILES support was added to CrystalCMP. We used the code implemented in OpenBabel, which is freely available (O’Boyle et al., 2011 ▸). The present usage in CrystalCMP is similar to the previous usage of HASH strings. The user has to choose the SMILES string to select several atoms in the molecule that will be used for the overlap of the molecular clusters as well as for calculation of the angle of rotation. Alternatively, the user can choose the procedure that suggests suitable SMILES strings automatically.
2.2. Modification of CrystalCMP for an automatic comparison
Until now, the developed method was semi-automatic and needed input from the user. Overlapping of representative molecular clusters was based on several chosen atoms (an atom set or AS) of the molecule whose molecular packing was going to be compared. These atoms had to be selected by the user. To make the comparison successful, the user had to choose several atoms that sufficiently represent the molecular shape. According to our experience based on several data sets, it is sufficient to choose atoms (i) that are close to the molecular center, (ii) that are not arranged in a line and (iii) that create the lowest number of combinations. The last condition is important in all cases where the AS contains equivalently identified atoms (atoms with identical HASH strings or identical in the meaning of the SMILES description, e.g. atoms in benzene rings). This usually happens when some kind of local symmetry is present in the molecule. In such cases, all possible combinations of equivalent atoms have to be tested for overlapping and for all of them Psa,b has to be calculated. ASs that create more of these combinations prolong the necessary computation time correspondingly. For that reason, an AS with as low a number of combinations as possible should be selected.
This manual selection process is still available in CrystalCMP. However, to decrease the necessary user interaction, an automatic procedure for choosing atoms for an AS was developed as well. The procedure follows the aforementioned rules – only atoms close to the molecular center are selected and one atomic set represented by the SMILES description with the lowest number of combinations is taken as the final AS.
The automatic procedure works as follows. (i) Several atoms close to the molecular center are selected (by default, it is four). These atoms create starting points for different ASs. (ii) Neighbors of each atom are then added to each AS. This step is repeated until the user-defined level is reached (the default is three). Hence, every starting atom from the first step is the central atom of each molecular fragment that creates an AS (see Fig. 2 ▸).
Figure 2.
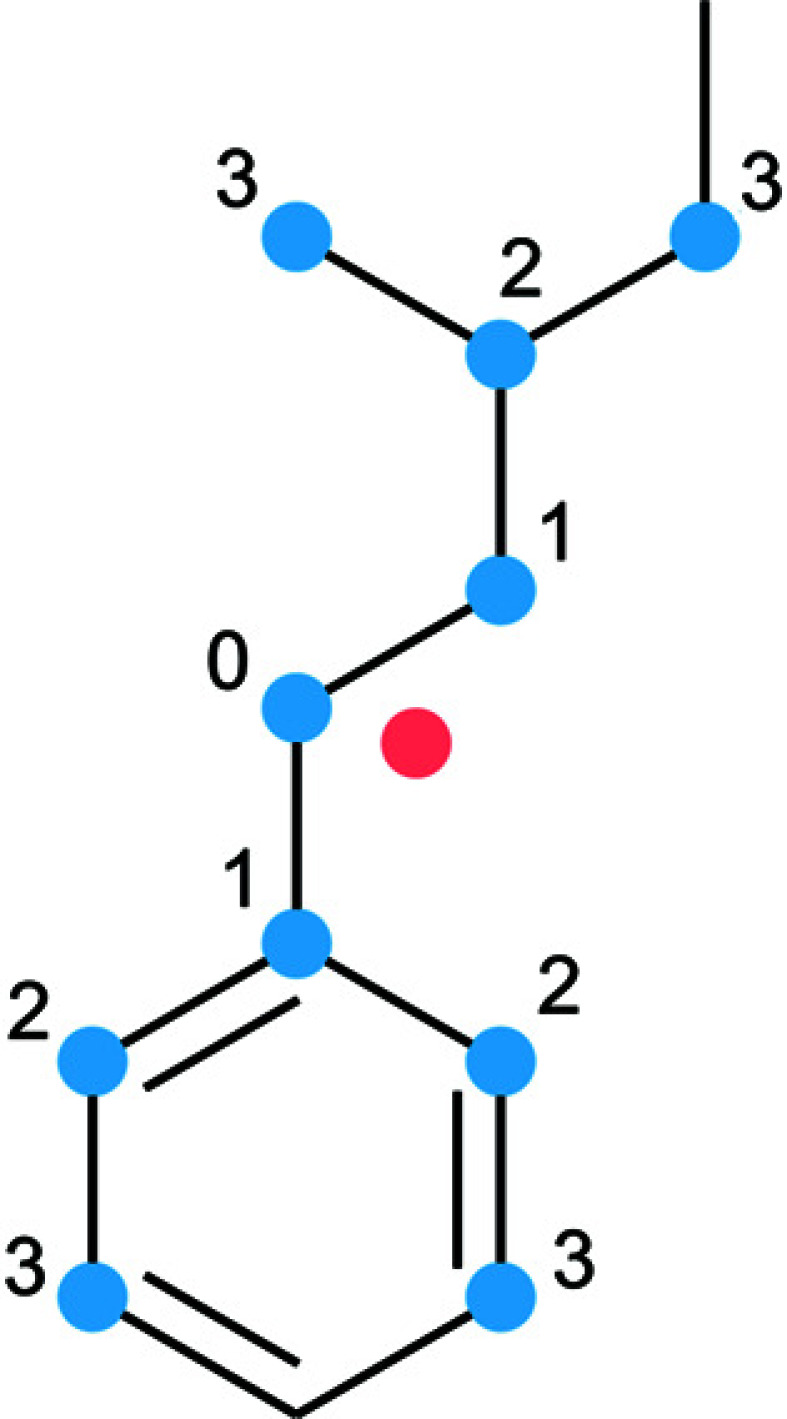
The procedure of automatic selection of the AS is demonstrated for one central atom and three levels of neighbors. The red point represents the centroid of the molecule. Blue points represent the AS. These atoms are numbered from the central atom with label ‘0’ up to the Nth level of neighbor (‘3’ in this case). At the end of the automated procedure, all of the blue atoms create one automatically selected AS.
2.3. Solving the problem of symmetrical molecules
The calculation of an angle of rotation between two molecules is a very simple task only in the case of non-symmetrical molecules or, in other words, in the case when an AS does not contain equivalent atoms and therefore creates only one possible combination for overlapping. If there are several possible combinations of an AS to overlap two molecules, all of them have to be tested. In addition, the symmetry of the molecule has to be considered when calculating the final angle of rotation between two molecules. Unfortunately, the symmetry of the molecule could be of various degrees of precision, from the perfectly symmetrical, where the molecule occupies one of the crystallographic special positions, to only symmetrical in the meaning of 2D bonding topology (a 2D molecular diagram).
Detection and evaluation of the precision of the molecular symmetry and using it for calculation of the angle of rotation, as was described previously (Rohlíček et al., 2016 ▸), was found to be problematic and unsuitable for automation. For that reason, the angle of rotation was replaced by the calculation of root-mean-square deviation (RMSD) of atomic coordinates after both concerned molecules are shifted to the same origin represented by their centroids (see Fig. 3 ▸). The RMSD of atomic coordinates is calculated between the closest atoms having identical HASH strings (having the same atomic number and the same adjacent bonded atoms). This approach is a suitable replacement for the rotation angle calculation between two molecules because the RMSD of atomic coordinates is unambiguous and smooth and it has a similar global minimum to the rotation angle between two molecules. In comparison with the rotation angle between two molecules, the angular dependence of the RMSD of atomic coordinates may have additional minima, for example in the case of 180° rotation of planar molecules. However, this property can be treated as beneficial because the RMSD of atomic coordinates reflects the similarity of atomic arrangements around that particular position of the molecule in the molecular cluster.
Figure 3.
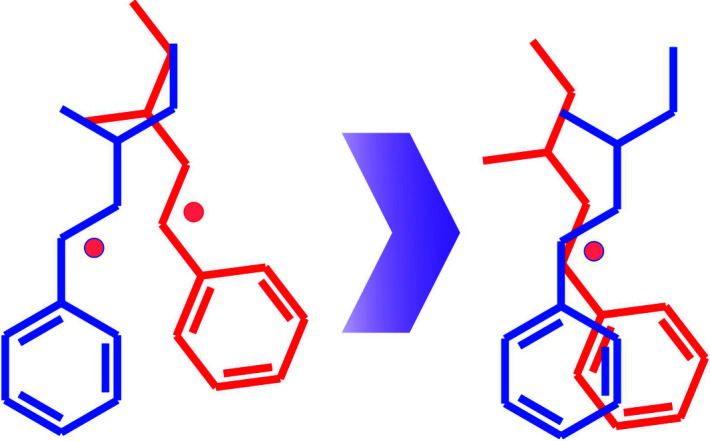
A d is calculated by moving both molecules to the same origin and then, instead of calculation of the rotation angle between them, as was described earlier by Rohlíček et al. (2016 ▸), the RMSD of atomic positions is calculated.
In such a definition, the term A d in the Psa,b equation does not necessarily refer to calculation of an angle between overlapped molecules but it may refer to any function that reflects the difference in rotation, such as RMSD of atomic positions.
2.4. Dendrogram calculation
Dendrogram calculation from a similarity matrix was already implemented in the previously published version of CrystalCMP (Rohlíček et al., 2016 ▸). However, there exist several methods for calculation of dendrograms, and they can produce quite different results for different cases. For that reason, several methods for dendrogram calculation were implemented. Once the similarity matrix is calculated, a different method for the calculation of the dendrogram can be selected. The currently supported methods are WPGMA (weighted pair group method with arithmetic mean), UPGMA (unweighted pair group method with arithmetic mean), wards, complete linkage and single linkage (Romesburg, 2004 ▸). The default method for calculation of the dendrogram is WPGMA.
3. Testing, results and discussion
The improved automated method for packing comparison needed to be tested to establish its reliability. An option would be to present the success of this method on several examples as was done in the previous article (Rohlíček et al., 2016 ▸). However, why restrict ourselves to only a handful of molecules when we could test CrystalCMP on a much larger data set? In the end, we decided to test the automated method of packing similarity calculation on the whole Cambridge Structural Database (CSD). This, as a bonus, could reveal some interesting insights about the structures in the CSD.
3.1. Testing on entries in the CSD
Data in the CSD are accessible by using the CSD Python application programming interface (API), which is distributed together with the installation of the CSD (Groom et al., 2016 ▸). We programmed a simple script to collect the entries containing identical molecules from the CSD (version 5.4, November 2018) where the molecules are the heaviest component in their crystal structures as identified by using the Molecule.heaviest_component() function of the CSD Python API, and we called these groups of entries ‘series’. We restricted the search only to crystal structures that do not contain metals. The script extracted 103 491 entries, representing 28 239 series of molecules with at least two entries. The result was saved as a text file where every line represented one series, containing CSD refcodes of the particular entries. The histogram of the collected data shows that 18 553 series contain only two entries and, on the other side, there are only eight exceptionally large series containing more than 300 entries (see Fig. 4 ▸). For such a varied data set, it was necessary to perform ∼1.95 × 10⁶ comparisons to compare the molecular packing within all series. An interesting fact is that the eight largest series are responsible for more than half of the overall number of comparisons needed (see the cumulative graph in Fig. 5 ▸).
Figure 4.

Histogram of the series of structures of the same molecules extracted from the CSD. The vertical axis is shown in logarithmic scale.
Figure 5.

Cumulative graph of the number of comparisons needed to compare molecular packing in all series, which shows the influence of all series on the final number of comparisons.
3.1.1. The largest series and their special treatment
The largest series contains 647 entries and it is based on the bis(triphenylphosphine)iminium cation. In all 647 entries, this compound is the heaviest molecule in the crystal. The eight exceptionally large series that contain more than 300 entries are summarized in Table 1 ▸.
Table 1. The largest series collected from the CSD, where the particular compounds play the role of the heaviest molecular component in the crystal structure.
| Compound name | No. of entries |
|---|---|
| Bis(triphenylphosphine)iminium cation | 647 |
| Tetrakis(pentafluorophenyl)borate anion | 639 |
| Tetraphenylphosphonium cation | 576 |
| 2,4,6-Trinitrophenol | 502 |
| Triiodide anion | 483 |
| Bis(ethylenedithiolo)tetrathiafulvalene | 448 |
| 1,4,7,10,13,16-Hexaoxacyclooctadecane | 391 |
| Tartaric acid or tartarate | 308 |
The comparison of such a large series needed special treatment to save computation time and memory. First, for series containing more than 200 entries, the smooth function calculation was disabled. This saved computational time. Second, for series containing more than 300 entries, the generation of .mol2 files with cluster overlaps was disabled. The storage of overlapped clusters for every pair of compared structures during the comparison of large series consumed an extremely large amount of memory, which resulted in the consumption of all RAM (16 GB) on the PC where the computation was made, and which led to the consequent crashing of the CrystalCMP software.
3.1.2. Automatic molecular packing comparison of all entries in every series
The comparisons were made with the default settings of the program – the inversion test was enabled, 14 surrounding molecules in the cluster were used, weighting w = 2.77 between D c and A d [see equation (1) in this work], and the use of the smooth function calculation was only allowed for series containing less than 200 entries. [w = 2.77 is currently the default value of weight and comes from the formal change in form of the Psa,b equation compared with the original article (Rohlíček et al., 2016 ▸).] The current value was obtained from w = X/180, where X = 500. The term A d was calculated by using the RMSD of the atomic positions as described in Section 2.3. Dendrograms were calculated from similarity matrices by using the WPGMA method.
The already prepared text file with extracted CSD refcodes sorted on the molecular series was used as an input for the comparison process. A Python script read the text file line by line, extracting CIFs from the database and calling the CrystalCMP software to perform the comparison of molecular packing of a specific molecule. Results in the form of dendrograms and similarity matrices were saved in the format of an HTML file, which is available online as a compressed file on the CrystalCMP download page or directly via this link: https://sourceforge.net/projects/crystalcmp/files/CSD_packing_comparison_result_html.zip/download (see also the supporting information).
The most problematic part of the comparison was a difference in the interpretation of molecular fragments in CrystalCMP and in the CSD Python API. The molecular moieties in the CSD and in CrystalCMP are sometimes determined differently. This could be caused by the different tables of atomic radii used in the two programs for calculation of bonds between atoms or by possible human post-processing and fine-tuning of data uploaded to the CSD. No matter what the cause, the different interpretations of molecular moieties led to skipping of several entries or even whole series during the calculation.
One series containing 236 structures was skipped completely because of the impossibility of automatically selecting fragments with reasonably low numbers of permutations; hence the computation process would take weeks. In addition, 1468 series, the majority of them containing just two entries, were skipped, mostly because of the already mentioned different interpretations of the molecular moieties – the targeted molecule was not found in entries by CrystalCMP. Altogether, the removed series represent 44 250 comparisons that were skipped. Moreover, some additional single entries from particular series were skipped, while the rest of the entries in the series were compared normally. This led to an additional decrease of the overall number of calculations. The final number of calculations performed was 1.79 × 10⁶.
The overall time for the comparison of the molecular packing on a common office computer (Intel Core i7-8700K, 16 GB RAM, using one core only) in all series, excluding the automatic procedure for finding the fragment to overlay and reading and saving files, was 6.92 × 10⁸ ms. This means that the average time for a single comparison was ∼387 ms including the inversion test. If we take into account the time that was used by the automatic procedure for finding the fragment to overlay, the average time for comparison increases to ∼560 ms. Including the time needed for saving .mol2 files and HTML log files increases it to the final 580 ms for one comparison including the inversion test.
3.1.3. Additional analysis of the results
Once all the series were compared and similarity matrices were saved, we tried to identify entries that represented identical crystal structures – duplicates. We set our own definition of duplicates as ‘crystal structures having identical molecular packing and the same composition’. It was intentionally set without any crystallographic restriction such as unit-cell parameters or space group. While identifying the same composition is an unambiguous task, the definition of identical molecular packing is problematic because there is no general Psa,b threshold below which the molecular packings are always identical and, at the same time, above which the molecular packings are always not identical. However, we tried to estimate such a value from the dependency of how the selected Psa,b threshold for identifying the similarity groups influenced the overall number of similarity groups in all data sets. In other words, we extracted similarity groups from similarity matrices according to different threshold values of Psa,b and we plotted them in a graph. The selected range of Psa,b values was between 0.005 and 20. The dependency of the overall number of similarity groups is shown in Fig. 6 ▸. There are two obvious breaks in the slope of the dependency – when the Psa,b value is between 0.03 and 1 and between 3 and 4. From the first break point, we distinguished the limiting value of Psa,b for identifying identical molecular packing. It is obvious from the curvature of the first break point that any selected value between 0.03 and 1 will most probably always create exceptions that will violate the threshold for identifying identical molecular packing. The interpretation of the second point is not that clear, but we suggest that it could be the limiting value above which the compared molecular clusters lose their similarity. One could say that the packing between two structures is identical up to the first break point, similar up to the second break point and dissimilar for higher values of Psa,b.
Figure 6.

Distribution of Psa,b (measure of packing similarity) among the analyzed structures from the CSD. The dependency shows how the selected Psa,b threshold for identifying similarity groups influenced the overall number of similarity groups in all data sets. The two break points at 0.1 and 3.2 were determined from intersections of extrapolated linear parts.
On the basis of Fig. 6 ▸, we set the threshold for identifying identical molecular packing as Psa,b = 0.1. With this value in mind, we were able to find the duplicates in the compared series. In our test, ∼100 000 entries have been analyzed. Out of these, 18 417 entries belong to 7887 groups of duplicates. If entries are identified as duplicates and have the same space group (space group number) or belong to the same enantiomorphic pair of space groups, we can call them redeterminations. However, when the space groups are different, we can simply identify groups of entries, where one can suspect errors in unit-cell or space-group determination for one of the entries. We found 116 such groups and we saved the report as the file suspicious.html, which can be found in the online compressed file of the packing comparison results on the CrystalCMP download page (see also the supporting information). After analyzing this file, we have realized that it also contains nine entries that were previously recognized as entries with wrongly assigned Cc space group (Marsh, 2004 ▸). However, not necessarily all the identified groups of entries contain wrongly described crystal structures. We found examples of phase transitions where the difference between the two phases, in respect of the molecular packing, is very low (Le Cointe et al., 1995 ▸; Wolf et al., 2014 ▸).
A detailed check of all 7887 series by hand was not feasible, so we cannot exclude the possibility that some entries are actually false positives (structures incorrectly identified as identical). For this reason, among others, we made our analysis results available in HTML format. We would ask all readers who discover a wrong or disputable comparison result to send feedback to rohlicek@fzu.cz. We were able to check manually only a small percentage of the results and even though we found no errors it does not mean that there are none.
4. Conclusions
In this article, we presented new developments in CrystalCMP. The improvements in the software make it a useful and user-friendly tool for comparison of molecular packing. It can be especially convenient for common daily use as well as for identification of identical structures in crystal structure databases, in the result list of crystal structure prediction processes or in the result list of the direct-space approach of the structure solution process in powder diffraction.
We tested the automatic procedure for packing comparison of molecular clusters on ∼28 000 series of organic compounds extracted from the CSD. The overall average time necessary for the comparison of two entries was 580 ms including the inversion test. The CrystalCMP software was stable during the calculation. The only problem was a high memory consumption in the case of large series (>300 entries), caused by the storage of the overlapped molecular clusters in the memory. However, this issue was solved by disabling the storage of these data in the memory for large data sets.
Additionally, we tried to find the threshold of the Psa,b value for identification of the identical molecular packing. We estimated this from the dependency of the selected Psa,b threshold values on the total number of similarity groups in all data sets. We found two break points at approximately Psa,b = 0.1 and Psa,b = 3.2, and we used the Psa,b = 0.1 threshold for identifying duplicates and incorrect entries in the CSD. It is necessary to note that the determined thresholds depend on the overall setting of the comparison algorithm, which was described above.
The CrystalCMP software is written in C/C++, uses the OpenBabel library to generate SMILES definitions, and uses wxWidgets (https://www.wxwidgets.org/) and OpenGL (https://www.opengl.org/) for the graphical interface. The program is freely distributable and can be downloaded together with its source code from this web page: http://sourceforge.net/projects/crystalcmp/.
Supplementary Material
CSD packing comparison result. DOI: 10.1107/S1600576720003787/kc5103sup1.zip
Funding Statement
This work was funded by Ministerstvo Školství, Mládeže a Tělovýchovy grant .
References
- Blatov, V. A., Shevchenko, A. P. & Proserpio, D. M. (2014). Cryst. Growth Des. 14, 3576–3586.
- Chisholm, J. A. & Motherwell, S. (2005). J. Appl. Cryst. 38, 228–231.
- De, S., Bartók, A. P., Csányi, G. & Ceriotti, M. (2016). Phys. Chem. Chem. Phys. 18, 13754–13769. [DOI] [PubMed]
- Dzyabchenko, A. V. (1994). Acta Cryst. B50, 414–425.
- Flor, G. de la, Orobengoa, D., Tasci, E., Perez-Mato, J. M. & Aroyo, M. I. (2016). J. Appl. Cryst. 49, 653–664.
- Gelbrich, T. & Hursthouse, M. B. (2005). CrystEngComm, 7, 324.
- Gelbrich, T., Threlfall, T. L. & Hursthouse, M. B. (2012). CrystEngComm, 14, 5454.
- Gelder, R. de, Wehrens, R. & Hageman, J. A. (2001). J. Comput. Chem. 22, 273–289.
- Groom, C. R., Bruno, I. J., Lightfoot, M. P. & Ward, S. C. (2016). Acta Cryst. B72, 171–179. [DOI] [PMC free article] [PubMed]
- Hundt, R., Schön, J. C. & Jansen, M. (2006). J. Appl. Cryst. 39, 6–16. [DOI] [PMC free article] [PubMed]
- Karfunkel, H. R., Rohde, B., Leusen, F. J. J., Gdanitz, R. J. & Rihs, G. (1993). J. Comput. Chem. 14, 1125–1135.
- Le Cointe, M., Lemée-Cailleau, M. H., Cailleau, H., Toudic, B., Toupet, L., Heger, G., Moussa, F., Schweiss, P., Kraft, K. H. & Karl, N. (1995). Phys. Rev. B, 51, 3374–3386. [DOI] [PubMed]
- Lima-de-Faria, J., Hellner, E., Liebau, F., Makovicky, E. & Parthé, E. (1990). Acta Cryst. A46, 1–11.
- Marsh, R. E. (2004). Acta Cryst. B60, 252–253. [DOI] [PubMed]
- O’Boyle, N. M., Banck, M., James, C. A., Morley, C., Vandermeersch, T. & Hutchison, G. R. (2011). J. Cheminformatics, 3, 33. [DOI] [PMC free article] [PubMed]
- Rohlíček, J., Skořepová, E., Babor, M. & Čejka, J. (2016). J. Appl. Cryst. 49, 2172–2183.
- Romesburg, H. C. (2004). Cluster Analysis for Researchers. Morrisville: Lulu Press.
- Valle, M. & Oganov, A. R. (2010). Acta Cryst. A66, 507–517. [DOI] [PubMed]
- Van Eijck, B. P. & Kroon, J. (1997). J. Comput. Chem. 18, 1036–1042.
- Willighagen, E. L., Wehrens, R., Verwer, P., de Gelder, R. & Buydens, L. M. C. (2005). Acta Cryst. B61, 29–36. [DOI] [PubMed]
- Wolf, H., Leusser, D., Jørgensen, M. R. V., Herbst-Irmer, R., Chen, Y. S., Scheidt, E. W., Scherer, W., Iversen, B. B. & Stalke, D. (2014). Chem. Eur. J. 20, 7048–7053. [DOI] [PubMed]
Associated Data
This section collects any data citations, data availability statements, or supplementary materials included in this article.
Supplementary Materials
CSD packing comparison result. DOI: 10.1107/S1600576720003787/kc5103sup1.zip