Abstract
A plethora of similarity-based, network-based, machine learning, docking and hybrid approaches for predicting the macromolecular targets of small molecules are available today and recognized as valuable tools for providing guidance in early drug discovery. With the increasing maturity of target prediction methods, researchers have started to explore ways to expand their scope to more challenging molecules such as structurally complex natural products and macrocyclic small molecules. In this work, we systematically explore the capacity of an alignment-based approach to identify the targets of structurally complex small molecules (including large and flexible natural products and macrocyclic compounds) based on the similarity of their 3D molecular shape to noncomplex molecules (i.e., more conventional, “drug-like”, synthetic compounds). For this analysis, query sets of 10 representative, structurally complex molecules were compiled for each of the 28 pharmaceutically relevant proteins. Subsequently, ROCS, a leading shape-based screening engine, was utilized to generate rank-ordered lists of the potential targets of the 28 × 10 queries according to the similarity of their 3D molecular shapes with those of compounds from a knowledge base of 272 640 noncomplex small molecules active on a total of 3642 different proteins. Four of the scores implemented in ROCS were explored for target ranking, with the TanimotoCombo score consistently outperforming all others. The score successfully recovered the targets of 30% and 41% of the 280 queries among the top-5 and top-20 positions, respectively. For 24 out of the 28 investigated targets (86%), the method correctly assigned the first rank (out of 3642) to the target of interest for at least one of the 10 queries. The shape-based target prediction approach showed remarkable robustness, with good success rates obtained even for compounds that are clearly distinct from any of the ligands present in the knowledge base. However, complex natural products and macrocyclic compounds proved to be challenging even with this approach, although cases of complete failure were recorded only for a small number of targets.
Introduction
The past decade has seen a boost in the development of in silico approaches for the prediction of the macromolecular targets of small molecules.1−3 Progress has been fueled by, among other factors, (i) the increasing amount of chemical and biological data available in the public domain, (ii) the strategic shift from the “one drug-one target” paradigm that had dominated small-molecule drug discovery for decades to the concept of polypharmacology,4 and (iii) advances in computational power and algorithms. Despite the rapid development, however, it is challenging to obtain a realistic understanding of the performance of target prediction methods.5
There are several classes of in silico approaches for target prediction in existence: (i) similarity-based methods, which use the similarity between data such as small molecules, targets, and interactions to make predictions,6 (ii) network-based methods, where networks based on anything from ligand similarity7 to highly heterogeneous data are built to gain systemic understanding of modeled data,8 (iii) machine learning approaches, which make use of machine learning methods such as random forests, support vector machines, or artificial neural networks to make predictions,9 (iv) reverse (or inverse) docking methods, which dock queries into potential targets to make predictions based on docking scores3 and methods which combine two or several types of these approaches.1
A large proportion of models reported in the scientific literature are available as free public web services or commercial tools.10 Most models utilize information from the largest public resources of chemical and biological data, PubChem,11 and the ChEMBL database.12 PubChem currently contains more than 102 million compounds and 268 million bioactivity data points,13 and the latest release of the ChEMBL database contains close to 2 million compounds, with more than 16 million measured activities.14
With the increasing coverage and reliability of the models, researchers have started to develop strategies for predicting the likely targets of more challenging compounds such as natural products,15,16 for which there is a notorious lack of available measured data,17 and macrocyclic compounds, characterized by a large number of conformational degrees of freedom in combination with distinct torsional angle preferences.18−20 For example, Reker et al.21 dissected the macrocyclic antitumor agent archazolid A and used pharmacophoric descriptions of these fragments to relate them to small molecules with known bioactivities. Several then unknown targets of archazolid A that were predicted by this approach have subsequently been confirmed in biological tests. More recently, Cockroft et al.16 have reported on the development of a stacked ensemble approach which, despite being trained on data for synthetic compounds, is able to predict the macromolecular targets of natural products with good accuracy.
In silico methods based on the comparison of the 3D molecular shapes of aligned molecules are predestined for use in target prediction because of their ability to recognize similarity among structurally dissimilar compounds, as long as their molecular shapes (or at least parts of their molecular shapes) are preserved. Most shape-based methods take the distribution of chemical features (“color”) into account, which contributes substantially to their performance.22 They form the basis of several target prediction approaches23−25 and are also attractive tools for virtual screening and scaffold hopping.22,26,27
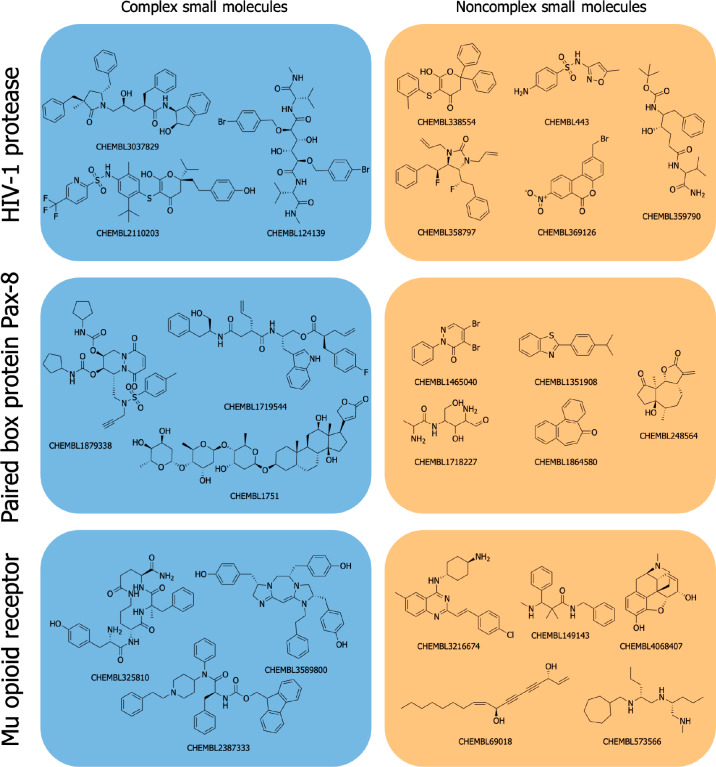
Here, we systematically investigate the capacity of a leading 3D alignment-dependent, shape-based approach to identify the macromolecular targets of structurally complex small molecules (CSMs) on the basis of their molecular similarity with non-CSMs. In the context of small-molecule drug discovery, 3D shape-based screening, and this study alike, non-CSMs are compounds that medicinal chemists would identify as typical drug-like small molecules of low structural complexity. In contrast, CSMs represent less conventional compounds, characterized, above all, by their larger size (reflected by a high number of heavy atoms and high molecular weight), and along with it, larger numbers of conformational degrees of freedom and/or higher 3D shape complexity (Figure 1). CSMs include, in particular, complex natural products and macrocyclic compounds, many of which are of high relevance to drug discovery but typically lack experimental data. Therefore, if it is found in this study that computational approaches based on 3D shape-based alignment are indeed capable of deriving the likely macromolecular targets of CSMs based on data measured for more conventional small molecules, this could open new avenues to support drug discovery efforts in less densely populated, and hence more innovative, areas of the relevant chemical space.
Figure 1.
Examples of CSMs and non-CSMs. Represented on the left are the three most diverse CSMs (used as queries in this study) identified for the HIV-1 protease, paired box protein Pax-8 and mu opioid receptor, and on the right the five most diverse non-CSMs (representing the knowledge base compounds). More details on the automated and unbiased procedure employed for selecting these example compounds are provided in the Compilation of a Test Set for Target Prediction section in the Methods section.
Methods
Extraction of High-Quality Data from ChEMBL
The ChEMBL database12,28 was processed following a protocol inspired by the work of Bosc et al.29 First, any data records matching the following criteria were extracted from ChEMBL:
-
(1)
Bioactivity record includes a molecular structure (canonical_smiles is not null).
-
(2)
Reported bioactivity is measured on a single protein or a protein complex (i.e., confidence_score 7 or 9).
-
(3)
data_validity_comment is null OR “manually validated”.
-
(4)
potential_duplicate is “0”.
-
(5)
activity_comment is not “inconclusive” OR “unspecified” (capitalization ignored).
-
(6)
standard_type is “Kd” OR “Potency” OR “AC50” OR “IC50” OR “Ki” OR “EC50”.
-
(7)
NOT (standard_value is null AND pchembl_value is null AND activity_comment is not “active” (capitalization ignored)).
-
(8)
NOT (standard_relation “>”, “ ≥ ”, or “ ≫ ” AND standard_value less than 20 000).
This procedure resulted in a total of 1 452 655 data records. A small number of these data records (2157) had concentrations applied to bioactivity measurements reported in μg·mL–1 as opposed to nM; these values were converted into nM. Next, for each compound–target pair, the median bioactivity value was calculated (because compounds may have assigned more than one bioactivity value for one and the same target). Any compounds with a median activity smaller than or equal to 10 000 nM were defined as active, and all other compounds were discarded. This resulted in a total of 481 194 molecules, corresponding to 786 817 bioactivity records.
Processing of Molecular Structures
The molecular structures extracted from ChEMBL as SMILES were imported into MOE30 (parsing failed for one molecule) and prepared using MOE’s Wash function. Processing included the removal of the minor components of salts, neutralization, and the addition of hydrogen atoms. Any molecules with a molecular weight in the range of 150 to 1500 Da were kept. The molecules were then labeled “CSM” or “non-CSM” according to the following definition (see Results for motivation and discussion of the thresholds): non-CSMs are compounds with 15 to 30 heavy atoms, whereas CSMs include all compounds with 45 to 55 heavy atoms and all macrocycles with 30 to 55 atoms. Compounds consisting of more than 55 heavy atoms were discarded, as were very small compounds (less than 15 heavy atoms) and CSMs with at least one undefined chiral atom (to ensure that stereochemistry is unambiguously defined for all queries).
Next, conformers were generated with OMEGA,31,32 a widely applied, systematic, knowledge-based conformer ensemble generator that makes extensive use of fragment libraries. OMEGA features a “default” or “classic” mode, which handles molecules with rings formed by up to nine atoms, and a macrocycle mode, which handles molecules with larger ring systems. A recent benchmark study of commercial conformer ensemble generators identified OMEGA’s classic algorithm as the best commercial tool with respect to both accuracy and speed.33 Also OMEGA’s macrocycle mode has been shown to obtain good performance on macrocycles.34
For all non-CSMs (knowledge base compounds), ensembles of a maximum of 400 conformers were calculated with OMEGA (the default value is 200 conformers). OMEGA’s classic mode was employed for all non-CSMs without any rings formed by more than nine atoms (the flipper option, which enumerates the stereochemical configurations of undefined chiral atoms, was enabled). OMEGA’s macrocycle mode was employed to generate conformer ensembles for any molecule with rings formed by more than nine atoms (in accordance with the developer’s specifications).
All CSM queries were represented by the lowest energy conformation generated with OMEGA’s classic or macrocycle modes, applying the same ring size cutoffs as for non-CSMs.
The composition of the data set resulting from this processing workflow is reported in Table 1.
Table 1. Composition of Processed Data Set.
| Number of compounds | Number of bioactivity records | Number of targets | ||
|---|---|---|---|---|
| Complex small molecules (CSMs) | macrocycles | 2780 | 4618 | 474a |
| Complex small molecules (CSMs) | nonmacrocycles | 10 870 | 16 640 | 1164a |
| Noncomplex small molecules (non-CSMs) | nonmacrocycles | 272 640 | 460 047 | 3642 |
Corresponding to a total of 1318 unique targets.
Compilation of a Test Set for Target Prediction
A test set of 28 targets was compiled by following a protocol designed to ensure that the selected proteins are diverse and representative of pharmaceutically relevant protein space. Starting from the sorted list of the 39 proteins with the highest number of CSM records in the processed data set (108– 730 CSMs per target), a diverse and representative set of proteins was selected based on the following procedure: First, for proteins for which bioactivity records are available for multiple species, only the data for the species with the largest number of CSMs was retained. Second, the protein “protease” from human immunodeficiency virus 1 (CHEMBL2366517) was removed because of the availability of a more comprehensive set of data on the protein “human immunodeficiency virus type 1 protease” (CHEMBL243). Cytochrome P450 enzymes and transporters were excluded because of their wide substrate selectivity and the fact that substrates are known to have multiple binding modes. In the final step, the remaining proteins were clustered with CD-HIT35,36 based on their full-length amino acid sequence (a sequence identity cutoff of 0.4 was employed for this procedure). For each of the clusters, only the protein with the largest number of CSMs was kept. With the 28 targets of interest now defined, in the next step, for each of the selected proteins, the 10 most diverse CSMs were determined with MOE’s function for the generation of diverse subsets (using MACCS fingerprints in combination with the Tanimoto coefficient).
Target Prediction
The 280 (28 × 10) CSMs served as queries for screening with ROCS37,38 against the knowledge base of 272 640 non-CSMs (note that the number of unique CSMs is 269 as a minority of the selected CSMs are active on more than one of the selected 28 proteins). The proteins were ranked according to the maximum similarity between a CSM query and all non-CSM ligands recorded for a protein in the knowledge base.
Molecular similarity was quantified separately by each of four similarity metrics implemented in ROCS: ShapeTanimoto, TanimotoCombo, RefTverskyCombo, and FitTverskyCombo score. As suggested by their names, metrics are either based on the Tanimoto or the Tversky coefficient. The Tanimoto coefficient quantifies the similarity of two molecules, f and g, based on their self-volume overlaps (If and Ig) and the volume overlap between the two molecules (Of,g)
The Tversky coefficient can be asymmetric (depending on the alpha and beta parameters chosen), hence allowing emphasize on either substructure or superstructure matching
The ShapeTanimoto score ranges from 0 to 1, with a value of 1 indicating a perfect fit of molecular shapes. Importantly, the ShapeTanimoto score only considers the fit of shapes for the volume overlap, whereas the three “combo” scores additionally take the type and distribution of chemical features into account. The “combo” scores typically range from 0 to 2, with equal weights applied to the shape and color components.
The RefTverskyCombo score assigns an alpha value of 0.95 to the CSM query molecule as the main self-overlap term, meaning, in the context of this study, that it emphasizes the matching of the CSM (which, by design of the data sets, is the superstructure). The FitTverskyCombo score, on the contrary, assigns a beta value of 0.95 to the fit molecule (i.e., the knowledge base molecule), emphasizing the match of the non-CSM (substructure). Note that the RefTverskyCombo and FitTverskyCombo scores can have values greater than 2 because the overlap of two compounds can be larger than a molecule’s self-overlap.
ROCS was run with factory settings with the following exceptions: both “-besthits” and “-maxhits” were set to “0” in order to cause ROCS to retain all results. The “-rankby” option was set to an appropriate value in order to have the results ranked by the four similarity metrics. For experiments using the ShapeTanimoto score, the “-shapeonly” function was enabled in order to cause ROCS to align molecules by taking only molecular shape into account (and not color). Targets assigned identical scores were also assigned identical ranks.
Results and Discussion
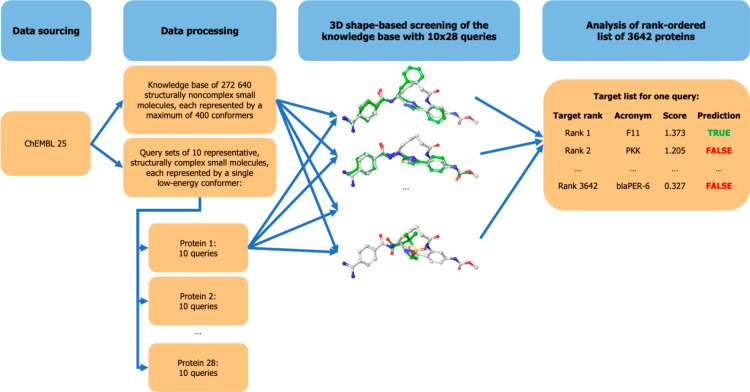
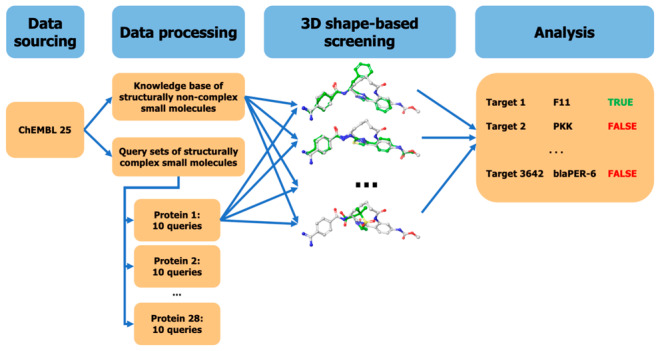
The aim of this work is to determine the capacity of 3D alignment-dependent shape-based approaches to predict the macromolecular targets of CSMs based on their similarity to non-CSMs with measured bioactivities (Figure 2).
Figure 2.
Schematic overview of the general approach.
Defining what constitutes a complex or a noncomplex molecule is a nontrivial task because molecular complexity is context dependent and its perception inherently subjective. Thus, it does not come as a surprise that there is no universally applicable and easily interpretable metric for the quantification of molecular complexity in existence.39
Our aim was to identify an effective, robust, and, importantly, easily interpretable metric. We investigated several of the many complexity metrics discussed in a recent review.39 By visual inspection of the molecular structures contained in our processed data sets, we unanimously converged on using the number of heavy atoms as a metric of structural complexity for the following reasons:
-
(1)
The number of heavy atoms correlates well with molecular weight (and molecular size), the most important parameter in drug discovery besides log P, and chemists are well familiar with it.
-
(2)
In the context of shape-based screening, the number of heavy atoms is more descriptive of molecular complexity than other common measures such as the number (or fraction) of Csp3 atoms because nonplanarity itself does not pose a particular challenge to the algorithms under investigation.
-
(3)
The aim of this study is to understand the limits of 3D shape-based approaches for target prediction, and these are, like for most other in silico approaches, defined primarily by the available data, and there are clearly more data available for conventional drug-like compounds (small “small molecules” with molecular weight below 500 Da), than there are for larger-sized compounds (Figure S1).
Hence, for the purpose of this study, non-CSMs are any compounds consisting of 15–30 heavy atoms (corresponding to an average molecular weight from 222 to 424 Da for this data set). In contrast, CSMs are compounds that are unusually large (minimum of 45 heavy atoms; corresponding to an average of 631 Da) or macrocyclic with at least 30 heavy atoms. Any compounds with more than 55 heavy atoms (corresponding to an average molecular weight of 772 Da) were not considered in this study because of the excessive size of their conformational space. The numbers of CSMs and non-CSMs present in the processed ChEMBL data set are reported in Table 1.
Twenty-eight representative and pharmaceutically relevant targets were selected for testing, each represented by the 10 most diverse bioactive CSMs (giving rise to a total of 280 CSM queries). Each of the 280 CSM queries was represented by a calculated minimum energy conformation, whereas each of the 272 640 non-CSMs of the knowledge base (with measured bioactivities on a total of 3642 proteins) was represented by up to 400 conformers representative of the low-energy conformational space.
Characterization of Data Sets Underlying the Evaluation
Targets
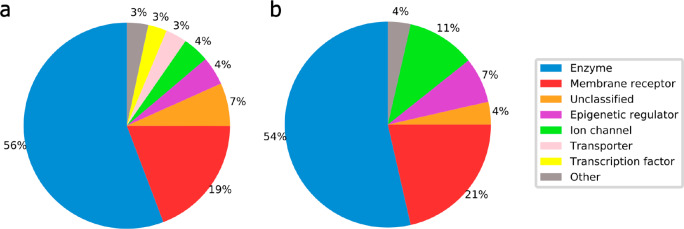
The 28 targets selected for this study (Table 2) are diverse and a good representation of the pharmaceutically relevant protein space. The pairwise identity of the full-length protein sequence of all selected targets is below 40%. Most target classes are well represented, as shown by the comparison of the target class distributions over all proteins that have at least one CSM ligand (1318 proteins) and the 28 selected targets (Figure 3). Only transporters and transcription factors are not represented. The transporters represented by a significant number of diverse CSMs in the data set bind a wide variety of substrates, in part with clearly distinct binding modes, for which reason we excluded them, as we excluded cytochrome P450 3A4 for the same reason. There are no transcription factors with sufficient numbers of CSM records that would allow their inclusion in this study.
Table 2. Overview of Targets Selected for Testing Performance of 3D Shape-Focused Target Prediction Approach.
| Target ID | Target name | Protein classification | Target abbreviation | Organism | No. CSMsa | No. non-CSMsb |
|---|---|---|---|---|---|---|
| CHEMBL243 | Human immunodeficiency virus type 1 protease | enzyme | HIV-1 protease | Human immunodeficiency virus 1 | 703 | 185 |
| CHEMBL2362980 | Paired box protein Pax-8 | unclassified | PAX8 | Homo sapiens | 390 | 465 |
| CHEMBL270 | Mu opioid receptor | membrane receptor | MOR | Rattus norvegicus | 337 | 299 |
| CHEMBL4616 | Ghrelin receptor | membrane receptor | GHSR | Homo sapiens | 299 | 127 |
| CHEMBL2001 | Purinergic receptor P2Y12 | membrane receptor | P2Y12 | Homo sapiens | 290 | 70 |
| CHEMBL4822 | Beta-secretase 1 | enzyme | BACE1 | Homo sapiens | 289 | 1634 |
| CHEMBL3717 | Hepatocyte growth factor receptor | enzyme | HGFR | Homo sapiens | 274 | 800 |
| CHEMBL3948 | Angiotensin II type 1a (AT-1a) receptor | membrane receptor | AGTR1 | Oryctolagus cuniculus | 266 | 43 |
| CHEMBL4860 | Apoptosis regulator Bcl-2 | ion channel | BCL2 | Homo sapiens | 266 | 84 |
| CHEMBL203 | Epidermal growth factor receptor erbB1 | enzyme | EGFR | Homo sapiens | 233 | 1451 |
| CHEMBL259 | Melanocortin receptor 4 | membrane receptor | MC4R | Homo sapiens | 233 | 85 |
| CHEMBL325 | Histone deacetylase 1 | epigenetic regulator | HDAC1 | Homo sapiens | 192 | 1453 |
| CHEMBL1957 | Insulin-like growth factor I receptor | enzyme | IGF1R | Homo sapiens | 177 | 514 |
| CHEMBL2820 | Coagulation factor XI | enzyme | F11 | Homo sapiens | 173 | 15 |
| CHEMBL5023 | p53-binding protein Mdm-2 | other nuclear protein | MDM2 | Homo sapiens | 156 | 183 |
| CHEMBL5658 | Prostaglandin E synthase | enzyme | PGES | Homo sapiens | 153 | 288 |
| CHEMBL5251 | Tyrosine-protein kinase BTK | enzyme | BTK | Homo sapiens | 147 | 83 |
| CHEMBL286 | Renin | enzyme | REN | Homo sapiens | 144 | 84 |
| CHEMBL4414 | Plasmepsin 2 | enzyme | PM2 | Plasmodium falciparum | 144 | 15 |
| CHEMBL220 | Acetylcholinesterase | enzyme | AChE | Homo sapiens | 130 | 1083 |
| CHEMBL2327 | Neurokinin 2 receptor | membrane receptor | NK2R | Homo sapiens | 129 | 45 |
| CHEMBL2954 | Cathepsin S | enzyme | CTSS | Homo sapiens | 123 | 424 |
| CHEMBL4662 | Proteasome Macropain subunit MB1 | enzyme | MB1 | Homo sapiens | 121 | 73 |
| CHEMBL240 | HERG | ion channel | HERG | Homo sapiens | 117 | 2260 |
| CHEMBL244 | Coagulation factor X | enzyme | F10 | Homo sapiens | 115 | 277 |
| CHEMBL3572 | Cholesteryl ester transfer protein | ion channel | CETP | Homo sapiens | 114 | 26 |
| CHEMBL1865 | Histone deacetylase 6 | epigenetic regulator | HDAC6 | Homo sapiens | 112 | 1070 |
| CHEMBL3706 | ADAM17 | enzyme | ADAM17 | Homo sapiens | 108 | 256 |
Number of ligands that are CSMs.
Number of ligands that are non-CSMs.
Figure 3.
Comparison of the distribution of target classes across (a) all (1318) proteins with at least one known CSM ligand and (b) the 28 targets selected for this study.
Complex and Noncomplex Small Molecules
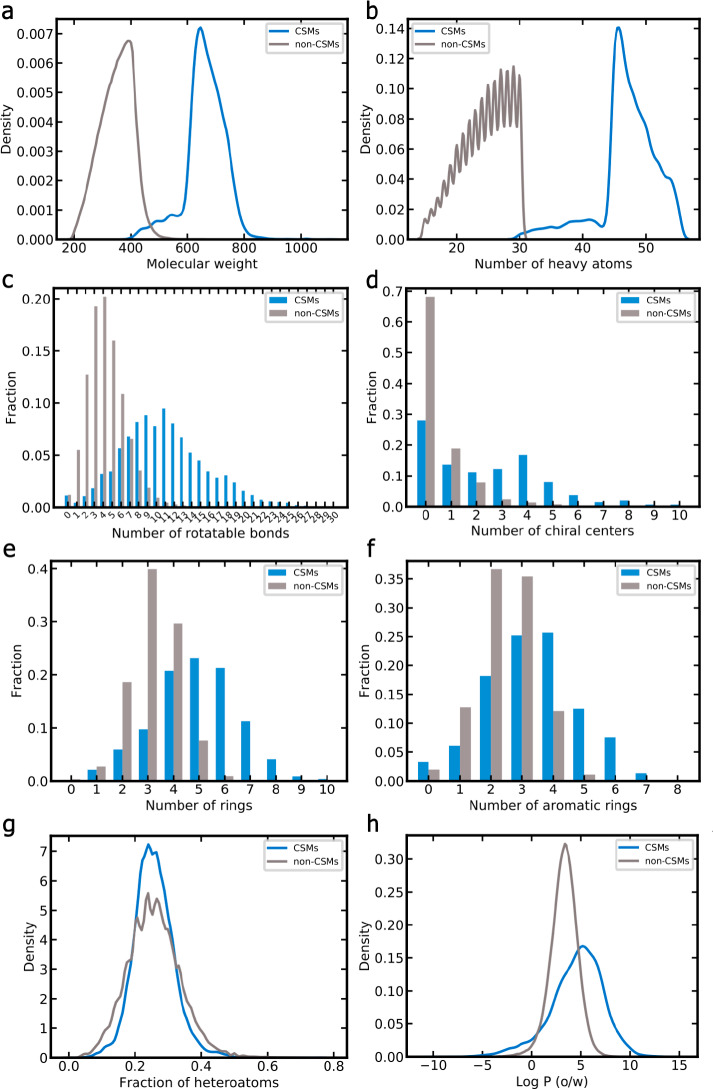
The physicochemical property spaces of the 13 650 CSMs and 272 640 non-CSMs serving as the data basis of this work are clearly distinct, as shown in Figure 4. While most CSMs in this study have a molecular weight between 550 and 800 Da (median 664 Da), most non-CSMs have a molecular weight of less than 500 Da (median 355 Da; Figure 4a). Analogous observations are made for the number of heavy atoms (Figure 4b), where the median is 47 for CSMs and 25 for non-CSMs. CSMs have a substantially higher number of rotatable bonds than non-CSMs (median 11 vs 4; Figure 4c) and also a higher number of chiral centers on average (median 2 vs 0; Figure 4d). Also the average number of rings (Figure 4e) and the number of aromatic rings (Figure 4f) are higher for CSMs (average 4.96 and 3.39, respectively) than for non-CSMs (average 3.23 and 2.46, respectively). Although the fraction of heteroatoms (Figure 4g) in CSMs and non-CSMs is comparable (median 0.25 for both classes of compounds), the log P (Figure 4h) is higher for CSMs (median 4.85 and 3.33, respectively).
Figure 4.
Comparison of the physicochemical property spaces of CSMs (blue) and non-CSMs (gray): (a) molecular weight, (b) number of heavy atoms, (c) number of rotatable bonds, (d) number of chiral centers, (e) number of rings, (f) number of aromatic rings, (g) fraction of heteroatoms, and (h) log P.
Performance of Shape-Based Screening with Different Similarity Metrics
ROCS features two different alignment modes: a default mode, which takes into account both molecular shape and color, and the shape-only mode, which considers molecular shape only. Both of these alignment modes were assessed in this study with different scores implemented in ROCS in the following setups (consistent with the underlying algorithm): (i) the default alignment mode in combination with the TanimotoCombo, RefTverskyCombo, and FitTverskyCombo scores and (ii) the ShapeTanimoto score in combination with ROCS’ shape-only mode (i.e., with the -shapeonly function enabled).
Performance Measured for Individual Complex Small Molecules
Among the four investigated scores, the TanimotoCombo score clearly outperformed all other scores in ranking the targets of CSMs among the top positions of 3642 proteins (Table 3 and Figure 5a; note for the figure that steeper curves indicate worse performance and that the y-axis is on a logarithmic scale). With the TanimotoCombo score, the target of interest (i.e., the target assigned to this particular query) was ranked among the top-5 positions for 83 (30%) of the 280 CSM queries (note that the automated query selection procedure resulted in the selection of 10 CSMs which are active on more than one of the 28 targets; accordingly, these CSMs represent more than one query). The success rate increases to 41% when considering the top-20 ranks and to 47% when considering the 40 top-ranked proteins (which corresponds to roughly 1% of the total list of proteins represented by the knowledge base).
Table 3. Success Rates for Predicting Targets of Interest of Queries with Different Scoring Functions.
| All/macrocyclic/nonmacrocyclic
complex small molecules (CSMs) [%] |
||||
|---|---|---|---|---|
| Rank | TanimotoCombo score | ShapeTanimoto score | RefTverskyCombo score | FitTverskyCombo score |
| Top-5 | 30/20/31 | 9/2/10 | 11/7/12 | 9/4/10 |
| Top-10 | 37/27/39 | 14/7/16 | 12/9/12 | 11/4/12 |
| Top-20 | 41/29/43 | 20/11/22 | 22/13/23 | 14/7/15 |
| Top-40 (∼1%) | 47/33/49 | 24/11/27 | 35/18/38 | 19/7/22 |
| Top-80 | 54/42/56 | 34/20/37 | 46/24/51 | 28/16/30 |
| Top-200 | 62/60/63 | 51/36/54 | 60/58/60 | 46/42/47 |
Figure 5.
Percentage of queries for which the target of interest (out of 3642 proteins) was assigned ranks better than or equal to the ranks indicated on the y-axis (“rank order distribution”) for (a) all queries, (b) nonmacrocyclic queries, and (c) macrocyclic queries. Note that steeper curves indicate worse performance and that the y-axis is on a logarithmic scale.
Compared to the TanimotoCombo score, the success rates obtained by the ShapeTanimoto, RefTverskyCombo, and FitTverskyCombo scores were roughly 20 percentage points lower. The RefTverskyCombo score tended to have higher success rates than the ShapeTanimoto and FitTverskyCombo scores when considering a greater number of ranks (top-40, top-80, and top-200).
In order to obtain a better understanding of the reasons for the observed differences in the target ranking performance of the individual scores, we (i) visually inspected alignments and related them to the respective score values, (ii) analyzed the relationships between scores and ranks, and (iii) determined the relationships between scores and molecular weight.
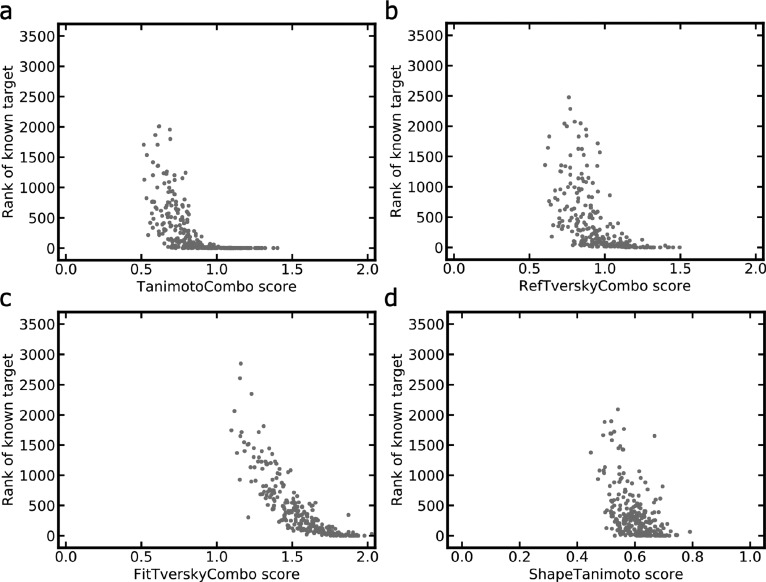
The FitTverskyCombo score emphasizes the matching of the knowledge base molecule (which is the smaller-sized molecule in this context). We found that the parametrization of the FitTverskyCombo score leads to the preference for knowledge base molecules that are particularly small in size because there is a high likelihood for these molecules to produce good matches with a part of the CSM. This preference is reflected by negative Pearson’s and Spearman’s correlation coefficients for the FitTverskyCombo score and molecular weight (−0.37 and −0.39, respectively; numbers report averages over all CSM queries). The fact that alignments of CSMs with small non-CSMs have a high likelihood of obtaining high FitTverskyCombo scores is visible from Figure 6, where it is shown that the FitTverskyCombo function indeed assigns high scores to a much larger proportion of CSMs aligned with their nearest non-CSM (Figure 6c) than any of the other scoring functions (Figure 6a, b, d). This behavior results in high false-positive prediction rates of this score in the study context, which explains the inferior performance over the TanimotoCombo score.
Figure 6.
Relationship between the (a) TanimotoCombo, (b) RefTverskyCombo, (c) FitTverskyCombo, and (d) ShapeTanimoto scores and the ranks obtained for the targets of interest of the 280 CSM queries. Note that there is one instance where the FitTverskyCombo score is greater than 2.0 (see Target Prediction section in the Methods section for an explanation).
The RefTverskyCombo score emphasizes the matching of the CSM and, consequently, has a preference for larger molecules, which is reflected by averaged Pearson’s and Spearman’s correlation coefficients of 0.43 and 0.40, respectively. Consistent with the fact that pairs of larger-sized molecules are less likely to produce good matches, the proportion of targets for which the best match is assigned a high RefTverskyCombo score value is substantially lower than for the FitTverskyCombo score (Figure 6b, c).
The reason for the superior performance of the TanimotoCombo score appears to be the fact that, as a balanced measure of molecular similarity, its ranking capacity is less affected by differences in the size of molecules. This is reflected by lower averaged Pearson’s and Spearman’s correlation coefficients between the score and molecular weight (0.39 and 0.33, respectively). Figure 6a shows that high TanimotoCombo scores generally go along with high target ranks (observed as a tail toward the bottom right corner of the plot), which is often not the case for other scores, in particular, the FitTverskyCombo and ShapeTanimoto scores.
The obvious explanation for the inferior performance of the ShapeTanimoto score over the three “combo” scores is the neglect of chemistry, which leads to a lack of specificity during alignment and scoring and, in turn, a clear preference for matches involving larger-sized non-CSMs (averaged Pearson’s and Spearman’s correlation coefficients 0.62 and 0.51, respectively). ShapeTanimoto scores are often high (Figure 7) because good overlaps of molecular shapes are likely when chemical features (color) are not considered. However, high ShapeTanimoto scores often do not correspond to high target rankings (Figure 6d), which is another indication of the lack of specificity of this score.
Figure 7.
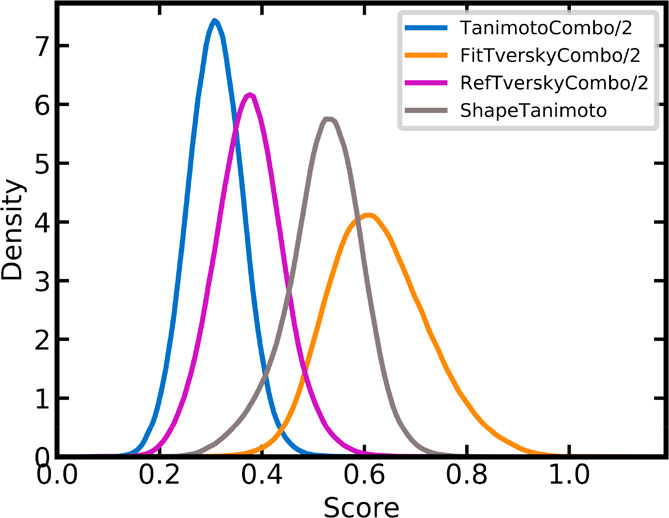
Density distributions of the four similarity metrics over all lists of scores obtained for all 280 queries. The TanimotoCombo, RefTverskyCombo, and FitTverskyCombo score values were scaled to the same range as the ShapeTanimoto score.
Further conclusions that can be derived from these analyses are that values obtained with different scores should not be directly compared. Moreover, the scores obtained for individual query–target combinations should not be used as a measure of the likelihood of a compound to be active on that target. In other words, the predictions provide an indication of the likelihood of a protein being a target only relative to all other possible targets.
Performance Measured on a Per-Target Basis
A further way of analyzing success rates is on a per-target basis, evaluating the results for query sets (the 10 queries) rather than individual queries. For 24 of the 28 targets (86%), the TanimotoCombo score assigned the top rank to the target of interest for at least one of the 10 queries (Figure 8). For the ShapeTanimoto, RefTverskyCombo, and FitTverskyCombo scores, this was only the case for 43%, 57%, and 29% of the 28 proteins, respectively. Additional details are provided in Table 4.
Figure 8.
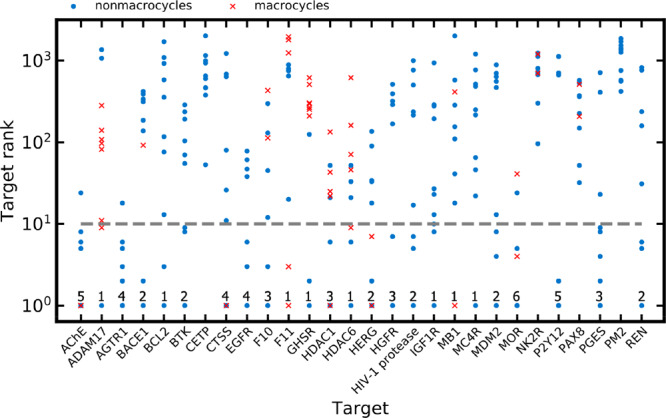
Ranks assigned with the TanimotoCombo score to the target of interest for the 280 CSM queries. Note that the y-axis is on a logarithmic scale. The numbers reported at the bottom of the graph indicate the number of CSM queries for which the target of interest was assigned the rank of 1 (indicating perfect prediction); the dashed line indicates the rank of 10.
Table 4. Best and Median Target Ranks Obtained by Different Scores for Query Sets Consisting of 10 CSMs Each.
| Target
rank with score |
||||||||
|---|---|---|---|---|---|---|---|---|
| TanimotoCombo |
RefTverskyCombo |
FitTverskyCombo |
ShapeTanimoto |
|||||
| Proteina | best | median | best | median | best | median | best | median |
| HIV-1 protease | 1.0 | 116.0 | 1.0 | 135.0 | 2.0 | 381.5 | 7.0 | 356.0 |
| PAX8 | 32.0 | 294.0 | 83.0 | 315.0 | 80.0 | 216.0 | 126.0 | 253.0 |
| MOR | 1.0 | 1.0 | 16.0 | 19.5 | 12.0 | 88.0 | 1.0 | 34.0 |
| GHSR | 1.0 | 260.0 | 1.0 | 213.5 | 11.0 | 794.0 | 4.0 | 349.0 |
| P2Y12 | 1.0 | 1.5 | 1.0 | 24.0 | 1.0 | 67.0 | 1.0 | 185.5 |
| BACE1 | 1.0 | 162.0 | 16.0 | 320.0 | 32.0 | 304.5 | 54.0 | 197.0 |
| HGFR | 1.0 | 87.5 | 1.0 | 84.5 | 6.0 | 162.5 | 1.0 | 59.0 |
| AGTR1 | 1.0 | 2.0 | 1.0 | 2.0 | 3.0 | 89.5 | 2.0 | 20.5 |
| BCL2 | 1.0 | 236.5 | 16.0 | 188.5 | 153.0 | 705.0 | 1.0 | 280.5 |
| EGFR | 1.0 | 4.5 | 1.0 | 18.0 | 1.0 | 69.5 | 1.0 | 59.0 |
| MC4R | 1.0 | 233.0 | 28.0 | 475.5 | 25.0 | 274.0 | 1.0 | 289.5 |
| HDAC1 | 1.0 | 21.5 | 1.0 | 63.0 | 1.0 | 96.0 | 1.0 | 78.5 |
| IGF1R | 1.0 | 25.0 | 1.0 | 29.0 | 1.0 | 310.0 | 1.0 | 126.5 |
| F11 | 1.0 | 774.0 | 1.0 | 901.0 | 139.0 | 1765.0 | 1.0 | 462.5 |
| MDM2 | 1.0 | 240.5 | 2.0 | 326.0 | 3.0 | 235.0 | 1.0 | 143.5 |
| PGES | 1.0 | 6.0 | 1.0 | 41.0 | 3.0 | 285.5 | 8.0 | 96.0 |
| BTK | 1.0 | 62.5 | 1.0 | 59.0 | 1.0 | 652.0 | 1.0 | 200.0 |
| REN | 1.0 | 95.0 | 1.0 | 187.0 | 1.0 | 673.5 | 161.0 | 599.0 |
| PM2 | 420.0 | 1308.5 | 534.0 | 1257.0 | 636.0 | 1225.0 | 440.0 | 1452.0 |
| AChE | 1.0 | 3.0 | 1.0 | 47.5 | 1.0 | 29.5 | 17.0 | 41.0 |
| NK2R | 96.0 | 712.0 | 305.0 | 908.5 | 83.0 | 372.5 | 287.0 | 921.5 |
| CTSS | 1.0 | 18.5 | 1.0 | 64.0 | 1.0 | 88.0 | 4.0 | 99.0 |
| MB1 | 1.0 | 132.5 | 8.0 | 116.5 | 17.0 | 136.0 | 5.0 | 529.5 |
| HERG | 1.0 | 12.5 | 1.0 | 49.0 | 28.0 | 81.5 | 13.0 | 62.0 |
| F10 | 1.0 | 28.5 | 16.0 | 74.5 | 10.0 | 420.5 | 1.0 | 58.5 |
| CETP | 53.0 | 625.0 | 1063.0 | 1772.0 | 93.0 | 443.5 | 6.0 | 484.0 |
| HDAC6 | 1.0 | 39.5 | 16.0 | 84.5.0 | 5.0 | 89.5 | 11.0 | 166.0 |
| ADAM17 | 1.0 | 102.5 | 1.0 | 141.0 | 4.0 | 229.0 | 2.0 | 222.0 |
Only for four out of 28 targets, the TanimotoCombo score failed to rank the target of interest among the top-10 positions with any of the 10 queries: the paired box protein Pax-8 (Homo sapiens), plasmepsin 2 (Plasmodium falciparum), neurokinin 2 receptor (Homo sapiens), and cholesteryl ester transfer protein (Homo sapiens).
For the paired box protein Pax-8, the highest rank obtained with any of the 10 queries was 32 (TanimotoCombo score). One of the reasons for failure is the fact that most of the CSMs active on this target are very different from the bioactive non-CSMs in terms of chemistry. They are characterized by long and flexible scaffolds; a minority are macrocyclic (indicated in Figure 8).
In the case of plasmepsin 2, the best rank obtained was just 420 (TanimotoCombo score). This target is characterized by a highly flexible ligand binding site to which small molecules are known to bind in several distinct modes.40 The fact that there were only 15 non-CSMs recorded for that target may contribute to the difficulties in recognizing CSMs active on this protein (note, however, that coagulation factor XI was correctly identified as the target of two out of the 10 CSMs and ranked among the top-3 positions even though the target is represented by only 15 non-CSMs in the knowledge base).
For the neurokinin 2 receptor, the best rank obtained with any of the 10 CSMs was 96 (TanimotoCombo score). The reasons for failure appear to be similar to those for Pax-8. Most of the CSMs have a substantial number of rotatable bonds; a minority are macrocyclic.
For the cholesteryl ester transfer protein, the best rank obtained with any of the 10 CSMs was 53 (TanimotoCombo score). The CSM queries of the cholesteryl ester transfer protein are characterized by three to four similarly sized branches originating from a central carbon or nitrogen atom. The structures of most CSM queries are clearly distinct from those of the ligands represented in the knowledge base.
Overall, the results obtained on a per-target basis indicate that the value of the method can be substantially higher in cases where several compounds targeting the same protein are explored, although this scenario is rare in the context of CSMs (as opposed to conventional drug-like compounds). A further conclusion (derived from the results presented in Figure 8) is that there is no correlation between the success rates for a target and the number of non-CSM representing that target in the knowledge base.
Performance on Macrocyclic as Compared to Nonmacrocyclic Complex Small Molecules
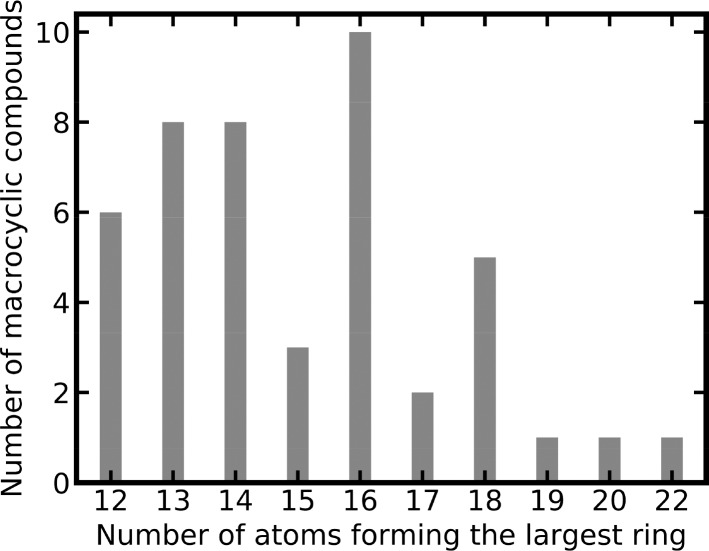
Forty-five of the 280 CSMs are macrocyclic, covering 14 out of the 28 targets studied in this work. The ring systems of the 45 macrocyclic CSMs are formed by up to 22 atoms, with a median of 15 atoms (Figure 9).
Figure 9.
Size of largest ring systems of 45 macrocyclic CSMs.
Our results show that the task of target prediction is more challenging for macrocyclic compounds than for nonmacrocyclic ones (Figure 5b, c). For the TanimotoCombo score, the top-5, top-10, top-20, and top-40 success rates for nonmacrocyclic CSMs were 31%, 39%, 43%, and 49%, respectively, whereas for macrocyclic CSMs, they were just 20%, 27%, 29%, and 33%, respectively. Besides the low molecular similarity of macrocyclic compounds with the non-CSMs of the knowledge base, a major reason for the lower success rates observed for macrocyclic compounds are the complexities involved in representing the 3D conformations of these queries, related to a high number of conformational degrees of freedom and torsional properties that are distinct from nonmacrocyclic compounds.
Cases Where at Least One Score Worked Well While Others Failed
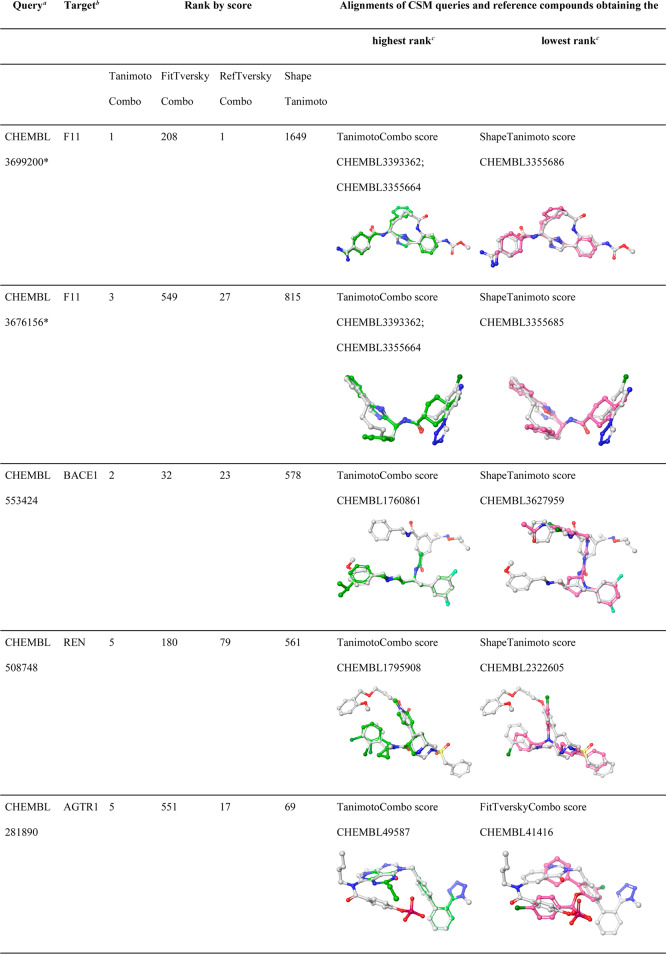
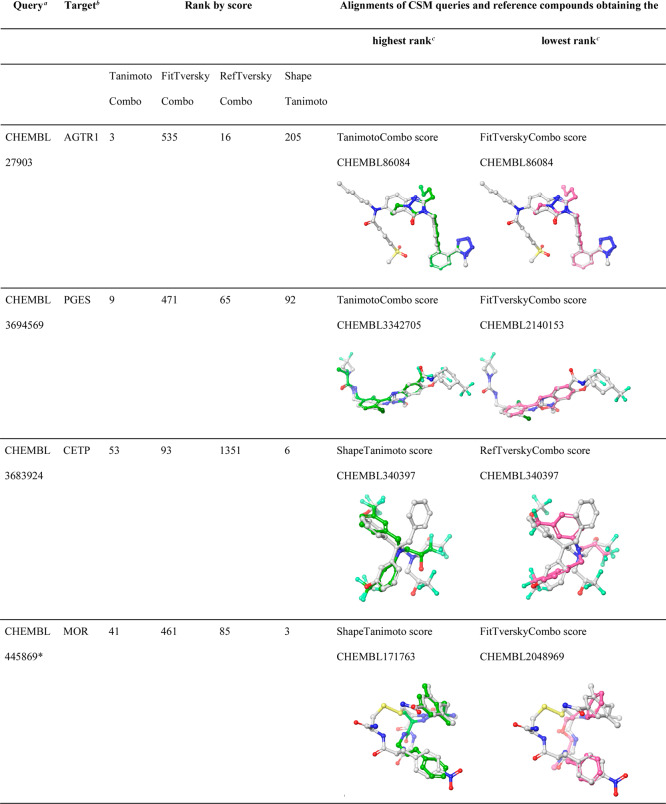
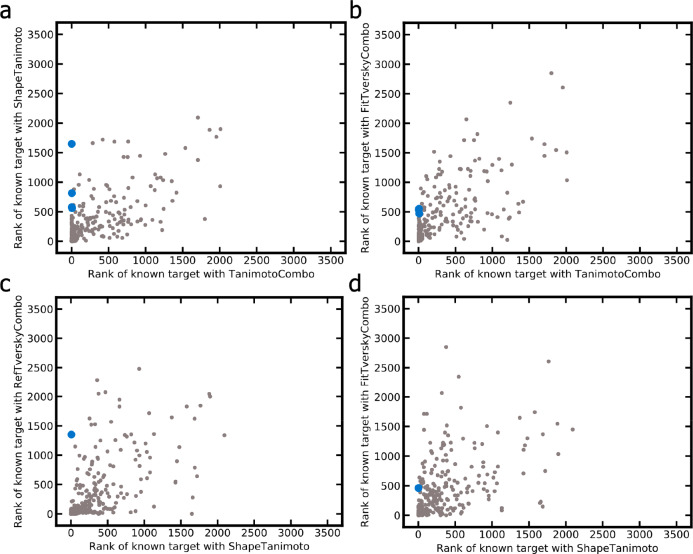
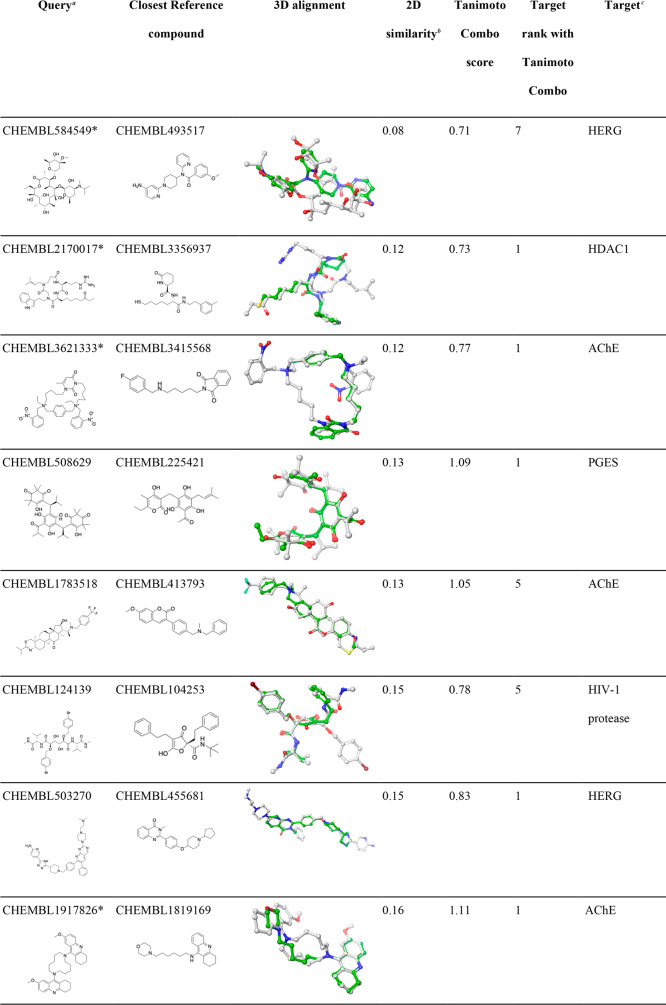
There are several examples of CSMs for which their targets were ranked at high positions with one score while other scores failed. We identified nine CSMs (three of them being macrocyclic compounds) for which their targets were assigned ranks of 10 or better by at least one score while other score(s) assigned ranks of 450 or worse (Table 5). In seven out of the nine cases, the TanimotoCombo score performed well, while others failed (Figure 10a, b); in two cases the ShapeTanimoto score outperformed the other scores (Figure 10c, d). For the examples reported in Table 5, it can be seen that the alignments produced by the three “combo” scores are generally more consistent in terms of chemistry (in particular, with regard to the orientation of chemical features) than the alignments produced by the ShapeTanimoto score. However, the FitTverskyCombo score failed to identify the target of interest for many CSMs due to its emphasis on matching the knowledge base molecule (substructure; see Performance of Shape-Based Screening with Different Similarity Metrics section in the Results section). In contrast, the ShapeTanimoto score often failed because of its disregard of chemistry, which is reflected by alignments that lack the matching of chemical features.
Table 5. Examples of CSMs for Which Their Targets Were Successfully Identified by One at Least One Score While Others Failed.
Queries marked with a “∗” are macrocyclic compounds.
F11, coagulation factor XI; BACE1, beta-secretase 1; REN, renin; AGTR1, angiotensin II type 1a (AT-1a) receptor; PGES, prostaglandin E synthase; CETP, cholesteryl ester transfer protein; MOR, mu opioid receptor.
ChEMBL IDs reported are those that obtained the highest/lowest rank for the target of interest of the individual CSM queries, according to the scoring function indicated in the respective table cells. Alignments shown are those that obtained the highest rank for a CSM query. In cases where multiple alignments obtained identical scores (and ranks), only one alignment is shown.
Figure 10.
Ranks assigned to the targets of interest of the 280 CSM queries by the (a) TanimotoCombo vs ShapeTanimoto scores, (b) TanimotoCombo vs FitTverskyCombo scores, (c) ShapeTanimoto vs RefTverskyCombo scores, and (d) ShapeTanimoto vs FitTverskyCombo scores. The nine compounds for which one score produced good results while others failed are highlighted in blue.
Performance as a Function of Molecular Similarity
The performance of similarity-based approaches depends on how well the query is represented by the data stored in the knowledge base. In the context of this study, one of the simplest measures of the molecular similarity is the difference in the number of heavy atoms between the CSM query and the nearest non-CSM ligand. Figure 11a and b shows that the success rates of the method are largely unaffected by the differences in the number of heavy atoms over the observed range. The compatibility of chemical features seems to play a much more important role than pure differences in molecular size. This is confirmed when using the Tanimoto coefficient derived from 2D Morgan2 fingerprints as a measure of molecular similarity. As shown in Figure 11c, ROCS (in combination with the TanimotoCombo score) ranked 43% of all CSMs with a maximum Tanimoto coefficient between 0.2 and 0.3 among the top-10 positions and 73% of all CSMs with a coefficient between 0.3 and 0.4. This robustness is remarkable, as molecular structures with a Morgan2 fingerprint-based Tanimoto coefficient below 0.4 are clearly distinct in most cases. Importantly, it is likely that compounds with such a low degree of molecular similarity have different binding modes, which is beyond the reach of any ligand-based approach.
Figure 11.
Success rates (i.e., fraction of CSM queries for which the target of interest was ranked among the top-k positions) and how they are influenced by the structural relationship between the query CSM and the nearest ligand (non-CSM) recorded in the knowledge base: (a) success rates of the TanimotoCombo score as a function of the difference of molecular size (quantified as number of heavy atoms, separated into bins of size 5), (b) success rates of the RefTverskyCombo score as a function of the difference of molecular size (separated into bins of size 5), and (c) success rates of the TanimotoCombo score as a function of the 2D molecular similarity quantified as Tanimoto coefficient based on Morgan2 fingerprints (separated into bins of size 0.1. Note that in panel (c) success rates for queries with a Tanimoto coefficient greater than 0.7 are not reported because of the limited number of examples. The trends observed in panel (c) are consistent with those observed when using atom type fingerprints instead of Morgan2 fingerprints to quantify 2D molecular similarity and also when using the Tversky coefficient (α = 0.95) instead of the Tanimoto coefficient (data not shown).
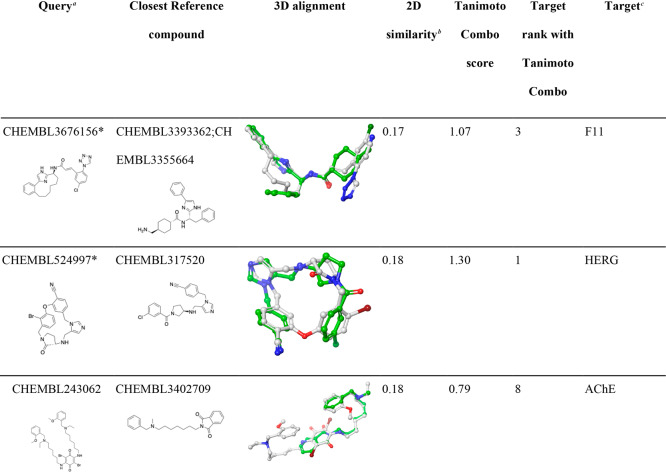
Among the 280 queries investigated in this work, we identified 11 compounds (six of them are macrocyclic compounds) for which their target was ranked within the top-10 positions out of 3642 targets, despite being structurally extremely dissimilar from any ligands (non-CSMs) recorded in the knowledge base (Tanimoto coefficients lower than 0.18). As shown in Table 6, most of the alignments produced by ROCS for the 11 compounds are not only plausible and sensible from a chemistry point of view but also visually easily interpretable thanks to the hard Gaussians used by ROCS for chemical features (color), which cause a lock-in of the alignment on hydrogen bond donors and acceptors.
Table 6. Examples of CSMs for Which Their Targets Were Successfully Identified Despite Being Dissimilar from Any Reference Compound.
Queries marked with a “∗” are macrocyclic compounds.
2D molecular similarity between the CSM query and the closest ligand recorded in the knowledge base (measured as Tanimoto coefficient based on Morgan2 fingerprints).
HDAC1, histone deacetylase 1; AChE, acetylcholinesterase; PGES, prostaglandin E synthase; HIV-1 protease, human immunodeficiency virus type 1 protease; F11, coagulation factor XI.
We did not observe any cases of CSMs for which their targets were not ranked early in the hit list and at least one known ligand shared a high degree of 2D similarity with the query (note that the number of CSMs in this category was small).
Performance as a Function of Common Substructures
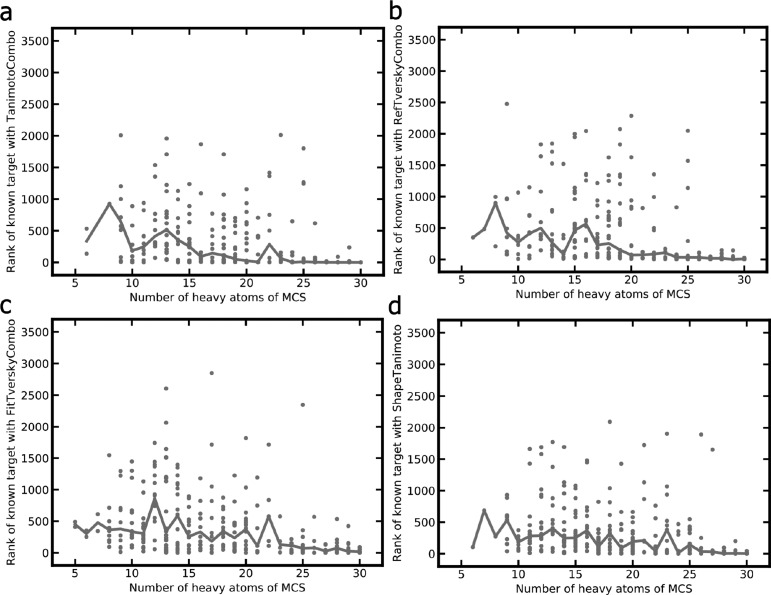
Target rankings are expected to improve with the size of the maximum common substructure (MCS) shared between the CSM query and the closest related non-CSM in the knowledge base (as determined by ROCS). The results presented in Figure 12 confirm this assumption: For the TanimotoCombo score, the median ranking of the targets of interest was 3.5 for CSMs sharing an MCS of at least 20 heavy atoms with the closest ligand (non-CSM) recorded in the knowledge base, whereas the median target rank was just 111.5 for CSMs with an MCS of 15 to 19 heavy atoms. The median target ranks obtained by the RefTverskyCombo, FitTverskyCombo, and ShapeTanimoto scores were substantially lower (worse): 28, 80, and 43 for CSMs sharing an MCS of a least 20 heavy atoms, respectively, and 318, 299, and 227 for CSMs with an MCS of 15 to 19 heavy atoms, respectively. We repeated this analysis using the percentage of heavy atoms rather than absolute numbers covered by the MCSs and observed the same trends (data not shown).
Figure 12.
Ranks obtained for the targets of interest as a function of the size of the MCS shared between the CSM queries and most similar ligand (non-CSM) recorded for the respective target for the (a) TanimotoCombo, (b) RefTverskyCombo, (c) FitTverskyCombo, and (d) ShapeTanimoto scores. The lines are merely a guide for the eye and indicate the median values of the target rankings in relation to the size of the MCS.
Performance on Natural Products
By overlapping the queries with a data set of 201 761 natural products compiled as part of the work reported in ref (41), we determined that at least six out of the 269 (unique) CSMs are natural products (which is a surprisingly low portion of natural products). We employed NP-Scout41 to identify additional CSMs that likely are natural products or natural product-like. NP-Scout is a random forest classifier discriminating between natural products and synthetic molecules. The model is trained on 108 393 natural products and 157 162 synthetic molecules represented by MACCS keys. The model yielded an AUC of 0.997 and Matthews correlation coefficient of 0.960 during tests with external data. NP-Scout identified an additional 20 CSMs with a high likelihood (probability >0.70) of being natural products.
The 26 natural products and natural product-like compounds cover a total of 18 different targets; eight of the queries are macrocyclic. Using the TanimotoCombo score, ROCS ranked the targets of interest of the natural products among the top-10 positions for only seven out of 31 queries (23%; the 31 queries result from the 26 unique natural products and natural product-like compounds). This success rate is considerably lower than the ones averaged over all 280 queries (37%), all 245 nonmacrocyclic queries (39%), and all macrocyclic queries (27%), indicating that the prediction of the targets of complex natural products is more challenging than of complex synthetic molecules. A main reason for the low prediction success rates is the fact that the similarity of complex natural products and natural product-like compounds and the nearest non-CSMs of the knowledge base is generally low: The median Tanimoto coefficient based on Morgan2 fingerprints for these types of CSMs and the non-CSMs of the knowledge based is only 0.13, whereas it is 0.21 for the other CSMs and their closest non-CSMs).
Runtimes
The ROCS screening process takes less than 6 h per CSM query on a single core of an i5-4590 CPU at 3.30 GHz. Runtimes are therefore expected not to pose a barrier to the usability of the method.
Conclusions
In this work, we showed that the 3D alignment-dependent shape-based methods ROCS, in combination with the best-performing scoring function, the TanimotoCombo score, ranks the targets of approximately one-third of 280 investigated CSM queries among the top-5 ranks of hit lists of more than 3600 proteins. The success rate increases to 41% if the top-20 ranks are considered. For 24 of the 28 proteins (86%), the target of interest was ranked at the top position with at least one of the 10 queries. These results indicate that the method may well be a valuable tool for prioritizing research efforts in early drug discovery because researchers, with their expert knowledge and background information on a compound of interest (e.g., observations from phenotypic assays), will likely be able to rule out many of the proteins wrongly predicted as targets.
An important advantage of ROCS is its use of hard Gaussians for describing chemical features (color), which causes a lock-in effect during alignment. Alignments produced by ROCS therefore typically look “tidy”, enabling chemists to easily interpret the results and make their own judgements on the reliability of individual predictions (thereby excluding many false-positive predictions). Even if none of the predictions are deemed plausible, e.g., because of the lack of any good matches with compounds in the knowledge base, this can be valuable information as it is a good indication for a compound being novel and perhaps targeting a so-far unexplored biomacromolecule (or having a distinct binding mode). An important advantage of similarity-based approaches over many other methods is that the final prediction relies on a single data point (as opposed to, for example, machine learning approaches), making it straightforward for researchers to verify the reliability of that specific data point with the primary literature data.
Also, for 3D alignment-dependent shape-based methods, the success rates for the prediction of the targets of CSMs decline with decreasing molecular similarity between the CSM query and the ligands in the knowledge base. Macrocyclic compounds and natural products prove to be particularly challenging to the approach. Nevertheless, the robustness of the approach is impressive, given the fact that structurally highly dissimilar molecules, even though binding to the same binding site, may likely exhibit distinct binding modes, which is beyond the reach of any ligand-based approach.
Taking performance, usability, and interpretability into account, we believe that 3D alignment-dependent shape-based approaches such as the one investigated in this work are predestined for use in target prediction for CSMs and molecules for which data on structurally related compounds are scarce. With the increasing amount of bioactivity data, the reach and value of these and related methods will continue to improve.
Data Availability
The complete sets of CSMs and non-CSMs (including the original SMILES notations from ChEMBL, ChEMBL compound IDs, natural product-likeness scores, and labels for macrocycles) are available on GitHub at https://github.com/anya-chen/CSMs_target_prediction.
Acknowledgments
The authors thank Christina de Bruyn Kops from the Universität Hamburg and Christoph Bauer from the University of Bergen for valuable discussions and OpenEye for providing an academic license for the use of OMEGA and ROCS.
Glossary
Abbreviations
- CSM
complex small molecule
- MCS
maximum common substructure
Supporting Information Available
The Supporting Information is available free of charge at https://pubs.acs.org/doi/10.1021/acs.jcim.0c00161.
Density distribution of the molecular weight and number of heavy atoms of compounds of the processed data set and Approved Drugs subset of DrugBank (PDF)
Y.C. is supported by the China Scholarship Council (201606010345). N.M. and J.K. are supported by the Trond Mohn Foundation (BFS2017TMT01).
The authors declare no competing financial interest.
Supplementary Material
References
- Sydow D.; Burggraaff L.; Szengel A.; van Vlijmen H. W. T.; Ijzerman A. P.; van Westen G. J. P.; Volkamer A. Advances and Challenges in Computational Target Prediction. J. Chem. Inf. Model. 2019, 59, 1728–1742. 10.1021/acs.jcim.8b00832. [DOI] [PubMed] [Google Scholar]
- Cereto-Massagué A.; Ojeda M. J.; Valls C.; Mulero M.; Pujadas G.; Garcia-Vallve S. Tools for in silico Target Fishing. Methods 2015, 71, 98–103. 10.1016/j.ymeth.2014.09.006. [DOI] [PubMed] [Google Scholar]
- Agamah F. E.; Mazandu G. K.; Hassan R.; Bope C. D.; Thomford N. E.; Ghansah A.; Chimusa E. R. Computational/in silico Methods in Drug Target and Lead Prediction. Briefings Bioinf. 2019, 10.1093/bib/bbz103. [DOI] [PMC free article] [PubMed] [Google Scholar]
- Moffat J. G.; Vincent F.; Lee J. A.; Eder J.; Prunotto M. Opportunities and Challenges in Phenotypic Drug Discovery: An Industry Perspective. Nat. Rev. Drug Discovery 2017, 16, 531–543. 10.1038/nrd.2017.111. [DOI] [PubMed] [Google Scholar]
- Mathai N.; Chen Y.; Kirchmair J. Validation Strategies for Target Prediction Methods. Briefings Bioinf. 2019, 10.1093/bib/bbz026. [DOI] [PMC free article] [PubMed] [Google Scholar]
- Wang C.; Kurgan L. Review and Comparative Assessment of Similarity-Based Methods for Prediction of Drug-Protein Interactions in the Druggable Human Proteome. Briefings Bioinf. 2019, 20, 2066–2087. 10.1093/bib/bby069. [DOI] [PubMed] [Google Scholar]
- Lo Y.-C.; Senese S.; Li C.-M.; Hu Q.; Huang Y.; Damoiseaux R.; Torres J. Z. Large-Scale Chemical Similarity Networks for Target Profiling of Compounds Identified in Cell-Based Chemical Screens. PLoS Comput. Biol. 2015, 11, e1004153 10.1371/journal.pcbi.1004153. [DOI] [PMC free article] [PubMed] [Google Scholar]
- Boezio B.; Audouze K.; Ducrot P.; Taboureau O. Network-Based Approaches in Pharmacology. Mol. Inf. 2017, 36, 1700048. 10.1002/minf.201700048. [DOI] [PubMed] [Google Scholar]
- Rodrigues T.; Bernardes G. J. L. Machine Learning for Target Discovery in Drug Development. Curr. Opin. Chem. Biol. 2020, 56, 16–22. 10.1016/j.cbpa.2019.10.003. [DOI] [PubMed] [Google Scholar]
- Sam E.; Athri P. Web-Based Drug Repurposing Tools: A Survey. Briefings Bioinf. 2019, 20, 299–316. 10.1093/bib/bbx125. [DOI] [PubMed] [Google Scholar]
- Kim S.; Chen J.; Cheng T.; Gindulyte A.; He J.; He S.; Li Q.; Shoemaker B. A.; Thiessen P. A.; Yu B.; Zaslavsky L.; Zhang J.; Bolton E. E. PubChem 2019 Update: Improved Access to Chemical Data. Nucleic Acids Res. 2019, 47, D1102–D1109. 10.1093/nar/gky1033. [DOI] [PMC free article] [PubMed] [Google Scholar]
- Gaulton A.; Hersey A.; Nowotka M.; Bento A. P.; Chambers J.; Mendez D.; Mutowo P.; Atkinson F.; Bellis L. J.; Cibrián-Uhalte E.; Davies M.; Dedman N.; Karlsson A.; Magariños M. P.; Overington J. P.; Papadatos G.; Smit S.; Leach A. R. The ChEMBL Database in 2017. Nucleic Acids Res. 2017, 45, D945–D954. 10.1093/nar/gkw1074. [DOI] [PMC free article] [PubMed] [Google Scholar]
- PubChem . https://pubchem.ncbi.nlm.nih.gov/ (accessed Feb 4, 2020).
- ChEMBL Database. https://www.ebi.ac.uk/chembl/ (accessed Apr 6, 2020).
- Moumbock A. F. A.; Li J.; Mishra P.; Gao M.; Günther S. Current Computational Methods for Predicting Protein Interactions of Natural Products. Comput. Struct. Biotechnol. J. 2019, 17, 1367–1376. 10.1016/j.csbj.2019.08.008. [DOI] [PMC free article] [PubMed] [Google Scholar]
- Cockroft N. T.; Cheng X.; Fuchs J. R. STarFish: A Stacked Ensemble Target Fishing Approach and Its Application to Natural Products. J. Chem. Inf. Model. 2019, 59, 4906–4920. 10.1021/acs.jcim.9b00489. [DOI] [PMC free article] [PubMed] [Google Scholar]
- Chen Y.; de Bruyn Kops C.; Kirchmair J. Data Resources for the Computer-Guided Discovery of Bioactive Natural Products. J. Chem. Inf. Model. 2017, 57, 2099–2111. 10.1021/acs.jcim.7b00341. [DOI] [PubMed] [Google Scholar]
- Marsault E.; Peterson M. L. Macrocycles Are Great Cycles: Applications, Opportunities, and Challenges of Synthetic Macrocycles in Drug Discovery. J. Med. Chem. 2011, 54, 1961–2004. 10.1021/jm1012374. [DOI] [PubMed] [Google Scholar]
- You L.; An R.; Liang K.; Cui B.; Wang X. Macrocyclic Compounds: Emerging Opportunities for Current Drug Discovery. Curr. Pharm. Des. 2016, 22, 4086–4093. 10.2174/1381612822666160204114838. [DOI] [PubMed] [Google Scholar]
- Mallinson J.; Collins I. Macrocycles in New Drug Discovery. Future Med. Chem. 2012, 4, 1409–1438. 10.4155/fmc.12.93. [DOI] [PubMed] [Google Scholar]
- Reker D.; Perna A. M.; Rodrigues T.; Schneider P.; Reutlinger M.; Mönch B.; Koeberle A.; Lamers C.; Gabler M.; Steinmetz H.; Müller R.; Schubert-Zsilavecz M.; Werz O.; Schneider G. Revealing the Macromolecular Targets of Complex Natural Products. Nat. Chem. 2014, 6, 1072–1078. 10.1038/nchem.2095. [DOI] [PubMed] [Google Scholar]
- Kirchmair J.; Distinto S.; Markt P.; Schuster D.; Spitzer G. M.; Liedl K. R.; Wolber G. How To Optimize Shape-Based Virtual Screening: Choosing the Right Query and Including Chemical Information. J. Chem. Inf. Model. 2009, 49, 678–692. 10.1021/ci8004226. [DOI] [PubMed] [Google Scholar]
- Gfeller D.; Michielin O.; Zoete V. Shaping the Interaction Landscape of Bioactive Molecules. Bioinformatics 2013, 29, 3073–3079. 10.1093/bioinformatics/btt540. [DOI] [PubMed] [Google Scholar]
- Potshangbam A. M.; Polavarapu R.; Rathore R. S.; Naresh D.; Prabhu N. P.; Potshangbam N.; Kumar P.; Vindal V. MedPServer: A Database for Identification of Therapeutic Targets and Novel Leads Pertaining to Natural Products. Chem. Biol. Drug Des. 2019, 93, 438–446. 10.1111/cbdd.13430. [DOI] [PubMed] [Google Scholar]
- Gong J.; Cai C.; Liu X.; Ku X.; Jiang H.; Gao D.; Li H. ChemMapper: A Versatile Web Server for Exploring Pharmacology and Chemical Structure Association Based on Molecular 3D Similarity Method. Bioinformatics 2013, 29, 1827–1829. 10.1093/bioinformatics/btt270. [DOI] [PubMed] [Google Scholar]
- Schneider G.; Neidhart W.; Giller T.; Schmid G. Scaffold-Hopping” by Topological Pharmacophore Search: A Contribution to Virtual Screening. Angew. Chem., Int. Ed. 1999, 38, 2894–2896. . [DOI] [PubMed] [Google Scholar]
- Kumar A.; Zhang K. Y. J. Advances in the Development of Shape Similarity Methods and Their Application in Drug Discovery. Front. Chem. (Lausanne, Switz.) 2018, 6, 315. 10.3389/fchem.2018.00315. [DOI] [PMC free article] [PubMed] [Google Scholar]
- ChEMBL Database, version 25. https://www.ebi.ac.uk/chembl/ (accessed May 15, 2019).
- Bosc N.; Atkinson F.; Felix E.; Gaulton A.; Hersey A.; Leach A. R. Large Scale Comparison of QSAR and Conformal Prediction Methods and Their Applications in Drug Discovery. J. Cheminf. 2019, 11, 4. 10.1186/s13321-018-0325-4. [DOI] [PMC free article] [PubMed] [Google Scholar]
- Molecular Operating Environment (MOE). Chemical Computing Group. https://www.chemcomp.com/Products.htm.
- Hawkins P. C. D.; Nicholls A. Conformer Generation with OMEGA: Learning from the Data Set and the Analysis of Failures. J. Chem. Inf. Model. 2012, 52 (11), 2919–2936. 10.1021/ci300314k. [DOI] [PubMed] [Google Scholar]
- OMEGA 3.1.1.2. OpenEye Scientific Software. https://www.eyesopen.com (accessed Nov 13, 2019).
- Friedrich N.-O.; de Bruyn Kops C.; Flachsenberg F.; Sommer K.; Rarey M.; Kirchmair J. Benchmarking Commercial Conformer Ensemble Generators. J. Chem. Inf. Model. 2017, 57, 2719–2728. 10.1021/acs.jcim.7b00505. [DOI] [PubMed] [Google Scholar]
- Poongavanam V.; Danelius E.; Peintner S.; Alcaraz L.; Caron G.; Cummings M. D.; Wlodek S.; Erdelyi M.; Hawkins P. C. D.; Ermondi G.; Kihlberg J. Conformational Sampling of Macrocyclic Drugs in Different Environments: Can We Find the Relevant Conformations?. ACS Omega 2018, 3, 11742–11757. 10.1021/acsomega.8b01379. [DOI] [PMC free article] [PubMed] [Google Scholar]
- Fu L.; Niu B.; Zhu Z.; Wu S.; Li W. CD-HIT: Accelerated for Clustering the next-Generation Sequencing Data. Bioinformatics 2012, 28, 3150–3152. 10.1093/bioinformatics/bts565. [DOI] [PMC free article] [PubMed] [Google Scholar]
- CD-HIT Suite. http://weizhong-lab.ucsd.edu/cdhit-web-server/cgi-bin/index.cgi?cmd=cd-hit (accessed Mar 17, 2020).
- ROCS 3.3.1.2. OpenEye Scientific Software. https://www.eyesopen.com (accessed Nov 13, 2019).
- Hawkins P. C. D.; Skillman A. G.; Nicholls A. Comparison of Shape-Matching and Docking as Virtual Screening Tools. J. Med. Chem. 2007, 50, 74–82. 10.1021/jm0603365. [DOI] [PubMed] [Google Scholar]
- Méndez-Lucio O.; Medina-Franco J. L. The Many Roles of Molecular Complexity in Drug Discovery. Drug Discovery Today 2017, 22, 120–126. 10.1016/j.drudis.2016.08.009. [DOI] [PubMed] [Google Scholar]
- Rasina D.; Otikovs M.; Leitans J.; Recacha R.; Borysov O. V.; Kanepe-Lapsa I.; Domraceva I.; Pantelejevs T.; Tars K.; Blackman M. J.; Jaudzems K.; Jirgensons A. Fragment-Based Discovery of 2-Aminoquinazolin-4(3H)-Ones As Novel Class Nonpeptidomimetic Inhibitors of the Plasmepsins I, II, and IV. J. Med. Chem. 2016, 59, 374–387. 10.1021/acs.jmedchem.5b01558. [DOI] [PubMed] [Google Scholar]
- Chen Y.; Stork C.; Hirte S.; Kirchmair J. NP-Scout: Machine Learning Approach for the Quantification and Visualization of the Natural Product-Likeness of Small Molecules. Biomolecules 2019, 9, 43. 10.3390/biom9020043. [DOI] [PMC free article] [PubMed] [Google Scholar]
Associated Data
This section collects any data citations, data availability statements, or supplementary materials included in this article.
Supplementary Materials
Data Availability Statement
The complete sets of CSMs and non-CSMs (including the original SMILES notations from ChEMBL, ChEMBL compound IDs, natural product-likeness scores, and labels for macrocycles) are available on GitHub at https://github.com/anya-chen/CSMs_target_prediction.


