

Abstract
Background
Quality of care depends on system, facility, provider, and client-level factors. We aimed at examining structural and process quality of services for sick children and its association with client satisfaction at health facilities in Ethiopia.
Methods
Data from the Ethiopia Service Provision Assessment Plus (SPA+) survey 2014 were used. Measures of quality were assessed based on the Donabedian framework: structure, process, and outcome. A total of 1908 mothers or caretakers were interviewed and their child consultations were observed. Principal component analysis was used to construct quality of care indices including a structural composite score, a process composite score, and a client satisfaction score. Multilevel mixed linear regression was used to analyze the association between structural and process factors with client satisfaction.
Result
Among children diagnosed with suspected pneumonia, respiratory rate was counted in 56% and temperature was checked in 77% of the cases. A majority of children (92%) diagnosed with fever had their temperature taken. Only 3% of children with fever were either referred or admitted, and 60% received antibiotics. Among children diagnosed with malaria, 51% were assessed for all three Integrated Management of Childhood Illnesses (IMCI) main symptoms, and 4% were assessed for all three general danger signs. Providers assessed dehydration in 54% of children with diarrhea with dehydration, 17% of these children were admitted or referred to another facility, and Oral Rehydration Solution was prescribed for 67% while none received intravenous fluids. The number of basic amenities in the facility was negatively associated with the clients’ satisfaction. Private facilities, when the providers had got training for care of sick children in the past 2 years, had higher client satisfaction. There was no statistical association between structure, process composite indicators and client satisfaction.
Conclusion
The assessment of sick children was of low quality, with many missing procedures when comparing with IMCI guidelines. In spite of this, most clients were satisfied with the services they received. Structural and process composite indicators were not associated with client’s satisfaction. These findings highlight the need to assess other dimensions of quality of care besides structure and process that may influence client satisfaction.
Keywords: Quality, Satisfaction, Child health, Integrated management of childhood illness, Ethiopia
Background
In spite of global progress in child survival, 5.4 million children died before the age of 5 years in 2017, whereof most deaths occurred in low- and middle-income countries [1]. Ethiopia was one of few low-income countries achieving the fourth Millennium Development Goal by a two-thirds reduction of under-five mortality from 1990 to 2015 [2]. Nonetheless, Ethiopia remains one of the Sub-Saharan countries with the highest burden of child deaths [3].
Universal health coverage has been recommended as a strategy to improve health of a population. The success of this strategy is, however, also dependent on the provision of good-quality health care [4]. Poor quality of care provided at health facilities may contribute to child mortality [4, 5]. Poor-quality care can also lead to other adverse outcomes, including lack of trust and confidence in the health system [6].
In an effort to improve the quality of child health services, the World Health Organization (WHO) and the United Nations International Children’s Emergency Fund (UNICEF) developed the Integrated Community Case Management (iCCM) of childhood illnesses strategy [7]. This strategy aims to reduce morbidity and mortality among children under the age of 5 years through improved health workers’ skills by training and supportive supervision; improved health systems, including equipment, supplies, organization of work and referral systems; and improved key family practices and child care at community and household levels [8].
In Ethiopia, health centers and some hospitals provide Integrated Management of Newborn and Childhood Illness (IMNCI) and at health post level these services are referred to as the Integrated Community Case Management (iCCM). The Health Extension Workers (HEW) at health posts manage pneumonia, diarrhea, malaria, and malnutrition and refer severe cases [9].
As many countries attempt to improve service delivery, there is an increased need to assess the quality of care at health facilities, in order to identify problems and to identify factors that could lead to better care. The concept of quality of health care, in view of its subjective nature, is difficult to define and consequently difficult to measure. Donabedian proposed the triad of structure, process, and outcome to evaluate the quality of health care [10]. Based on Donabedian’s framework, this study examined the quality of sick child services and determinants of client satisfaction at health facilities in Ethiopia. Few studies have assessed the quality of care provided in Ethiopia [11, 12]. However, none of these studies examined the association between structural and process quality dimensions and client satisfaction. Thus, this study aimed at evaluating the quality of care for sick children at Ethiopian health facilities by assessing all three components of the Donabedian framework: structure, process, and outcome.
Methods
Data source
Data used in this study came from the Ethiopian Service Provision Assessment Plus survey (SPA+). Data were collected from March to July, 2014. The survey included observations of services provided to sick children to assess to what extent providers adhered to accepted service delivery and quality standards. Exit interviews were conducted with mothers or caretakers of sick children, whose consultations had been observed. The exit interviews included questions on the clients’ perception of the service delivery environment. Detailed methodology on SPA+ has previously been published [13].
In this survey, all hospitals and a representative sample of health centers, clinics, and health posts were selected. In each facility, clients were systematically selected for observation based on the number of clients visiting the facility for each of the sick child services on the day of the survey. A maximum of five clients were observed for a maximum of three providers of sick child services, with a maximum of 15 observations in a given facility. Interviewers were attempting to conduct an exit interview with all caretakers of observed sick children.
Measurements
Based on Donabedian’s quality of care framework, this study assessed three aspects of the quality of care: structure, process, and outcome [14]. In addition, descriptive statistics on adherence to IMCI guidelines for the assessment, physical examination, and treatment of sick children were presented. Structural data came from facility inventory interviews, while process measurements primarily depended on direct observations of client-provider interactions. Information about the clients’ satisfaction, which is viewed as reflecting outcome, was based on exit interviews with mothers or caregivers.
Information about structure
Table 1 shows structure and process indicators, which were selected based on the WHO Service Availability and Readiness Assessment (SARA) reference manual [15]. The structural indicators of quality of care included the facilities’ management system, service availability, infrastructure, and equipment.
Table 1.
Items used in defining the structure and process indicators for quality in sick child services in Ethiopia. Ethiopian Service Provision Assessment Plus Survey 2014
| Definition | Variable type | ||
|---|---|---|---|
| Categorical | Continuous | ||
| STRUCTURE | |||
| Routine management meetings | Whether there are monthly meeting to discuss management issues | Yes/No | – |
| System to collect client opinion | Whether the facility has a system to obtain clients’ opinions regarding services | Yes/No | – |
| Quality assurance system | Whether the facility has a routine quality assurance system | Yes/No | – |
| Supervision | Whether the facility reported that the last supervision visit was in the last 6 months | Yes/No | – |
| Basic amenities | Number of amenities at facility: water, electricity, generator, telephone, internet, ambulance | – | 0–6 |
| Health workers always available | 24 h staff availability | Yes/No | – |
| Infection prevention precautions | Number of infection prevention measures at facility: sharps containers, gloves, disinfectant, disposable needles or autodestruct syringes with disposable syringes, waste bin, hand disinfectant | – | 0–5 |
| Equipment available | Number of pieces of sick child equipment available at facility: Infant scale, child scale, thermometer, stethoscope, timer/watch or clock | – | 0–5 |
| IMCI guide followed | Whether the facility always follows guide for integrated management of childhood illness (IMCI) when assessing/treating sick child | Yes/No | |
| Malaria diagnosis and treatment | Whether the facility always has malaria blood tests available for children under age 5 | Yes/No | |
| IMCI mother’s card | Whether IMCI mother’s card are available at facility | Yes/No | |
| PROCESS | |||
| Number of symptoms checked | Number of symptoms that the provider asked for or that the caregiver mentioned: Cough or difficult breathing, diarrhea, fever or body hotness, ear problems, unable to drink or breastfeed, vomiting everything, convulsions | – | 0–7 |
| Physical examination of sick child | Number of types of sick child exams performed: Took child’s temperature by thermometer, Felt the child for fever or body hotness, Counted respiration (breaths) for 60 s, Auscultated child (listen to chest with stethoscope) or count pulse, Checked skin turgor for dehydration (e.g., pinch abdominal skin), Checked for pallor by looking at palms, Checked for pallor by looking at conjunctiva, Looked into child’s mouth, Checked for neck stiffness, Looked in child’s ear, Felt behind child’s ear, Undressed child to examine (up to shoulders/down to ankles), Pressed both feet to check for edema, Weighed the child, Plotted weight on growth chart, Checked for enlarged lymph nodes in 2 or more of the following sites: neck, axillae, groin | – | 0–16 |
| Information provided to caregiver | Number of pieces of information given to caregiver during consultation: provide general information about feeding/breastfeeding, advise extra fluids during this sickness, advise continued feeding during sickness, name the illness for the caretaker, describe symptoms requiring immediate return for care | – | 0–5 |
| Provider used visual aids | Whether provided used visual aids during consultation | Yes/No | – |
| Provider discussed follow-up visit | Whether the provider discussed follow-up visit during consultation | Yes/No | – |
Information about process
The process indicators of quality of care consisted of both interpersonal and technical features of the provider-client interactions. The interpersonal characteristics include information provided to a caregiver and the technical characteristics of the provider-client interactions included symptoms checked and physical examination conducted. These were based on the IMCI guidelines [16] and were derived from direct observation of the care provided during the consultations with sick children (Table 1).
Information about client satisfaction
Client satisfaction with sick child services, representing the outcome, was measured in the exit interview using 11 questions about mothers’ or caretakers’ perceptions of the quality of care. Satisfaction was rated as an index of problems not encountered during the visit.
Statistical analyses
Principal component analysis was used to construct several indices including the structural composite score, the process composite score, and the client satisfaction score. In doing so, we generated the indices with the highest Cronbach’s alpha, keeping the maximum number of common variables. The scores were computed based on the first principle component, which explained the largest proportion of the total variance. The structure, process, and outcome quality of care indicators and their respective composite indices were computed. The responses of caregivers were aggregated into an index to measure satisfaction using principal components analysis. Cronbach’s alpha of 0.82 revealed that items co-varied and probably measured the same underlying concept, i.e., satisfaction. In this study, a high reliability implies that it measures client satisfaction, while low reliability indicates that it measures something else (or possibly nothing at all).
Multilevel mixed linear regression was used to analyze if structural and process indices were associated with client satisfaction. The fixed effects, which is a measure of association, and random effects that is a measure of variation for client satisfaction, were determined by considering the region as the level of variation in the multilevel mixed regression. Four models were fitted, Model I included structural indicators, Model II included process indicators, Model III included each of the structure and process items, and Model IV included structural and process composite indicator. In the regression analysis for client satisfaction, we controlled for provider level covariates that could affect client satisfaction. The Akaike’s information criterion (AIC) and Bayesian information criterion (BIC) were used to measure the model fit and complexity. The model with the smallest value of the information criterion was considered to be better. The STATA Statistical Software version 14.2 (Stata Corp LP, College Station, TX, USA) was used to conduct these analyses.
Results
A total of 1908 clients were observed and interviewed at 1165 health facilities (hospitals, health centers, clinics, and health posts). Facility data were linked to data regarding sick children, whose consultations were observed and their mothers or caregivers, who were interviewed (Fig. 1).
Fig. 1.

Study flow for the analysis of determinants of client satisfaction in sick child services in Ethiopia. Ethiopian Service Provision Assessment Plus Survey 2014
Client characteristics
The clients’ characteristics are shown in Table 2. The majority of the clients’ observations and exit interviews were performed in Oromia region (21%) followed by Amhara region (15%). The majority was done in urban areas (72%), primarily in hospitals (46%) and health centers (38%).
Table 2.
Distribution of observed sick child consultations and exit interviews with mothers or caretakers by background characteristics. Ethiopian Service Provision Assessment Plus Survey 2014
| Facility characteristics | Total number of clients interviewed | Percent |
|---|---|---|
| Region | ||
| Addis Ababa | 255 | 13.4 |
| Afar | 70 | 3.7 |
| Amhara | 284 | 14.9 |
| Benishangul Gumuz | 115 | 6.0 |
| Dire Dawa | 121 | 6.3 |
| Gambella | 38 | 2.0 |
| Harari | 100 | 5.2 |
| Oromia | 403 | 21.1 |
| SNNP | 229 | 12.0 |
| Somali | 105 | 5.5 |
| Tigray | 188 | 9.9 |
| Facility type | ||
| Hospitals | 876 | 45.9 |
| Health centers | 720 | 37.7 |
| Health posts | 65 | 3.4 |
| Clinic | 247 | 12.9 |
| Urban/rural | ||
| Urban | 1382 | 72.4 |
| Rural | 526 | 27.5 |
| Total | 1908 | 100 |
Description of sick child service quality attributes
Table 3 presents the description and comparisons of sick child service quality attributes across the different types of facilities. About half (53%) of the providers in the facilities had received sick child care training in the past 2 years. Among the structural indicators, 91% had a system to conduct routine management meetings, 82% had a system to collect client opinions, but only 33% used the IMCI mother’s card. The purpose of that card was to provide the mother with reminders of the key messages she had received from the health worker. Only 2% of the sick child care providers had used visual aids during the consultations. More than two thirds (67%) of the clients reported that waiting time to see the provider was not a problem, and 74% of the clients reported that cost of the services was not a problem.
Table 3.
Sick child services quality attributes by facility type. Ethiopian Service Provision Assessment Plus Survey 2014
| FACILITY / PROVIDER CHARACTERISTICS | Hospitals | Health centers | Health posts | Clinics | Total | |||||
|---|---|---|---|---|---|---|---|---|---|---|
| N | % | N | % | N | % | N | % | N | % | |
| Facility managing authority | ||||||||||
| Public | 697 | 79.6 | 715 | 99.3 | 65 | 100.0 | 1 | .4 | 1478 | 77.5 |
| Private/Non-Governmental Organization | 179 | 20.4 | 5 | 0.7 | 0 | 0.0 | 246 | 99.6 | 430 | 22.5 |
| Urban/Rural | ||||||||||
| Urban | 781 | 89.2 | 396 | 55.0 | 6 | 9.2 | 199 | 80.6 | 1382 | 72.4 |
| Rural | 95 | 10.8 | 324 | 45.0 | 59 | 90.8 | 48 | 19.4 | 526 | 27.6 |
| Provider in the facility received sick child care training in past 2 years | 442 | 50.5 | 467 | 64.9 | 40 | 61.5 | 52 | 21.1 | 1001 | 52.5 |
| STRUCTURE COMPOSITE INDEX | ||||||||||
| Routine management meetings | 866 | 98.9 | 704 | 97.8 | 43 | 66.2 | 118 | 47.8 | 1731 | 90.7 |
| System to collect client opinion | 823 | 93.9 | 570 | 79.2 | 18 | 27.7 | 145 | 58.7 | 1556 | 81.6 |
| Quality assurance system | 726 | 82.9 | 485 | 67.4 | 22 | 33.8 | 57 | 23.1 | 1290 | 67.6 |
| Supervision | 813 | 92.8 | 693 | 96.3 | 55 | 84.6 | 228 | 92.3 | 1789 | 93.8 |
| Health workers always available | 868 | 99.1 | 702 | 97.5 | 26 | 40.0 | 108 | 43.7 | 1704 | 89.3 |
| IMCI guide followed | 608 | 69.4 | 653 | 90.7 | 43 | 66.2 | 96 | 38.9 | 1400 | 73.4 |
| Diagnose and/or treat malaria | 866 | 98.9 | 717 | 99.6 | 63 | 96.9 | 238 | 96.4 | 1884 | 98.7 |
| Number of basic amenities (mean, SE) | 5 (0.028) | 3 (0.047) | 2 (0.093) | 3 (0.076) | 4 (0.033) | |||||
| Number of infection prevention precautions (mean, SE) | 3 (0.040) | 3 (0.050) | 4 (0.144) | 4 (0.073) | 3 (0.03) | |||||
| Number of sick child equipment available (mean, SE) | 4 (0.037) | 3 (0.039) | 3 (0.133) | 3 (0.065) | 4 (0.025) | |||||
| IMCI mother’s card | 329 | 37.6 | 263 | 36.5 | 17 | 26.2 | 11 | 4.5 | 620 | 32.5 |
| Cronbach’s alpha | 0.4613 | |||||||||
| PROCESS COMPOSITE INDEX | ||||||||||
| Provider used visual aids | 10 | 1.1 | 28 | 3.9 | 0 | 0.0 | 1 | .4 | 39 | 2.0 |
| Provider discussed follow-up visit | 133 | 15.2 | 183 | 25.4 | 19 | 29.2 | 61 | 24.7 | 396 | 20.8 |
| Number of symptoms checked (mean, SE) | 3 (0.051) | 4 (0.058) | 3 (0.204) | 4 (0.092) | 3 (0.035) | |||||
| Number of physical examinations of sick child (mean, SE) | 4 (0.076) | 3 (0.076) | 3 (0.229) | 4 (0.149) | 4 (0.05) | |||||
| Number of information provided to caregiver (mean (SE) | 1 (0.044) | 1 (0.054) | 1 (0.114) | 1 (0.085) | 1 (0.031) | |||||
| Cronbach’s alpha | 0.4588 | |||||||||
| OUTCOME / SATISFACTION | ||||||||||
| Time you waited to see provider | 514 | 58.7 | 522 | 72.5 | 49 | 75.4 | 195 | 78.9 | 1280 | 67.1 |
| Ability to discuss problems or concerns about your health with the provider | 590 | 67.4 | 517 | 71.8 | 51 | 78.5 | 184 | 74.5 | 1342 | 70.3 |
| Amount of explanation you received about the problem or treatment | 593 | 67.7 | 501 | 69.6 | 50 | 76.9 | 181 | 73.3 | 1325 | 69.4 |
| Privacy from having others see the examination | 763 | 87.1 | 611 | 84.9 | 53 | 81.5 | 219 | 88.7 | 1646 | 86.3 |
| Privacy from having others hear your consultation discussion | 763 | 87.1 | 615 | 85.4 | 53 | 81.5 | 220 | 89.1 | 1651 | 86.5 |
| Availability of medicines/methods at this facility | 568 | 64.8 | 508 | 70.6 | 42 | 64.6 | 136 | 55.1 | 1254 | 65.7 |
| The hours of services at this facility | 664 | 75.8 | 585 | 81.3 | 46 | 70.8 | 197 | 79.8 | 1492 | 78.2 |
| The number of days services are available to you | 714 | 81.5 | 592 | 82.2 | 49 | 75.4 | 210 | 85.0 | 1565 | 82.0 |
| The cleanliness of the facility | 666 | 76.0 | 598 | 83.1 | 55 | 84.6 | 204 | 82.6 | 1523 | 79.8 |
| How the staff treated you | 664 | 75.8 | 590 | 81.9 | 59 | 90.8 | 221 | 89.5 | 1534 | 80.4 |
| Cost for services or treatments | 638 | 72.8 | 565 | 78.5 | 0 | 0.0 | 161 | 65.2 | 1364 | 74.0 |
| Cronbach’s alpha | 0.8156 | |||||||||
Mean satisfaction score
Figure 2 describes the mean satisfaction score by facility type. At national level the mean satisfaction score was 76%. Compared to mothers/caregivers who sought care at other types of facilities, those that sought care at health posts reported the lowest mean satisfaction score (71%).
Fig. 2.
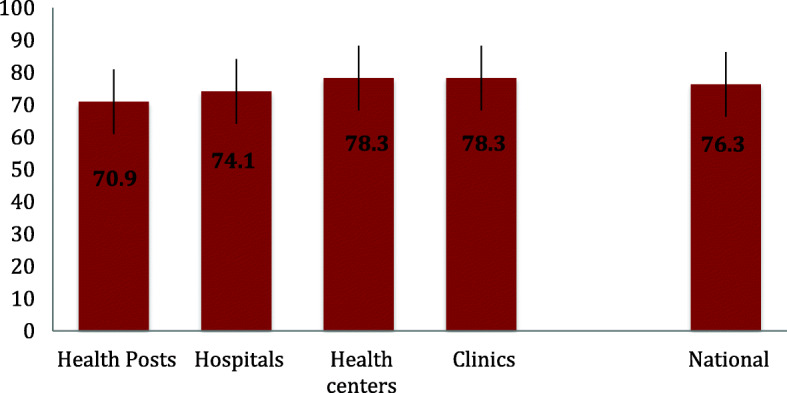
Satisfaction score (mean percent, 95% CI) on sick child care by facility type. Ethiopian Service Provision Assessment Plus Survey 2014
Assessments, examinations, and treatment of sick children, classified by diagnosis or major symptoms
Table 4 describes other process indicators for the management of sick children. Among children ultimately diagnosed with pneumonia, respiratory rate was counted in 56% of the cases and temperature was checked in 77%. Overall, 19% of children diagnosed with pneumonia were either hospitalized or referred elsewhere. Eighty-four percent were given some form of antibiotics (9% received injectable antibiotics, and 78% an oral antibiotic). Among the children diagnosed with bronchial spasm or asthma, 43% had their temperature checked, only 13% were checked for their respiratory rate, and 89% received antibiotics. Providers prescribed any antibiotics for 63% of children diagnosed with cough or other upper respiratory illness.
Table 4.
Adherence to IMCI assessment, physical examination, and treatment among sick children. Ethiopian Service Provision Assessment Plus Survey 2014
| Components of consultation | Pneumonia/ Broncho- pneumonia | Bronchial spasm/asthma | Cough or other upper respiratory illness | Fever | Measles | Malariad | Any diarrhea without dehydration | Any diarrhea with dehydration | Ear infection | Malnutrition | All observed children |
|---|---|---|---|---|---|---|---|---|---|---|---|
| IMCI assessment | |||||||||||
| 3 main symptomsa | 55 | 53 | 55 | 27 | 61 | 51 | 65 | 43 | 35 | 49 | 44 |
| 3 general danger signsb | 3 | 0 | 6 | 3 | 0 | 4 | 1 | 23 | 8 | 6 | 4 |
| Current eating or drinking habits | 30 | 45 | 25 | 25 | 30 | 28 | 25 | 50 | 20 | 62 | 27 |
| Caretaker advised to continue feeding and to increase fluid intake | 12 | 3 | 16 | 19 | 22 | 23 | 20 | 43 | 17 | 38 | 17 |
| Physical examination | |||||||||||
| Temperature | 77 | 43 | 87 | 92 | 67 | 91 | 88 | 74 | 72 | 74 | 74 |
| Respiratory rate | 56 | 13 | 48 | 47 | 46 | 32 | 22 | 11 | 16 | 31 | 29 |
| Dehydration | 20 | 9 | 17 | 38 | 60 | 28 | 56 | 54 | 19 | 29 | 23 |
| Anemia | 33 | 25 | 24 | 47 | 38 | 39 | 43 | 44 | 35 | 37 | 30 |
| Ear (looked in ear/ felt behind ear) | 9 | 37 | 13 | 11 | 9 | 11 | 14 | 0 | 69 | 7 | 11 |
| Edema | 4 | 9 | 3 | 10 | 9 | 7 | 0 | 13 | 3 | 35 | 7 |
| Referred for any laboratory test | 18 | 19 | 18 | 33 | 24 | 43 | 16 | 27 | 13 | 7 | 21 |
| Treatment | |||||||||||
| Referred outside or admitted | 19 | 0 | 5 | 3 | 22 | 2 | 1 | 17 | 11 | 21 | 9 |
| Any antibiotic | 84 | 89 | 63 | 60 | 94 | 52 | 62 | 80 | 92 | 43 | 58 |
| Injectable antibiotic | 9 | 8 | 2 | 3 | 26 | 2 | 1 | 11 | 15 | 4 | 4 |
| Oral antibiotic | 78 | 80 | 62 | 59 | 90 | 50 | 61 | 76 | 86 | 41 | 56 |
| Any antimalarial | 3 | 0 | 3 | 6 | 3 | 36 | 0 | 0 | 2 | 2 | 4 |
| ACT | 1 | 0 | 1 | 1 | 3 | 16 | 0 | 0 | 0 | 1 | 2 |
| Oral non-ACT | 2 | 0 | 2 | 4 | 0 | 18 | 0 | 0 | 1 | 1 | 2 |
| Injectable artesunate | 0 | 0 | 0 | 0 | 0 | 0 | 0 | 0 | 0 | 0 | 0 |
| Quinine | 0 | 0 | 0 | 1 | 0 | 1 | 0 | 0 | 0 | 0 | 0 |
| Oral bronchodilator | 5 | 46 | 1 | 0 | 0 | 0 | 0 | 0 | 0 | 0 | 1 |
| Oral medication for symptomatic treatment | 47 | 46 | 48 | 65 | 42 | 55 | 23 | 26 | 40 | 12 | 35 |
| Oral rehydration solution (ORS) | 18 | 1 | 8 | 33 | 31 | 22 | 76 | 67 | 14 | 16 | 19 |
| Intravenous fluid | 0 | 0 | 0 | 0 | 0 | 0 | 0 | 0 | 0 | 0 | 0 |
| Zinc | 7 | 1 | 2 | 8 | 1 | 10 | 13 | 8 | 3 | 9 | 6 |
| Described signs or symptoms requiring immediate return | 21 | 16 | 21 | 24 | 0 | 30 | 20 | 17 | 16 | 16 | 19 |
| Discussed follow-up visit | 17 | 24 | 29 | 21 | 1 | 29 | 42 | 28 | 35 | 26 | 25 |
| Number of childrenc | 299 | 11 | 289 | 197 | 8 | 201 | 72 | 24 | 58 | 146 | 1908 |
Note: ACT artemisinin combination therapy
a The three IMCI main symptoms are cough/difficulty breathing, diarrhea, and fever
b The three IMCI general danger signs are inability to eat/drink anything, vomiting everything, and febrile convulsion
c A child may be classified under more than one diagnosis; therefore, the numbers in the individual columns are not mutually exclusive and may add to more than the total number of observed children
d Malaria reflects the provider-reported diagnosis, which may have been based on rapid diagnostic test (RDT), microscopy, or clinical diagnosis. The interviewing team did not verify this information
A majority of children (92%) diagnosed with fever had their temperature taken. Only 3% of children with fever were either referred or admitted, and 60% received antibiotics.
Among children diagnosed with malaria, 51% were assessed for all three IMCI main symptoms, and 4% were assessed for all three IMCI general danger signs. In addition, temperature was assessed in 91%, and anemia was assessed in 39% of the children. Overall, providers either hospitalized or referred the child elsewhere in 2% of these cases and gave some form of antimalarial medicine to 36%. The providers gave some antibiotics in half (52%) of these cases.
There were two categories of diarrhea: (1) any diarrhea without dehydration, and (2) any diarrhea with dehydration. The providers assessed dehydration in 56% of cases in the first category and in 54% of cases in the second category. Only 1% of children in the first category and 17% of children in the second category were admitted or referred to another facility. Oral Rehydration Solution (ORS) was prescribed for 76% of children in the first category (diarrhea without dehydration), while none received intravenous fluids. Among children in the second category (diarrhea with dehydration), 67% were given ORS while none were put on intravenous fluids. More children in the first category (diarrhea without dehydration) were given zinc (13%) than children in the second category (8%).
Determinants of mothers or caretakers’ satisfaction with the quality of care provided to their sick children
Results from the multivariable regression models for the associations between structural and process quality and client satisfaction are presented in Table 5. A few results were consistent across the analyses. The number of basic amenities in the facility was negatively associated with clients’ satisfaction. Private facilities combined with providers’ sick child care training in the past 2 years were positively associated with client satisfaction. Structural and process composite indicators were not associated with client satisfaction with sick child health services.
Table 5.
Multivariable analysis to identify factors associated with client’s satisfaction with sick child services. Ethiopian Service Provision Assessment Plus Survey 2014
| Facility/provider characteristics | Model I | Model II | Model III | Model IV | ||||
|---|---|---|---|---|---|---|---|---|
| β Coeff | 95% CI | β Coeff | 95% CI | β Coeff | 95% CI | β Coeff | 95% CI | |
| Facility managing authority | ||||||||
| Public | Reference | Reference | Reference | |||||
| Private or Non-governmental organization | 0.44 * | (0.26, 0.63) | 0.43 * | (0.25, 0.60) | 0.44 * | (0.26, 0.63) | ||
| Urban/Rural | ||||||||
| Urban | Reference | Reference | Reference | |||||
| Rural | 0.04 | (−0.09, 0.17) | 0.09 | (−0.02, 0.21) | 0.04 | (− 0.09, 0.16) | ||
| Facility type | ||||||||
| Hospitals | Reference | Reference | Reference | |||||
| Health centers | −0.08 | (− 0.23, 0.06) | 0.06 | (− 0.06, 0.18) | − 0.09 | (− 0.23, 0.06) | ||
| Health posts | − 0.20 | (− 0.53, 0.14) | 0.08 | (− 0.19, 036) | − 0.19 | (− 0.53, 0.14) | ||
| Clinics | −0.35 * | (− 0.62, − 0.08) | −0.20 | (− 0.40, 0.002) | −0.35* | (− 0.62, − 0.08) | ||
| Provider in the facility received sick child care training in the past two years | ||||||||
| No | Reference | Reference | Reference | |||||
| Yes | 0.11 * | (0.02, 0.21) | 0.11 * | (0.01, 0.20) | 0.11 * | (0.02, 0.20) | ||
| Caregivers education level | ||||||||
| No formal education | Reference | Reference | Reference | |||||
| Primary | 0.01 | (−0.10, 0.13) | 0.01 | (− 0.11, 0.12) | 0.02 | (−0.10, 0.13) | ||
| Secondary | 0.10 | (−0.03, 0.23) | 0.08 | (−0.05, 0.20) | 0.10 | (−0.03, 0.22) | ||
| Higher | 0.002 | (− 0.14, 0.15) | −0.01 | (− 0.15, 0.13) | 0.005 | (− 0.14, 0.15) | ||
| Structure composite indicator | 0.03 | (− 0.01, 0.08) | ||||||
| Routine management meetings | 0.06 | (−0.13, 0.26) | 0.07 | (−0.13, 0.26) | ||||
| System to collect client opinion | −0.08 | (− 0.22, 0.06) | − 0.08 | (− 0.22, 0.06) | ||||
| Quality assurance system | 0.03 | (−0.09, 0.14) | 0.03 | (−0.09, 0.14) | ||||
| Supervision | 0.16 | (−0.03, 0.35) | 0.16 | (−0.03, 0.35) | ||||
| Health workers always available | −0.10 | (− 0.29, 0.10) | − 0.10 | (− 0.29, 0.09) | ||||
| IMCI guide followed | −0.01 | (− 0.13, 0.10) | − 0.02 | (− 0.13, 0.10) | ||||
| Diagnose and/or treat malaria | 0.20 | (−0.21, 0.61) | 0.21 | (−0.20, 0.62) | ||||
| Number of basic amenities | −0.08* | (− 0.13, − 0.03) | − 0.08* | (−0.13, − 0.03) | ||||
| Number of infection prevention precautions | −0.02 | (− 0.06, 0.02) | − 0.02 | (− 0.06, 0.02) | ||||
| Number of sick child equipment available | 0.03 | (−0.02, 0.07) | 0.03 | (−0.02, 0.07) | ||||
| IMCI mother’s card | 0.10 | (−0.01, 0.20) | 0.10 | (−0.007, 0.20) | ||||
| Process composite indicator | 0.04 | (−0.003, 0.09) | ||||||
| Provider used visual aids | 0.11 | (−0.21, 0.43) | 0.14 | (−0.18, 0.46) | ||||
| Provider discussed follow-up visit | 0.06 | (−0.05, 0.17) | 0.04 | (−0.07, 0.15) | ||||
| Number of symptoms checked | 0.01 | (−0.02, 0.04) | 0.01 | (−0.02, 0.04) | ||||
| Number of physical examinations of sick child | 0.004 | (−0.02, 0.03) | 0.002 | (−0.02, 0.02) | ||||
| Number of information provided to caregiver | −0.02 | (−0.05, 0.02) | − 0.01 | (− 0.05, 0.02) | ||||
| Random effect (region) | ||||||||
| Variance (SE) | 0.07 (0.04) | (0.03, 0.19) | 0.08 (0.04) | (0.03, 0.21) | 0.07 (0.04) | (0.03, 0.18) | ||
| ICC | 0.069 | 0 .079 | 0.068 | |||||
| Model fitness | ||||||||
| AIC | 5349.299 | 5353.751 | 5356.999 | 5416.084 | ||||
| BIC | 5482.59 | 5448.166 | 5518.06 | 5438.299 | ||||
*P-value< 0.05, **p-value< 0.001
CI Confidence Interval, SE Standard Error, AIC Akaike Information Criterion, BIC Bayesian information criterion, LL Log Likelihood
Discussion
The assessment of sick children in Ethiopia was of low quality, especially in clinics and health posts, but most clients were satisfied with the service they received. Health posts and clinics scored higher in some of the satisfaction attributes (waiting time, health worker’s ability to discuss, and explanation on treatment provided) compared to hospitals and health centers. The average satisfaction score did not vary across facility types. Structural and process composite indicators were not associated with satisfaction of clients in sick child services.
This study is the first effort to assess the quality of care provided to sick children in Ethiopia combined with an analysis of the association of client satisfaction with a range of process and structural characteristics based on a nationally representative sample. The study included a large number of observations. The sampling design assumed that hospitals, health centers and clinics played a more important role than health posts in the national health system. Therefore hospitals, health centers, and private clinics were over-sampled to improve the precision of the survey in the assessment at these levels.
The study involved observations of client-provider interactions during data collection, making it susceptible to the so-called Hawthorn effect. This implies that behavior might have changed when being observed resulting in better performance than usual. The health workers, who were selected as observers, had prior experience of the IMCI strategy and guidelines. They were trained for 4 weeks, including practical demonstrations of assessments, physical examination, and treatment.
The three main symptoms in the IMCI assessments (difficulty breathing, diarrhea, and fever), and the three general danger sign (inability to eat or drink anything, vomiting everything, and febrile convulsion) [17] were frequently neglected in the assessment of sick children. Similar gaps in following the steps of the IMCI guidelines were observed in a multi-country study conducted in Namibia, Kenya, Tanzania and Uganda [18]. The methodology used in these studies was similar to our study. A child with general danger signs should be considered as a serious problem. Most children with a general danger sign need immediate referral or admission to hospital [17]. They may also need lifesaving treatments with injectable antibiotics, oxygen or other treatments, which may not be available in the facility.
All children with respiratory problems should have had their respiratory rate counted [19]. We found inadequate physical examination of cases with suspected pneumonia. In general, none of the upper respiratory illnesses should be treated with antibiotics [19]. In this study, an even higher amount of antibiotic use was seen in cases with cough or other upper respiratory symptoms. Similarly, inappropriate antibiotics prescription was observed in a study in Benin [20]. With the worldwide growing problems of antibiotic resistance, an appropriate use of antibiotics should be encouraged to ensure that these drugs are not overused.
A recent study revealed that facility infrastructure was poorly associated with quality of child health services [21], which indicates that availability of equipment and supplies does not guarantee good quality of care and satisfaction. However, it is difficult to provide good quality care without access to basic equipment [21, 22]. These findings are in line with our results, where the composite structural index was unrelated to client satisfaction. We also found that the number of amenities in a facility was negatively associated with satisfaction. In addition, a relatively low alpha value for the structural and process indicators might contribute to the poor association. A study conducted on facility assessment tools indicated that a quarter of quality measures were not assessed by any of the tools including SPA [23]. Our study did not show an association between the number of physical examinations performed on the sick child and client satisfaction. A study conducted in Paraguay showed a positive association between the number of examinations performed and patient satisfaction [24].
Patient satisfaction is an increasingly common component in estimating the quality of healthcare. A recently published study in Nigeria revealed that patient satisfaction measured at the facility immediately after a visit tends to be high, irrespective of the objective quality of the facility [25]. Another study in Nigeria also indicated that patient satisfaction must be complemented with additional objective measures [26]. This points at the need of better measures when moving forward to improve quality of care. With the new sustainable development goals and commitments for universal health coverage, it is essential that the quality of health care dimension should be added to the agenda.
Another limitation of our study was that outcomes were measured solely on client satisfaction and did not consider other health-related outcomes of the children. Client satisfaction is often biased by people’s own expectations of what constitutes good quality of care. Populations with low expectations are more likely to be satisfied with poor quality of care, undermining the demand side efforts to deliver high quality of care [27].
Our results have a number of policy implications. There was a poor association between structure and process composite indicator and client satisfaction. Other dimensions of quality of care that may influence client satisfaction should be included. The context within which healthcare is delivered is important for its quality [21]. There is also a need to improve health providers’ skills to carefully take the patient’s history and perform physical examination. This could be achieved through targeted training.
Conclusions
Hospitals and health centers scored higher than health posts in most of the equipment and infrastructure indicators as well as adherence to clinical guidelines. However, health posts and clinics score higher in some of the satisfaction items. Quality gaps were observed in assessments, examinations, and treatment provided to sick children. The study also revealed that satisfaction of clients in sick child services in Ethiopia was not associated with composite indicators of equipment, infrastructure, and adherence to clinical guidelines. These findings highlight the need to include the context of the health system, in addition to structural factors and process indicators that may influence quality of sick child care and client satisfaction.
Acknowledgements
We would like to acknowledge the Ethiopian Public Health Institute (EPHI) for allowing free access to the data.
Abbreviations
- AIC
Akaike’s information criterion
- BIC
Bayesian information criterion
- HEW
Health Extension Worker
- iCCM
Integrated Community Case Management
- IMCI
Integrated Management of Childhood Illnesses
- IMNCI
Integrated Management of Newborn and Childhood Illness
- ORS
Oral Rehydration Solution
- SARA
Service Availability and Readiness Assessment
- SPA+
Service Provision Assessment Plus Survey
- UNICEF
United Nations International Children’s Emergency Fund
- WHO
World Health Organization
Authors’ contributions
TG, SMA, MY, LAP, and DB conceptualized the design of the study. TG participated in data extraction, and analysis; TG, SMA, MY, LAP, and DB provided review of the methodology and analysis results; All authors contributed to the writing of this paper and all have read and approved the final manuscript.
Funding
This study used secondary data from Ethiopia SPA+ survey. No specific funding was received for the study.
Availability of data and materials
The Ethiopian Public Health Institute (EPHI) primarily collected the data for this manuscript. Interested researchers may contact the focal person, Mr. Abebe Bekele, Director of Health Systems and Reproductive Health Research directorate at the EPHI, Addis Ababa, Ethiopia, through email abebe1277belay@gmail.com.
Ethics approval and consent to participate
The original survey obtained ethical approval from the Scientific and Ethical Review Committee (SERC) of the Ethiopian Public Health Institute (EPHI). In addition, written consent was obtained from each mother or caretaker of sick children. Permission to access/use the data analyzed in this study was provided by the Ethiopian Public Health Institute (EPHI).
Consent for publication
Not Applicable.
Competing interests
The authors declare that they have no competing interests.
Footnotes
Publisher’s Note
Springer Nature remains neutral with regard to jurisdictional claims in published maps and institutional affiliations.
Solomon Mekonnen Abebe, Mezgebu Yitayal, Lars Åke Persson and Della Berhanu are co-authors.
Contributor Information
Theodros Getachew, Email: tedi.getachew@yahoo.com.
Solomon Mekonnen Abebe, Email: solomekonnen@gmail.com.
Mezgebu Yitayal, Email: mezgebuy@gmail.com.
Lars Åke Persson, Email: lars.persson@lshtm.ac.uk.
Della Berhanu, Email: della.berhanu@lshtm.ac.uk.
References
- 1.Dicker D, Nguyen G, Abate D, Abate KH, Abay SM, Abbafati C, et al. Global, regional, and national age-sex-specific mortality and life expectancy, 1950-2017: a systematic analysis for the global burden of disease study 2017. Lancet. 2018;392:1684–1735. doi: 10.1016/S0140-6736(18)31891-9. [DOI] [PMC free article] [PubMed] [Google Scholar]
- 2.Ruducha J, Mann C, Singh NS, Gemebo TD, Tessema NS, Baschieri A, et al. How Ethiopia achieved millennium development goal 4 through multisectoral interventions: a countdown to 2015 case study. Lancet Glob Heal [Internet] 2017;5(11):e1142–e1151. doi: 10.1016/S2214-109X(17)30331-5. [DOI] [PMC free article] [PubMed] [Google Scholar]
- 3.Mehretie Adinew Y, Feleke SA, Mengesha ZB, Workie SB. Childhood mortality: trends and determinants in Ethiopia from 1990 to 2015—a systematic review. Adv Public Heal. 2017:1–10.
- 4.Kruk ME, Gage AD, Joseph T, Danaei G, García-Saisó S, Salomon JA. Mortality due to low-quality health systems in the universal health coverage era: a systematic analysis of amenable deaths in 137 countries. 2018. p. 2203. [DOI] [PMC free article] [PubMed] [Google Scholar]
- 5.An G, English M, Ntoburi S, Wagai J, Mbindyo P, Opiyo N, et al. An intervention to improve paediatric and newborn care in Kenyan district hospitals : Understanding the context. Implement Sci. 2009;4(42). [DOI] [PMC free article] [PubMed]
- 6.Kruk ME, Gage AD, Arsenault C, Jordan K, Leslie HH, Roder-DeWan S, et al. High-quality health systems in the sustainable development goals era: time for a revolution. Lancet Glob Health. 2018;6(11):e1196–e1252. doi: 10.1016/S2214-109X(18)30386-3. [DOI] [PMC free article] [PubMed] [Google Scholar]
- 7.Shaw BI, Asadhi E, Owuor K, Okoth P, Abdi M, Cohen CR, et al. Perceived quality of Care of Community Health Worker and Facility-Based Health Worker Management of pneumonia in children under 5 years in Western Kenya : a cross-sectional multidimensional study. Am J Trop Med Hyg. 2016;94(5):1170–1176. doi: 10.4269/ajtmh.15-0784. [DOI] [PMC free article] [PubMed] [Google Scholar]
- 8.Kenya Ministry of Health . Integrated Community Case Management ( iCCM ), 2013–2018: monitoring and evaluation plan. 2018. [Google Scholar]
- 9.Miller NP, Amouzou A, Tafesse M, Hazel E, Legesse H, Degefie T, et al. Integrated community case Management of Childhood Illness in Ethiopia : implementation strength and quality of care. Am J Trop Med Hyg. 2014;91(2):424–434. doi: 10.4269/ajtmh.13-0751. [DOI] [PMC free article] [PubMed] [Google Scholar]
- 10.Ayanian JZ, Markel H, Ph D. Donabedian ’ s lasting framework for health care quality. N Engl J Med. 2016;375(3):205–207. doi: 10.1056/NEJMp1605101. [DOI] [PubMed] [Google Scholar]
- 11.Macarayan EK, Gage AD, Doubova SV, Guanais F, Lemango ET, Ndiaye Y, et al. Assessment of quality of primary care with facility surveys: a descriptive analysis in ten low-income and middle-income countries. Lancet Glob Heal [Internet] 2018;6(11):e1176–e1185. doi: 10.1016/S2214-109X(18)30440-6. [DOI] [PMC free article] [PubMed] [Google Scholar]
- 12.Gage AD, Kruk ME, Girma T, Lemango ET. The know-do gap in sick child care in Ethiopia. PLoS One. 2018;13(12):1–10. doi: 10.1371/journal.pone.0208898. [DOI] [PMC free article] [PubMed] [Google Scholar]
- 13.Ethiopia Service Provision Assessment Plus Survey 2014. Addis Ababa; 2014.
- 14.El Haj HI, Lamrini M, Rais N. Quality of care between Donabedian model and ISO9001V2008. Int J Qual Res. 2013;7(1):17–30. [Google Scholar]
- 15.WHO . Service Availability and Readiness Assessment ( SARA ) An annual monitoring system for service delivery Reference Manual. 2013. [Google Scholar]
- 16.World Health Organization and UNICEF. Handbook of IMCI integrated management of childhood illness: Africa health; 1996.
- 17.World Health Organization . IMCI Chart Booklet—Standard. Geneva (Switzerland): World Health Organization; 2014. [Google Scholar]
- 18.Krüger C, Heinzel-Gutenbrunner M, Ali M. Adherence to the integrated management of childhood illness guidelines in Namibia, Kenya, Tanzania and Uganda: Evidence from the national service provision assessment surveys. BMC Health Serv Res. 2017;13:17(1). doi: 10.1186/s12913-017-2781-3. [DOI] [PMC free article] [PubMed] [Google Scholar]
- 19.Boonstra E, Lindbæk M, Ngome E. Adherence to management guidelines in acute respiratory infections and diarrhoea in children under 5 years old in primary health care in Botswana. Int J Qual Health Care. 2005;17(3):221–227. doi: 10.1093/intqhc/mzi020. [DOI] [PubMed] [Google Scholar]
- 20.Rowe AK, Onikpo F, Lama M, Cokou F, Deming MS. Management of childhood illness at health facilities in Benin: problems and their causes. Am J Public Health. 2001;91(10):1625–1635. doi: 10.2105/AJPH.91.10.1625. [DOI] [PMC free article] [PubMed] [Google Scholar]
- 21.Leslie HH, Sun Z, Kruk ME. Association between infrastructure and observed quality of care in 4 healthcare services : A cross-sectional study of 4 , 300 facilities in 8 countries. PLoS Med. 2017;14(12):e1002464. doi: 10.1371/journal.pmed.1002464. [DOI] [PMC free article] [PubMed] [Google Scholar]
- 22.Persson LÅ. Bridging the quality chasm in maternal , newborn , and child healthcare in low- and middle-income countries. 2017. pp. 12–14. [DOI] [PMC free article] [PubMed] [Google Scholar]
- 23.Brizuela V, Leslie HH, Sharma J, Langer A, Tunçalp Ö. Measuring quality of care for all women and newborns: how do we know if we are doing it right? A review of facility assessment tools. Lancet Glob Health. 2019;7(5):e624–e632. doi: 10.1016/S2214-109X(19)30033-6. [DOI] [PubMed] [Google Scholar]
- 24.Das J, Sohnesen TP. Patient Satisfaction , Doctor Effort and Interview Location : Evidence from Paraguay. World Bank Policy Res Work Pap 4086. 2006:1–20.
- 25.Evans DK. Health - care quality and information failure : evidence from Nigeria. Health Econ. 2018;27(September 2017):e90–e93. doi: 10.1002/hec.3611. [DOI] [PubMed] [Google Scholar]
- 26.Dunsch F, Evans DK, Macis M, Wang Q. Bias in patient satisfaction surveys : a threat to measuring healthcare quality. BMJ Glob Health. 2018;3(e000694):1–5. doi: 10.1136/bmjgh-2017-000694. [DOI] [PMC free article] [PubMed] [Google Scholar]
- 27.Sanam R, Anna DG, Hirschhorn LR, Twum- NAY, Liljestrand J, Id KA, et al. Expectations of healthcare quality : a cross- sectional study of internet users in 12 low- and middle-income countries. PLoS Med. 2019;16(8):1–17. doi: 10.1371/journal.pmed.1002879. [DOI] [PMC free article] [PubMed] [Google Scholar]
Associated Data
This section collects any data citations, data availability statements, or supplementary materials included in this article.
Data Availability Statement
The Ethiopian Public Health Institute (EPHI) primarily collected the data for this manuscript. Interested researchers may contact the focal person, Mr. Abebe Bekele, Director of Health Systems and Reproductive Health Research directorate at the EPHI, Addis Ababa, Ethiopia, through email abebe1277belay@gmail.com.