Abstract
Background: A left ventricular aneurysm (LVA) occurs between 3.5% and 9.4% of all cases of acute myocardial infarction. A fragmented left sided QRS (RSR` pattern or its variant RSr`, rSR`, or rSr`) without evidence of bundle branch block (QRS duration ≤120 ms) on the ECG may be associated with a significant myocardial scar, which is the characteristic of a LVA. We, therefore, postulate that fragmented QRS (RSR` pattern or its variant) in the left sided leads (I, aVL, V3 to V6) may be a useful sign of LVA.
Methods: ECGs of 110 consecutive patients with LVA documented by left ventricular angiography (30° right anterior oblique view) was compared with 220 patients without LVA (110 patients with and 110 patients without coronary artery disease (CAD)), who were evaluated for CAD by symptoms and signs.
Results: The sensitivity of the fragmented QRS for identification of LVA was 50% (55 of 110 patients) and specificity was 94.6% (209 of 220). Within the study population, the positive predictive value of the fragmented QRS for LVA was 83.3% (55 of 66) and the negative predictive value was 79.2% (209 of 264). Based on the range of prevalence of LVA in postmyocardial infarction population (3.5–9.4%) and on observed sensitivity and specificity, the positive predictive value of fragmented QRS for LVA after infarction can be estimated at 29–53% and the negative predictive value can be estimated at 95–98%.
Conclusion: The sensitivity of fragmented QRS in left precordial leads for LVA was only 50%, whereas the specificity was 94.5%. It has a relatively low to moderate positive predictive value and high negative predictive value.
Keywords: left ventricular aneurysm, fragmented QRS
A left ventricular aneurysm (LVA) is defined as an area of thinned and dyskinetic left ventricular wall with a broad neck occurring frequently as a sequel of ischemic heart disease. 1 , 2 , 3 Rarely LVA may be associated with myocarditis (e.g., Chagas disease, Kawasaki disease), may be congenital, post‐trauma, or idiopathic. An LVA occurs between 3.5% and 9.4% of all cases of acute myocardial infarction. 4 , 5 , 6 , 7 About three quarters of these patients have triple vessel disease. 8 , 9 , 10 The wall of the LVA consists of fibrous tissue as well as necrotic myocardium with islands of viable but ischemic myocardium. These tissues serve as a substrate for ventricular arrhythmias in 15% of cases, which increases the risk of sudden and non‐sudden death by six‐fold when compared to patients with a comparable ejection fraction without LVA. 11 , 12 , 13 , 14 , 15 It may also cause significant loss of stroke volume and may be responsible for the congestive heart failure, which is encountered in half of these patients. Thus LVA is associated with significant morbidity and mortality.
A simple way to identify patients with LVA will be clinically useful. Various studies have shown that persistent ST elevation and presence of a prominent R wave in aVR serve as a marker of LVA. 16 , 17 , 18 , 19 , 20 , 21 , 22 , 23 , 24 However, the sensitivity and specificity of these findings are poor. Fragmentation of QRS with characteristic rSR` pattern or its variant (rSr` or rSR`) in left sided leads (V3 to V6, I, or aVL) has been suggested as a marker of LVA and myocardial scar formation, in a small group of patients as well as in computer models. 24 , 25 , 26 , 27 , 28 Various studies have also shown that alteration in QRS morphology is related to myocardial scar. Spectral analysis of the high‐frequency electrogram has also revealed increased notches or slurring in the electrogram following myocardial injury. 29 Similarly, wide band recording in patients with coronary artery disease (CAD) revealed an increased number of notches in the R wave and slurs in the S wave in patients with a myocardial scar. 30
The purpose of our study is to establish the sensitivity, specificity, and predictive values of fragmentation of QRS and to define the various types of QRS morphologies in a large group of patients with LVA.
METHODS
An LVA was defined as an outward bulging segment of left ventricular wall during systole. Of 1041 consecutive patients who underwent cardiac catheterization and coronary angiography for evaluation of CAD in our hospital, left ventricular angiography was obtained in 921 patients in a single plane, 30° right anterior oblique views. One hundred and ten patients had angiographic evidence of LVA (LVA and CAD). One hundred and ten consecutive patients who underwent cardiac catheterization for similar indications described above, in which CAD was present but there was no evidence of LVA, were selected as a control group (without LVA, but with CAD). One hundred ten consecutive patients without any obstructive coronary disease (<30% of coronary lesion) and without any history of myocardial infarction (no LVA and no CAD) were also added as a second control group to verify that the fragmentation of QRS as a sign was not associated with mere presence of CAD or myocardial infarction, but was associated with LVA. The ECGs of these patients were obtained. Various patterns of QRS fragmentation were observed. An RSR` pattern was defined as the presence of initial R wave followed by an S wave and a terminal positive deflection (R`) with QRS duration of ≤120 ms. The rSr` pattern (initial small r wave followed by S wave and an upstroke on the S wave) and RsR` (prominent R wave followed by a small down slope and terminal R) wave were defined as the variants of RSR` (1, 2, 3, 4, 5). Presence of ST segment elevation with or without RSR` pattern or fragmentation was also noted. The QRS morphology which qualified for typical bundle branch block was excluded from fragmented QRS group even if the duration was exactly 120 ms. The QRS duration of >120 ms was excluded from the fragmented QRS group even though they did not have typical bundle branch morphology (n = 3). It is because of no clear‐cut demarcation between bundle branch block and intraventricular conduction delays in a few of these EKGs. Patients with paced rhythm or poor quality of left ventricular angiogram were also excluded from the study.
Figure 1.
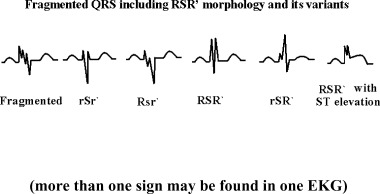
Different morphologies of RSR` pattern and its variants, and fragmentation of QRS associated with left ventricular aneurysm (more than one sign may be found in one EKG).
Figure 2.
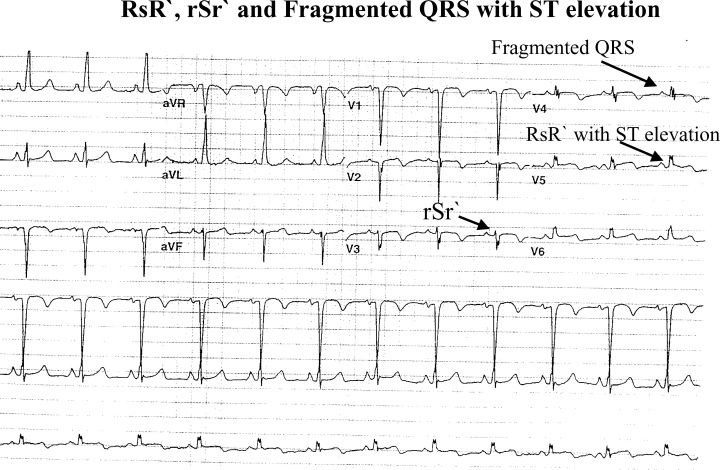
rSr` pattern in lead V3, fragmented QRS in lead V4, and RsR` in lead V5 (three signs of LV aneurysm in one EKG).
Figure 3.
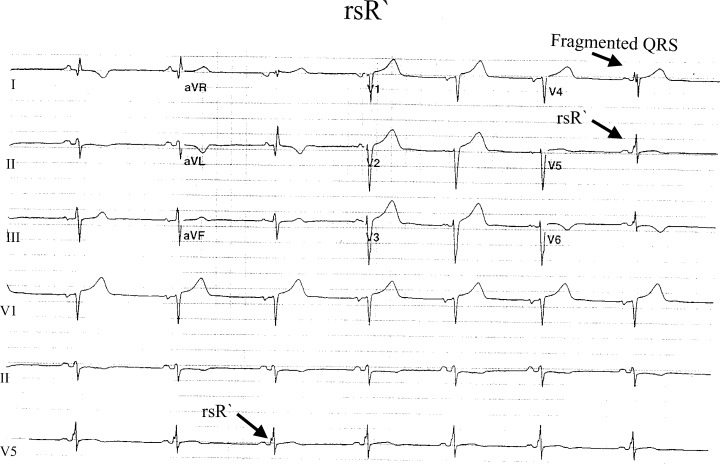
Fragmented QRS in lead V4 and rSR` pattern in lead V5.
Figure 4.
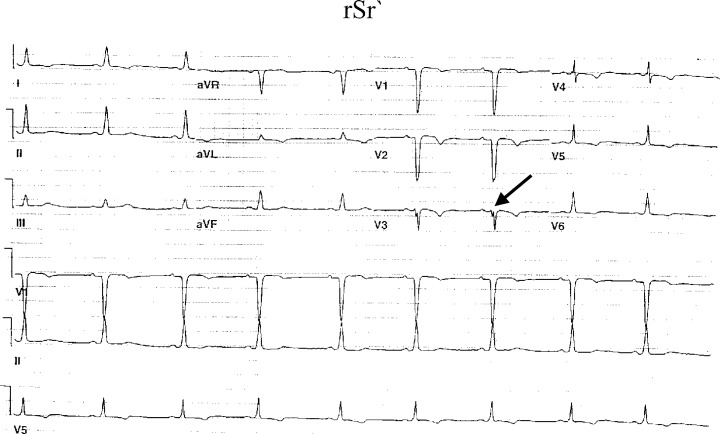
rSr` pattern in lead V3.
Figure 5.
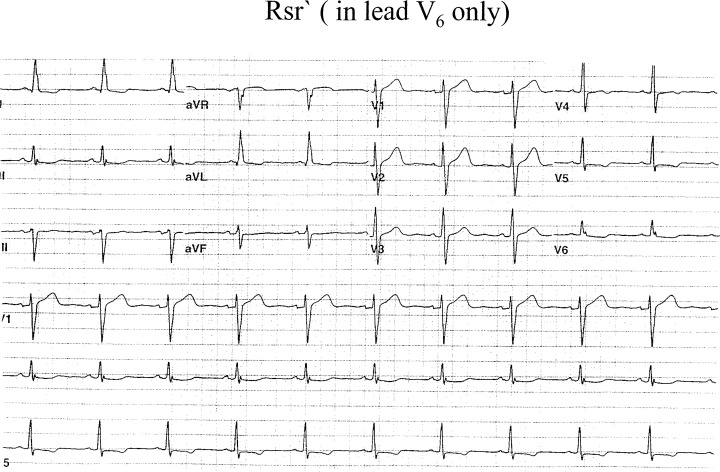
RSr` pattern in lead V6.
Performance of fragmented QRS in the left sided leads was derived from analysis of 110 patients with LVA and 220 patients without LVA (110 patients with CAD and 110 patients without CAD). Statistical analysis was performed utilizing the chi‐square test to compare the sensitivity and specificity of the ECG findings among patients with and without LVA. Knowing a prevalence range of 3.5–9.4%, 4 , 5 , 6 , 7 an estimate of the expected positive and negative predictive values of our findings in postmyocardial infarction patients can be calculated (Table 1).
Table 1.
Comparisons of ECG Findings in Patients with and without Left Ventricular Aneurysm (LVA) by Chi‐Square Test
| ECG Findings | Patients with LVA N = 110 | Control Group 1: Patients without LVA, but with CAD | Control Group 2: Patients with no LVA and no CAD | ||
|---|---|---|---|---|---|
| N = 110 | P Value | N = 110 | P Value | ||
| Fragmented QRS | 50 | 6 | <0.0001 | 5 | <0.0001 |
| Fragmented QRS + ST elevation | 5 | 0 | <0.0001 | 1 | <0.0001 |
| RBBB | 4 | 6 | NS | 4 | NS |
| LBBB | 2 | 3 | NS | 1 | NS |
| Paced rhythm | 4 | 4 | NS | 3 | NS |
| Without fragmentation of QRS or conduction abnormalities | 38 | 91 | <0.001 | 96 | <0.001 |
The first control group comprised patients with CAD and no LVA and the second control group comprised patients with no LVA and no CAD.
CAD = coronary artery disease; RBBB = right bundle branch block; LBBB = left bundle branch block.
RESULTS
The mean age in patients with LVA (N = 110) was 65 ± 11 years and without LVA (N = 220) was 67 ± 9 years (P = NS). The male:female ratio was comparable in patients with LVA (61 males; 55%) and without LVA (130 males; 59%). There was 96% concordance in ECG interpretation of fragmented QRS between the two independent reviewers blinded with the results of cardiac catheterization. Of 110 patients with LVA, 55 patients had a fragmented QRS (50 patients had fragmented QRS, and 5 patients had a fragmented QRS and ST‐segment elevation in V1 to V3) in at least one of the left sided leads. Whereas fragmented QRS was present in only 11 patients with no LVA (6 of 110 patients with CAD and 5 of 110 patients with no CAD, P = NS). The sensitivity of fragmentation of the QRS for LVA was only 50%, whereas the specificity was 94.5% in patients with CAD. The corresponding false‐negative and false‐positive rates were 50% and 5.4%, respectively. Within our study population, the positive predictive value of fragmented QRS of LVA was 83.3% (55 of 66 patients) and a negative predictive value was 79.2% (209 of 264 patients) (Table 2). Given the prevalence range of 3.5–9.4% for LVA in patients with history of myocardial infarction, 4 , 5 , 6 , 7 our sensitivity and specificity findings will result in an estimated positive predictive value of 29–53% and negative predictive value of 95–98%, for our fragmentation criterion within a typical population of postmyocardial infarction patients.
Table 2.
Comparisons of Fragmented QRS Pattern in Patients with and without Left Ventricular Aneurysm (LVA)
| Total Number of Patients Studied (N = 330) | LVA Present (N = 110) | LVA Absent (N = 220)a |
|---|---|---|
| Fragmented QRS present | 55 | 11 |
| (N = 66) | (True–positive) | (False‐positive) |
| Fragmented QRS absent | 55 | 209 |
| (N = 264) | (False‐negative) | (True‐negative) |
aPatients with CAD, but no LVA (N = 110) + patients with no CAD and no LVA (N = 110) documented by cardiac catheterization.
CAD = coronary artery disease; LVA = left ventricular aneurysm.
DISCUSSION
The autopsies of patients with LVA have shown significant myocardial necrosis with islands of viable myocardial tissue interspersed in abundant fibrous tissue. 26 This alters the ventricular depolarization, which is represented by fragmentation of QRS in the surface ECG. The vectorcardiogram studies in a small group of patients with RSR` patterns have revealed the presence of LVA or CAD with significant left ventricular scar formation. 31 , 32 , 33 , 34 , 35 The islands of chronically ischemic myocardium display slow activation as a result of partially depolarized and depressed action potential upstroke velocities. This is responsible for inhomogeneous activation of the left ventricle. 36 The endocardial mapping of the scar tissue in these patients also revealed fractionated electrograms over a wide area surrounding the myocardial scar. It has been suggested that the initial R wave deflection is seen due to a shifting of the QRS vector to the right and posteriorly as a result of early depolarization with relatively normal conduction through the upper septum and the right ventricle. 24 , 25 The notching or slurring in the S wave may represent the activation pattern in precordial leads (rightward to the transition zone) similar to the activation pattern in left bundle branch block. This view was supported in two of our patients with RSR` pattern, in which rate‐related left bundle branch aberrancy was noted. The amplitude of the terminal R wave depends on the degree of terminal leftward shift of depolarization. Thus, the terminal conduction delay of QRS forces arising from the area of conduction block or slowing, results in RSR` pattern of ventricular activation. The different morphologies of QRS on surface electrogram may represent various directions of myocardial activation pattern, depending on the amount and location of the scar tissue in the left ventricle.
The prognosis of patients with CAD with LVA is poor as compared to patients without LVA. 1 , 6 Thus, having an LVA represents a high‐risk group of patients with CAD. The ECG can be an important aid in risk stratification of patients. Sometimes, it may be the most readily accessible and inexpensive diagnostic modality to assess LVA. An echocardiogram is expensive and may not be able to assess wall motion abnormalities, especially in the circumapical region, in up to one‐fifth of these patients. 34 Previous studies have revealed that persistent ST elevation (>2 weeks after myocardial infarction) in the precordial leads mostly in V2 and V3≥2 mm as a less sensitive sign of LVA (44%). Its specificity is very low, as ST‐segment elevation may be encountered in many cardiac diseases. Goldberger's sign (R in aVR) also has very low sensitivity.
Our study applies to the patients who are clinically at risk of CAD by symptoms or signs, and who have fragmented QRS (RSR` or its variant) in left precordial leads, as a highly specific sign (95%) of LVA. It has a moderate calculated positive predictive value (29–54%) and a high calculated negative predictive value (95–98%) for identification of LVA in patients with CAD. The sensitivity of detecting LVA by ECG can be further raised if persistent ST‐segment elevation is added to the diagnostic criteria, as few patients display only the later changes in ECG.
CONCLUSION
Our study revealed that the fragmentation of QRS (RSR` pattern) in the left sided leads with QRS duration ≤120 ms in the ECG is a highly specific sign of an LVA. It has a relatively low to moderate positive predictive value and a high negative predictive value.
Acknowledgments
Acknowledgment: The authors greatly appreciate Dr. Paul Kligfield, Professor of Medicine, New York Presbyterian Hospital—Cornell University Medical College for guidance and valuable suggestions in preparation of this manuscript.
Published as an abstract: RSR` Pattern without the Evidence of Bundle Branch Block: Diagnostic Value as a Sign of Left Ventricular Aneurysm. J Am Coll Cardiol. 2001;37:1285.
REFERENCES
- 1. Mariotti R, Petronio AS, Robiglio L, et al Left ventricular aneurysm: Clinical and hemodynamic data. Clin Cardiol 1990;13(12):845 – 850. [DOI] [PubMed] [Google Scholar]
- 2. Castany R, Cerene A, Puel P. Left ventricular aneurysm resulting from myocardial infarction. J Cardiovas Surg 1974;18: 74 – 81. [PubMed] [Google Scholar]
- 3. Su X, Sekiguchi M, Endo M. An ultrastructural study of cardiac myocytes in postmyocardial infarction ventricular aneurysm representative of chronic ischemic myocardium using semiquantitative and quantitative assessment. Cardiovasc Pathol 2000;9(1):1 – 8. [DOI] [PubMed] [Google Scholar]
- 4. Friedman BM, Dunn MI. Postinfarction ventricular aneurysms. Clin Cardiol 1995;18(9):505 – 511. [DOI] [PubMed] [Google Scholar]
- 5. Grossi EA, Chinitz LA, Galloway AC, et al Endoventricular remodeling of left ventricular aneurysm. Functional, clinical, and electrophysiological result. Circulation 1995;92: 98 – 100. [DOI] [PubMed] [Google Scholar]
- 6. Greenwood WF, Aldrich HE, Wigle ED. The nature of the disorder of function in chronic postinfarction aneurysm of the left ventricle. Can Med Assoc J 1965;92: 611 – 614. [PMC free article] [PubMed] [Google Scholar]
- 7. Baron MG. Postinfarction aneurysm of the left ventricle. Circulation 1971;43: 762 – 769. [DOI] [PubMed] [Google Scholar]
- 8. Tada H, Kurita T, Ohe T, et al Clinical and electrophysiological features of idiopathic left ventricular aneurysm. With sustained ventricular tachycardia. Int J Cardiol 1998;67(1):27 – 38. [DOI] [PubMed] [Google Scholar]
- 9. Cabin HS, Clubb S, Vita N, et al Regional dysfunction by equilibrium radionuclide angiocardiography: A clinicopathologic study evaluating the relation of degree of dysfunction to the presence and extent of myocardial infarction. J Am Coll Cardiol 1987;10: 743 – 747. [DOI] [PubMed] [Google Scholar]
- 10. Weiner DA, McCabe C, Klein MD. ST segment changes postinfarction: Predictive value for multivessel coronary disease and left ventricular aneurysm. Circulation 1978;58: 887 – 891. [DOI] [PubMed] [Google Scholar]
- 11. Michelson EL, Spear JF, Moore EN. Electrophysiologic and anatomic correlates of sustained ventricular tachyarrhythmias in a model of chronic myocardial infarction. Am J Cardiol 1980;45: 583 – 590. [DOI] [PubMed] [Google Scholar]
- 12. De Bakker JMT, Van Capell FJL, Janse JM, et al Re‐entry as a cause of ventricular tachycardia in patients with chronic ischemic heart disease: Electrophysiologic and anatomic correlation. Circulation 1988;77: 589 – 606. [DOI] [PubMed] [Google Scholar]
- 13. Cassidy DM, Vassallo JA, Miller JM, et al Endocardial catheter mapping in patients in sinus rhythm: Relationship to underlying heart disease and ventricular arrhythmias. Circulation 1986;73: 645 – 652. [DOI] [PubMed] [Google Scholar]
- 14. Clark WH, Russell M. Recurrent ventricular tachycardia in association with ventricular aneurysm. Am J Cardiol 1973;31: 529 – 530. [DOI] [PubMed] [Google Scholar]
- 15. Sasaki Y, Furihata A, Suyama K. Endocardial fragmented electrogram and prediction of ventricular tachycardia by body surface signal‐averaged electrocardiographic mapping. Pacing Clin Electrophysiol 1995;18(8):1479 – 1486. [DOI] [PubMed] [Google Scholar]
- 16. Cooley DA, Collins HA, Morris GC. Ventricular aneurysm after myocardial infarction. J Am Med Assoc 1958;167: 557 – 560. [DOI] [PubMed] [Google Scholar]
- 17. Cohn K, Dymnicka S, Forlini FJ Jr. Use of electrocardiogram as an aid in screening for left ventricular aneurysm. J Electrocardiol 1976;9(1):53 – 58. [DOI] [PubMed] [Google Scholar]
- 18. Lindsay J Jr, Dewey RC, Talesnick BS, et al Relation of ST‐segment elevation after healing of acute myocardial infarction to the presence of left ventricular aneurysm. Am J Cardiol 1984;54: 84 – 86. [DOI] [PubMed] [Google Scholar]
- 19. Bhatnagar SK. Observations of the relationship between left ventricular aneurysm and ST segment elevation in patients with a first acute anterior Q wave myocardial infarction. Eur Heart J 1994;15: 1500 – 1504. [DOI] [PubMed] [Google Scholar]
- 20. Weiner DA, McCabe C, Klein MD. ST segment changes postinfarction: Predictive value for multivessel coronary disease and left ventricular aneurysm. Circulation 1978;58: 887 – 891. [DOI] [PubMed] [Google Scholar]
- 21. Fisch C. Electrocardiography and vectorcardiography In: Braunwald E, (ed.): Heart Disease. Vol. 1 3rd Edition. Philadelphia , WB Saunders, 1988, pp. 205 – 210. [Google Scholar]
- 22. Rothfeld B, Fleg JL, Gottlieb SH. Insensitivity of the electrocardiogram in apical myocardial infarction. Am J Cardiol 1984;53: 715 – 717. [DOI] [PubMed] [Google Scholar]
- 23. Cohn K, Dymnicka S, Forlini FJ. Use of the electrocardiogram as an aid in screening for left ventricular aneurysm. J Electrocardiol 1976;9(1):53 – 58. [DOI] [PubMed] [Google Scholar]
- 24. Philip V, Basil EC. The RSR` complex not related to right bundle branch block: Diagnostic value as a sign of myocardial infarction scar. Am Heart J 1992;123: 369. [DOI] [PubMed] [Google Scholar]
- 25. Sherif NE. The rsR` pattern in left surface leads in ventricular aneurysm. Br Heart J 1970;32: 440 – 448. [DOI] [PMC free article] [PubMed] [Google Scholar]
- 26. Lesh MD, Spear JF, Simon MB. A computer model of electrogram: What causes fractionation? J Electrocardiol 1988;21: S69 – S73. [DOI] [PubMed] [Google Scholar]
- 27. Flowers NC, Horan LG, Tolleson WJ, et al Localization of the site of myocardial scarring in man by high‐frequency components. Circulation 1969;40(6):927 – 934. [PubMed] [Google Scholar]
- 28. Flowers J, Horan H, Thomas J. Anatomical basis of high frequency components in electrogram. Circulation 1969;39: 531 – 539. [DOI] [PubMed] [Google Scholar]
- 29. Schick SR, Power TD. Spectral analysis of high frequency electrogram in contusive myocardial injury. Ann Biomed Eng 1978;(6):154 – 160. [DOI] [PubMed] [Google Scholar]
- 30. Langer PH, Geselowitz DB, Briller SA. Wide band recording of electrogram and coronary artery disease. Am Heart J 1973;86(3):308 – 317. [DOI] [PubMed] [Google Scholar]
- 31. Visser CA, Kan G, David GK, et al Echocardiographic cineangiographic correlation in detecting left ventricular aneurysm. A prospective study of 422 patients. Am J Cardiol 1982;50: 332 – 341. [DOI] [PubMed] [Google Scholar]
- 32. Wiener I, Mindich B, Pitchois R. Fragmental endocardial electrical activity in patients with ventricular tachycardia: A new guide to surgical therapy. Am Heart J 1984;107: 86 – 90. [DOI] [PubMed] [Google Scholar]
- 33. Gardner PJ, Ursell PC, Fenoglio JJ, et al Electrophysiologic and anatomic basis for fractionated electrograms recorded from healed myocardial infarcts. Circulation 1985;72: 596 – 611. [DOI] [PubMed] [Google Scholar]
- 34. LaCombe MA, Yu PN. Left ventricular aneurysm. J Maine Med Assoc 1979;70: 420 – 427. [PubMed] [Google Scholar]
- 35. Schlichter J, Hellerstein HK, Katz LN. Aneurysm of the heart: A correlative study of 102 proven cases. Medicine 1954;33: 43 – 86. [PubMed] [Google Scholar]
- 36. Friedman PL, Fenoglio JJ, Wit AL. Time course for reversal of electrophysiological and ultrastructural abnormalities in subendocardial Purkinje fibers surviving extensive myocardial infarction in dogs. Circ Res 1975;36: 127 – 144. [DOI] [PubMed] [Google Scholar]


