

Abstract
Background: Intravenous magnesium reduces the QTc interval of patients receiving ibutilide. Whether oral magnesium can reduce the QTc interval associated with oral sotalol and dofetilide is not known. This study was undertaken to evaluate the impact of oral magnesium on the QTc interval and whether an inherent intracellular magnesium deficiency exists among patients with arrhythmias.
Methods: Participants receiving sotalol or dofetilide for atrial or ventricular arrhythmias were randomized to receive magnesium l‐lactate (504 mg elemental magnesium daily, Niche Pharmaceuticals, Roanoke, TX) or placebo for 48 hours. A 12‐lead electrocardiogram (ECG) was obtained at baseline, 3 hours, and 51 hours after dosing to correspond to the Tmax after oral ingestion. The QTc interval was measured from the ECGs and compared between groups. Intracellular magnesium concentrations were determined by energy‐dispersive x‐ray analysis at baseline and 51 hours after dosing (Intracellular Diagnostics, Inc., Foster City, CA).
Results: The QTc interval reductions from baseline were greater in the magnesium group than placebo at 3 and 51 hours (P = 0.015 and P < 0.001, respectively). Sixty‐three percent of patients (regardless of experimental group) had baseline intracellular magnesium concentrations below the normal reference range of 33.9–41.9 mEq/IU, with an average level of 32.6 ± 2.2 mEq/IU.
Conclusions: Oral magnesium l‐lactate raises intracellular magnesium concentrations and lowers the QTc interval of patients receiving sotalol or dofetilide.
Keywords: magnesium, arrhythmia, QTc interval, sotalol, dofetilide
Dofetilide and sotalol are Vaughn–Williams Class III antiarrhythmic agents that inhibit the rapid component of the delayed potassium rectifier channel (IKr), resulting in prolongation of ventricular action potential duration. 1 This is detected clinically as a prolongation of the QTc interval on the electrocardiogram (ECG), which increases the risk of developing torsade de pointes (TdP). 1 , 2 , 3 Sotalol and dofetilide increase the QTc interval and risk of TdP in a dose dependent fashion with an overall TdP occurrence in 1–4% of patients. 1 , 2 , 3 , 4 , 5 These safety concerns limit the use of sotalol and dofetilide. 2 , 3 , 4 , 5 , 6
The Atrial Fibrillation Follow‐Up Investigation of Rhythm Management (AFFIRM) Trial compared antiarrhythmic therapy (66% of patients on the QTc interval prolonging drugs) to rate control therapy with negative dromotropic agents. Even though the rhythm control group had a 67% improvement in maintenance of sinus rhythm, the risk of TdP and hospitalizations were respectively, 75% and 9% higher, compared to the rate control group. 7 This suggests that adjunctive therapy to reduce the toxicity of Class III antiarrhythmic drugs is needed.
Magnesium is an intracellular divalent cation. In a rabbit trial, the addition of intravenous magnesium sulfate to the Class III antiarrhythmic agent clofilium reduced the risk of TdP by 80% as compared to placebo. 8 In patients with atrial fibrillation receiving the Class III antiarrhythmic agent ibutilide, intravenous magnesium attenuated the average QTc interval increase by over 50 ms as compared to placebo. 9 In a multicenter cohort study, adjuvant intravenous magnesium therapy nonsignificantly reduced the incidence of ventricular tachyarrhythmias by 33%, although it was grossly underpowered to detect a significant difference. 10 While data with intravenous magnesium is promising, oral magnesium's impact on the QTc interval is not known.
It is not currently known if patients requiring antiarrhythmic treatment have intracellular deficiencies of key elements such as magnesium, phosphorus, chloride, calcium, potassium, and sodium. If innate deficiencies do exist, then supplementation may be warranted.
Unlike most available oral formulations, with a bioavailability of only 3%, magnesium l‐lactate is an extended release oral formation with a bioavailability of 41% and a low risk of gastrointestinal side effects. 11 This study was designed to evaluate whether oral magnesium l‐lactate can attenuate the QTc interval increases associated with oral sotalol and dofetilide. Secondarily, we sought to determine if a deficiency in magnesium or other essential elements occurs in patients requiring antiarrhythmic therapy.
METHODS
Patient Population
This was a randomized, double‐blind, placebo‐controlled study approved by the Hartford Hospital institutional review board with written informed consent. Given the known baseline differences in the QTc intervals among men and women, each gender was randomized separately using stratified allocation.
Patients taking dofetilide or sotalol therapy for at least 5 half‐lives were eligible for inclusion. Patients were excluded for the following reasons: (1) hypersensitivity to magnesium l‐lactate, (2) use of magnesium supplementation within 48 hours prior to randomization, (3) use of any of the following agents: verapamil, trimethoprim/sulfamethoxazole, prochlorperazine, cisapride, megestrol, cimetidine, triamterene, macrolides, fluororquinolones, sodium polystyrene, diltiazem, nefazodone, azole antifungals, quinine, zafirlukast, select serotonin reuptake inhibitors, protease inhibitors, metformin, tricyclic antidepressants, or phenothiazines, or (4) use of amiodarone within 3 months of randomization.
Drug Administration and Electrocardiographic Evaluation
Patients received 3 tablets of magnesium l‐lactate (252 mg of Mag‐Tab SR; Niche Pharmaceuticals, Roanoke, TX) or matching placebo every 12 hours for 3 doses.
A 12‐lead ECG was recorded at 25 mm/s at rest prior to initiation of treatment (i.e., baseline) and at 3 and 51 hours after the first dose of magnesium for each patient. The ECGs were recorded at this time because the maximum magnesium concentration in the serum occurs 3 hours after administration. A single‐blinded investigator read all ECGs using a precision ruler of 0.5 mm scale (Schlaedler‐Quinzel, Inc., Parsippany, NJ). 12
QT intervals were measured from the onset of the Q wave (or R/S wave if there was no Q wave) to the end of the T wave, where it merges with the isoelectric baseline. The beginning and end of the QRS complex were determined by visual inspection, whereas the end of the T wave was obtained by extrapolating the descending slope of the T wave to the isoelectric baseline. When a U wave interrupts the down‐sloping of the T wave, the visible portion of the T wave was extrapolated to the T–P baseline to define the end of the T wave. The R–R interval was measured from the peak of one R wave to the peak of an adjacent R wave. The QTc interval was corrected for heart rate using Bazett's formula [QTc = QT/(RR)1/2] and the linear correction formula [QTc = QT + (1.54 × (1 − RR))].
To assess transmural dispersion of repolarization (TDR), the QT peak was measured in a precordial lead and then subtracted from the QT interval to determine the Tpeak–Tend interval. 13 The fraction of the QT interval represented by Tpeak–Tend (Fpe) was also calculated via the formula [Fpe = Tpe/QT]. 14 Both Tpeak–Tend and Fpe were determined at baseline and 51 hours.
Intracellular Magnesium Concentrations
Buccal scrape tissue samples were obtained from a subgroup of participants prior to initiation of the study therapy and following the third dose of magnesium using EXATEST kits (Intracellular Diagnostics, Inc., Foster City, CA). Samples were analyzed for intracellular concentrations of magnesium, phosphorus, chloride, calcium, potassium, and sodium.
Statistical Analysis
Continuous data were expressed as mean ± SD. A P value less than 0.05 was considered statistically significant. The primary analysis was the intergroup comparisons of the change in the QTc interval from baseline at 3 and 51 hours using Bazett's formula. The change from baseline at 3 and 51 hours for the QT interval and the QTc interval using the linear corrected formula were secondary analyses. Evaluations of the QRS, QT, RR, and QTc intervals were compared between groups at each time period as well. Mann–Whitney tests were used for all statistical analyses of continuous ECG data. Intracellular element comparison within groups were performed with a paired t‐test. Chi‐square test or Fischer's exact test was used for categorical comparisons. Statistical analysis was performed using SPSS version 11.0.
RESULTS
Total Population
Thirty‐four patients were enrolled into the study. Three were subsequently excluded because the antiarrhythmic drug the patient was using or the dose of the patient's antiarrhythmic drug changed during the study (n = 2 in the magnesium group and n = 1 in the placebo group), while one patient in the magnesium group withdrew because of diarrhea.
Patients completing the study (n = 30) had similar baseline characteristics (Table 1). The ECG interval comparisons are presented in Figure 1 and Table 2. The QTc interval (Bazett's and linear corrected) reductions from baseline were greater in the magnesium group than the placebo group at 3 hours (P = 0.015 and P = 0.076, respectively). By 51 hours, the QTc interval (Bazett's and linear corrected) reductions from baseline were still greater in the magnesium group than the placebo group (P < 0.001 and P = 0.038, respectively). The QT interval change from baseline comparisons mirrored that of the QTc interval changes using the linear corrected method and showed greater reductions in the magnesium group than the placebo group at 3 hours (P = 0.076) and 51 hours (P = 0.032).
Table 1.
Patient Demographic Comparison
| Magnesium (n = 14) | Placebo (n = 16) | P Value | |
|---|---|---|---|
| Gender (% male) | 13 (92.9) | 14 (87.5) | 0.903 |
| Age (years) | 66.5 ± 12.5 | 72.1 ± 7.3 | 0.138 |
| Sotalol (%) | 10 (71.4) | 12 (75.0) | 0.847 |
| Dofetilide (%) | 4 (29.6) | 4 (25.0) | 0.847 |
| Hypercholesterolemia (%) | 9 (64.3) | 7 (43.8) | 0.448 |
| Diabetes (%) | 3 (21.4) | 2 (12.5) | 0.642 |
| Coronary Dx (%) | 11 (78.6) | 12 (75.0) | 0.840 |
| Heart failure (%) | 5 (35.7) | 2 (12.5) | 0.286 |
| AF/AFL Hx (%) | 4 (28.6) | 9 (56.3) | 0.316 |
| VT/VF Hx (%) | 13 (92.9) | 11 (68.8) | 0.234 |
| Diuretics (%) | 7 (50.0) | 7 (43.8) | 0.980 |
| ACEI/ARB (%) | 8 (57.1) | 9 (56.3) | 0.749 |
| Beta‐blocker (%) | 8 (57.1) | 6 (37.5) | 0.478 |
ACEI = ACE inhibitor; AF = atrial fibrillation; AFL = atrial flutter; ARB = angiotensin II receptor blocker; Dx = disease; Hx = history.
Figure 1.
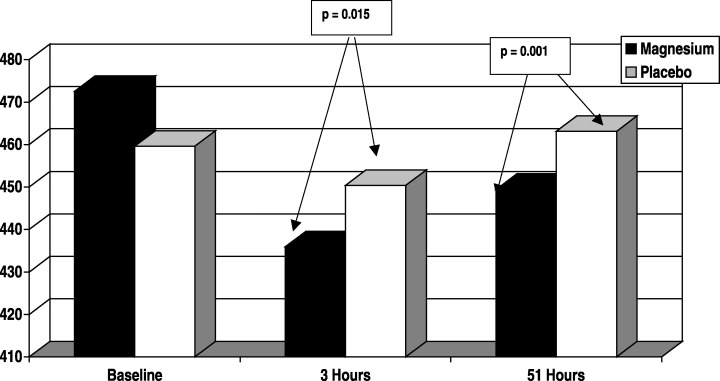
QTc interval analysis (Bazett's). This figure shows the QTc interval effects, as assessed with Bazett's formula, over time. The QTc intervals were similar at baseline. There is a shortening of the QTc interval occurring with magnesium therapy (black bar) at 3 and 51 hours, which is not evident in the placebo group (white bars).
Table 2.
Electrocardiographic Comparison
| (Units in ms) | Magnesium (n = 14) | Placebo (n = 16) | P Value |
|---|---|---|---|
| QRS interval baseline | 134.4 ± 41.9 | 138.4 ± 28.4 | 0.756 |
| QRS interval, 3 hours | 143.6 ± 41.7 | 131.9 ± 32.5 | 0.510 |
| QRS interval, 51 hours | 130.3 ± 43.9 | 136.6 ± 27.3 | 0.696 |
| QT interval baseline | 430.5 ± 38.1 | 446.9 ± 35.6 | 0.240 |
| QT interval, 3 hours | 415.2 ± 40.1 | 444.6 ± 35.3 | 0.076 |
| QT interval, 51 hours | 414.3 ± 40.9 | 446.0 ± 35.7 | 0.032 |
| RR interval baseline | 848.0 ± 163.9 | 964.5 ± 193.9 | 0.088 |
| RR interval, 3 hours | 829.5 ± 111.1 | 952.8 ± 144.3 | 0.749 |
| RR interval, 51 Hours | 868.2 ± 117.6 | 943.0 ± 152.5 | 0.245 |
| QTc (linear corrected) baseline | 430.8 ± 38.0 | 447.0 ± 35.4 | 0.257 |
| QTc (linear corrected), 3 hours | 415.5 ± 40.1 | 444.7 ± 35.3 | 0.076 |
| QTc (linear corrected), 51 hours | 413.0 ± 40.9 | 444.6 ± 35.6 | 0.038 |
P values at baseline were based on intergroup comparisons, while P values at 3 and 48 hours were based on the change from baseline intergroup comparisons.
Magnesium demonstrated a nonsignificant 8‐ms reduction in the Tpeak–Tend interval from baseline at the 51‐hour time point (77.50 ± 28.024 ms vs 69.17 ± 22.454 ms; P = 0.293), but no change occurred in the placebo group (77.29 ± 24.304 ms baseline vs 78.65 ±19.816 ms; P = 0.816). Similarly, magnesium demonstrated a nonsignificant reduction in Fpe from baseline at 51 hours (0.1823 ± 0.06049 vs 0.1592 ± 0.03960; P = 0.177), while no reduction was seen in the control group (0.1756 ± 0.05052 vs 0.1809 ± 0.04549; P = 0.746).
The changes in QRS and RR intervals from baseline were not different between the magnesium group and the placebo group at 3 hours (P = 0.510 and P = 0.749, respectively) or 51 hours (P = 0.696 and P = 0.245, respectively).
Intracellular concentrations of essential elements were available for 19 subjects. Overall, 63.2% of patients (regardless of experimental group) had baseline intracellular magnesium concentrations below the normal reference range of 33.9–41.9 mEq/IU, with an average level of 32.6 ± 2.2 mEq/IU. All of the other baseline intracellular elements evaluated (i.e., phosphorus, chloride, calcium, potassium, and sodium) were within the reference range, although phosphorus was at the top of the range (average = 16.7 ± 2.8 mEq/IU with a reference range of 14.2–17.0 mEq/IU).
After magnesium supplementation, the intracellular magnesium concentrations rose significantly (P = 0.002) with all patients achieving a concentration within the normal reference range (Fig. 2). After placebo was given, intracellular magnesium concentrations were unchanged (P = 0.320). No change occurred with the other elements after magnesium or placebo administration (Table 3).
Figure 2.
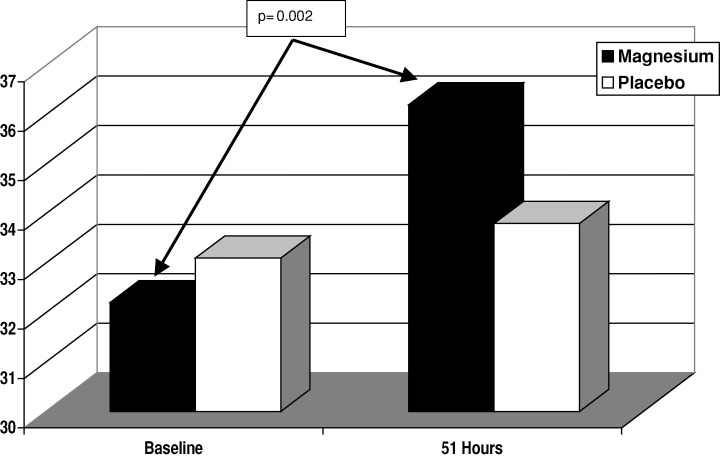
Intracellular magnesium concentration. This figure shows the intracellular magnesium concentrations at baseline and after 51 hours of oral magnesium supplementation. In the magnesium group (black bar), there is an increase in intracellular magnesium, which is not evident in the placebo group (white bars).
Table 3.
Intracellular Elemental Concentration Comparison
| (Units in mEq/IU) | Baseline | Post‐Dosing | P Value |
|---|---|---|---|
| Magnesium group (n = 10) | |||
| Magnesium | 32.2 ± 2.2 | 36.2 ± 2.4 | 0.002 |
| Phosphorus | 15.9 ± 2.2 | 16.5 ± 1.7 | 0.926 |
| Chloride | 4.5 ± 1.4 | 3.9 ± 0.6 | 0.350 |
| Calcium | 4.2 ± 0.4 | 4.3 ± 0.6 | 0.965 |
| Potassium | 119.1 ± 22.2 | 96.7 ± 20.4 | 0.116 |
| Sodium | 4.4 ± 0.8 | 4.1 ± 0.4 | 0.348 |
| Placebo group (n = 9) | |||
| Magnesium | 33.1 ± 2.2 | 34.1 ± 1.6 | 0.320 |
| Phosphorus | 17.5 ± 3.3 | 16.1 ± 1.5 | 0.112 |
| Chloride | 4.1 ± 1.4 | 3.8 ± 0.6 | 0.450 |
| Calcium | 5.2 ± 2.4 | 3.9 ± 0.4 | 0.199 |
| Potassium | 129.4 ± 46.8 | 113.2 ± 29.6 | 0.246 |
| Sodium | 4.0 ± 0.5 | 3.9 ± 0.4 | 0.252 |
In addition to the patient who withdrew secondary to diarrhea, another patient reported “loose bowels,” but this was said to be mild and did not negatively impact the patient.
Diuretic Use Subanalysis
Overall, about 47% of patients received diuretics. When the QTc intervals (Bazett's) were compared at baseline, 3 hours, and 51 hours between those receiving diuretics and those without diuretics (regardless of study drug randomization), no differences were noted.
In the group receiving diuretics, those randomized to the magnesium group had significant reductions in the QTc interval (Bazett's) as compared to those receiving placebo at 3 hours (51.1 ± 42 vs 10.7 ± 20.1 ms, P = 0.036, respectively). At 51 hours, the magnesium group had a 24.7 ± 24.3 ms reduction, while the placebo group had a 2.1 ± 12.4 ms increase, P = 0.011). In the group not receiving diuretics, the QTc intervals were reduced from baseline by 25.5 ± 27.9 and 26.2 ± 27.4 ms in the magnesium group at 3 and 51 hours, respectively, and were increased by 3.1 ± 22.2 and 4.6 ± 17.4 ms in the placebo group at 3 and 51 hours (P = 0.078 and P = 0.027, respectively). Qualitatively, greater reductions in the QTc interval (Bazett's) occurred at 3 hours in the magnesium group (P = 0.220) with diuretic therapy as compared to those without diuretics, but no difference between the magnesium groups occurred at 51 hours (24.7 ± 24.3 vs 26.2 ± 27.4 ms, respectively, P = 0.919).
Among those receiving diuretics, there were QTc interval (linear corrected) reductions of 29.5 ± 32.4 ms in the magnesium group and increases of 8.4 ± 18.1 ms in the placebo group at 3 hours (P = 0.028). At 51 hours, a reduction of 17.1 ± 21.8 ms occurred in the magnesium group as compared to a 1.8 ± 9.6 ms increase in the placebo group (P = 0.029). Among those without diuretics, the QTc intervals were reduced with both magnesium and placebo from baseline at 3 hours (13.3 ± 11.5 vs 13.7 ± 29.6 ms, respectively, P = 0.976) and 51 hours (18.5 ± 18.5 vs 8.836.6 ms, respectively, P = 0.544).
Baseline intracellular magnesium concentrations were not different among those receiving or not receiving diuretics (33.0 ± 2.2 vs 32.1 ± 2.4 ms, respectively, P = 0.468).
DISCUSSION
In this study, patients with arrhythmias requiring treatment with sotalol or dofetilide had a baseline intracellular deficiency in magnesium, which was not explained by diuretic use. Use of magnesium l‐lactate corrected the deficiency at the 51‐hour time point. Other essential elements did not show tissue abundance or deficiency, although average intracellular phosphorus measured toward the top of the normal reference range.
Magnesium l‐lactate therapy reduced the Bazett's calculated QTc interval by 37 ms at 3 hours post‐dosing (corresponding to the expected maximal serum concentrations (Cmax) of the product) and 26 ms at 51 hours. Given the quick onset of appreciable QTc interval reductions with magnesium l‐lactate, acute use of the oral product in a patient at risk for TdP may be possible and would obviate the need for intravenous access. While the QTc interval reductions at 51 hours suggest that the effectiveness of magnesium may be waning over time, this is likely reflective of the impact of heart rate on Bazett's calculation of the QTc interval. Use of the linear corrected QTc interval formula showed uniform QTc interval reductions at 3 and 51 hours. The reduction in QTc interval shown in our study correlates with previous work from animal and ionic–metabolic models showing reductions in cytosolic free Mg2+ to be associated with significantly prolonged action potential durations. 15 , 16
According to the Long QT Syndrome Registry, there is a direct relationship between the degree of QTc interval prolongation and ventricular arrhythmic events (probable QTc prolongation‐related syncope or sudden cardiac death) as expressed by the formula [hazard ratio = 1.052X, where x = the increase in QTc interval in ms]. 17 As such, if a 26‐ms chronic suppression of the QTc interval could be achieved, a 3.7‐fold reduction in risk would result.
Adjunctive magnesium therapy may reduce the risk of toxicity and enhance efficacy as well. Intravenous magnesium sulfate has been shown to attenuate the QTc interval increases associated with the Class III agent ibutilide among patients with atrial fibrillation or flutter while also enhancing the ability to convert the rhythm back to normal sinus. 9 , 10 Whether this predicts enhanced maintenance of normal sinus rhythm among subjects with atrial or ventricular arrhythmia histories is not known and requires further study. However, the need for an adjunctive therapy to reduce toxicity and enhance efficacy of antiarrhythmic agents is clearly evident. In the landmark multicenter AFFIRM trial, antiarrhythmic therapy enhanced the maintenance of sinus rhythm among patients with atrial fibrillation by 67%, but was associated with more hospitalizations and a greater risk of TdP versus negative dromotropic therapy alone. 7
Although our study was not powered to evaluate Tpeak–Tend or Fpe, we did show trends toward benefits with oral magnesium supplementation that did not occur with placebo. Tpeak–Tend and Fpe analyses are useful to determine if the QT interval reductions were due to reductions in the last portion of the T wave or elsewhere in the ECG segment. Shortening these variables suggest a reduction in the ventricular electrical vulnerable period where cells are no longer absolutely refractory to another depolarization and may be more important than shortening other parts of the QT interval. While our Tpeak–Tend and Fpe results are encouraging, subsequent study with larger sample size would provide the increased power needed to gain a better understanding of magnesium's impact on TDR.
This study is limited by short treatment duration and a primary focus on the surrogate endpoint of QTc interval prolongation. Over a thousand subjects would be needed to truly know the impact of magnesium on TdP. This study did not evaluate efficacy, was not powered to evaluate efficacy, and was not of long enough duration to evaluate efficacy. Although intravenous magnesium studies evaluating antiarrhythmic efficacy are encouraging, the impact on efficacy is not known.
CONCLUSIONS
Combining magnesium l‐lactate with sotalol or dofetilide reduces the QTc interval significantly in the short term. A baseline deficiency in intracellular magnesium and not other essential elements such as calcium, potassium, and sodium suggest that there may be need for chronic magnesium supplementation in this population. Long‐term studies evaluating the QTc interval and the effectiveness of therapy are warranted.
The study was supported by a Hartford Hospital Research Endowment. Niche Pharmaceuticals, Roanoke, TX provided drug with matching placebo, while Niche Pharmaceuticals and Intracellular Diagnostics, Inc., Foster City, CA provided intracellular electrolyte determinations.
REFERENCES
- 1. Mc Evoy GK, ed. American Hospital Formulary Service Drug Information. Bethesda , American Society of Health‐Systems Pharmacists, 2002; 1529 – 1530. [Google Scholar]
- 2. Bednar MM, Harrigan EP, Anziano RW, et al. The QT interval. Prog Cardiovasc Dis 2001;104: 43: 1 – 45. [DOI] [PubMed] [Google Scholar]
- 3. Lahmann MH, Hardy S, Archibald D, et al. Sex differences in risk of torsade de pointes with d,l‐sotalol. Circulation 1996;94: 2534 – 2541. [DOI] [PubMed] [Google Scholar]
- 4. Torp‐Pedersen C, Moller M, Bloch‐Thompsen PE, et al., for the Danish Investigators of Arrhythmia and Mortality on Dofetilide Study Group . Dofetilide in patients congestive heart failure and left ventricular dysfunction. N Engl J Med 1999;341: 857 – 865. [DOI] [PubMed] [Google Scholar]
- 5. Pedersen OD, Bagger H, Keller N, et al Efficacy of dofetilide in the treatment of atrial fibrillation with reduced left ventricular function: A Danish investigation of arrhythmia and mortality on dofetilide (DIAMOND) substudy. Circulation 2001;104: 292 – 296. [DOI] [PubMed] [Google Scholar]
- 6. Brendrop B, Elming H, Jun L, et al. QTc interval as a guide to select those patients with congestive heart failure and reduced left ventricular systolic function who will benefit from antiarrhythmic treatment with dofetilide. Circulation 2001;103: 1422 – 1427. [DOI] [PubMed] [Google Scholar]
- 7. The AFFIRM Investigators . A comparison of rate control and rhythm control in patients with atrial fibrillation. N Engl J Med 2002;347: 1825 – 1833. [DOI] [PubMed] [Google Scholar]
- 8. White CM, Xie J, Chow MSS, et al. Prophylactic magnesium to decrease the arrhythmogenic potential of Class III antiarrhythmic agents in a rabbit model. Pharmacotherapy 1999;19: 635 – 640. [DOI] [PubMed] [Google Scholar]
- 9. Caron MF, Kluger J, Tsikouris JP, et al. The effects of intravenous magnesium sulfate on the QT interval in patients receiving ibutilide. Pharmacotherapy 2003;23: 296 – 300. [DOI] [PubMed] [Google Scholar]
- 10. Kalus JS, Spencer AP, Tsikouris JP, et al. Impact of prophylactic intravenous magnesium on the efficacy of ibutilide for conversion of atrial fibrillation or flutter. Am J Health Syst Pharm 2003;60: 2308 – 2312. [DOI] [PubMed] [Google Scholar]
- 11. Mag‐Tab SR (Magnesium l‐Lactate) package insert. Roanoke , TX , Niche Pharmaceuticals, 2002. [Google Scholar]
- 12. Tran HT, Fan C, Tu WQ, et al. QT measurement, a comparison of three simple methods. Ann Noninvasive Electrocardiol 1998;3: 228 – 231. [Google Scholar]
- 13. Antzelevitch C, Shimizu W, Yan GX, et al. Cellular basis for QT dispersion. J Electrocardiol 1998;30(Suppl.):168 – 175. [DOI] [PubMed] [Google Scholar]
- 14. Yamaguchi M, Shimizu M, Ino H, et al. T wave peak‐to‐end interval and QT dispersion in acquired long QT syndrome: A new index for arrhythmogenicity. Clin Sci (Lond) 2003;150: 671 – 676. [DOI] [PubMed] [Google Scholar]
- 15. Wei SK, Hanlon SU, Haigney MCP. Beta‐adrenergic stimulation of pig myocytes with decreased cytosolic free magnesium prolongs the action potential and enhances triggered activity. J Cardiovasc Electrophysiol 2002;13: 587 – 592. [DOI] [PubMed] [Google Scholar]
- 16. Michailova AP, Belik ME, McCulloch AD. Effects of magnesium on cardiac excitation–contraction coupling. J Am Coll Nutr 2004;23: 514S – 517S. [DOI] [PubMed] [Google Scholar]
- 17. Moss AJ, Schwartz PJ, Crampton RS, et al. The long QT syndrome: Prospective longitudinal study of 328 families. Circulation 1991;84: 1136 – 1144. [DOI] [PubMed] [Google Scholar]