

Abstract
Quantification of cell-secreted molecules, e.g., cytokines, is fundamental to the characterization of immune responses. Cytokine capture assays that use engineered antibodies to anchor the secreted molecules to the secreting cells are widely used to characterize immune responses because they allow both sensitive identification and recovery of viable responding cells. However, if the cytokines diffuse away from the secreting cells, non-secreting cells will also be identified as responding cells. Here we encapsulate immune cells in microfluidic droplets and perform in-droplet cytokine capture assays to limit the diffusion of the secreted cytokines. We use microfluidic devices to rapidly encapsulate single natural killer NK-92 MI cells and their target K562 cells into microfluidic droplets. We perform in-droplet IFN-γ capture assays and demonstrate that NK-92 MI cells recognize target cells within droplets and become activated to secrete IFN-γ. Droplet encapsulation prevents diffusion of secreted products to neighboring cells and dramatically reduces both false positives and false negatives, relative to assays performed without droplets. In a sample containing 1% true positives, encapsulation reduces, from 94% to 2%, the number of true-positive cells appearing as negatives; in a sample containing 50% true positives, the number of non-stimulated cells appearing as positives is reduced from 98% to 1%. After cells are released from the droplets, secreted cytokine remains captured onto secreting immune cells, enabling FACS-isolation of populations highly enriched for activated effector immune cells. Droplet encapsulation can be used to reduce background and improve detection of any single-cell secretion assay.
Keywords: Droplet microfluidics, cytokine secretion, immune cell activation, cytokine capture assay, cell sorting
Graphical Abstract
In-droplet cytokine capture assays combined with FACS to accurately identify and isolate activated immune cells.
Introduction:
Fine characterizations of immune responses require isolation of individual immune cells that in most cases are rare1. For example, the human immune system produces a diverse repertoire of T cells, and only a fraction of these can recognize and help clear infected and mutant cells2,3,4. This recognition is governed by specific interaction between receptors on the surface of T cells (T Cell Receptors - TCRs) and peptides displayed on the MHC (Major Histocompatibility Complex) of potential target cells5. Because most T cells express numerous copies of the same TCR, the isolation of T cells4,6 coupled with identification of the genes encoding the expressed TCR7,8, is thus crucial in the study of infection, autoimmune disorders and cancer9.
Several methods are currently used to isolate these rare cells. Fluorescent MHC-tetramers10,11,12, produced recombinantly to display an antigenic peptide in a soluble, tetrameric MHC-complex, allow efficient labeling and FACS (Fluorescence Activated Cell Sorting) isolation of antigen-specific T cells, but can only be used when the target peptide is known. Cells labeled with fluorescent antibodies directed against activation-related surface markers13,14 can also be isolated by FACS15; however, these markers are often displayed transiently or at low levels during T cell activation, limiting their utility16. Alternatively, fixed, permeabilized T cells can be stained with antibodies directed against molecules such as IFN-γ, IL-2, and TNF-α, known markers for activation17,18,19, or they can be labeled with fluorescent nucleic acid probes targeting mRNA encoding these activation markers20 and then isolated by FACS. However, the fixation kills the cells and reduces efficiency of the reverse transcription step required for gene retrieval, limiting use and analysis of isolated cells19. High-throughput single-cell secretion assays have been performed in micro-engraved wells21, showing great potential; but cell retrieval is relatively slow, limiting throughput. Cytokine capture assays22,23,24 use antibody-based capture reagents to physically link NK-92 MI secreted cytokines to the secreting cell. These cells are then identified with an appropriate fluorescent anti-cytokine antibody to allow FACS of the activated T cells. These systems are straightforward and take advantage of the high sorting rates possible with FACS instruments; however, as there is no barrier to prevent cross contamination between secreting and non-secreting immune cells, the false positive and false negative rates can be unacceptably high. To exploit the potential of cytokine capture assays, cross-contamination must be prevented. Elimination of this cross-contamination will enable isolation of highly purified populations of viable activated immune cells. These cells can be cultured and expanded for further functional studies, or the cells can be used for biochemical analysis, e.g., identification of the sequences encoding target reactive TCR α and β chains25,26.
Here, we demonstrate a simple method to prevent cross-contamination in secretion assays. We perform cytokine capture assays in small (~40 pl), biocompatible microfluidic droplets to confine diffusion of secreted cytokines. We use NK-92 MI cells as model immune effector cells because, like T cells, they secrete IFN-γ upon activation27–29. We coat NK-92 MI cells with IFN-γ capture reagent and co-encapsulate them into droplets along with K562 target cells and fluorescent anti-IFN-γ detection antibody. Secreted IFN-γ is captured onto the surface of activated NK-92 MI cells, which are then labeled with fluorescent detection antibody. After release from droplets, a standard FACS instrument is used to isolate the activated NK-92 MI cells based on the fluorescent signal. This droplet-based assay has dramatically less cross-contamination than the same assay performed without droplets, in bulk, and enables high-purity isolation of activated immune cells.
Results and discussion:
In-droplet cell activation assay.
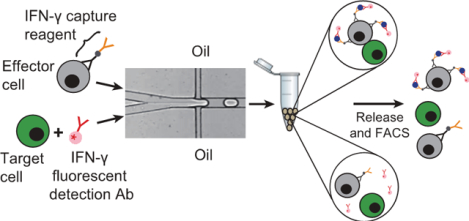
This method for high throughput identification and isolation of activated cells uses droplets to minimize contamination between activated and non-activated cells. To prevent effector cells from contacting target cells prior to encapsulation, we simultaneously inject two aqueous streams, one containing effector cells coated with IFN-γ capture reagent and the other containing target cells and IFN-γ detection antibody into a microfluidic droplet device (Fig. 1A). The merged aqueous stream is then cut into droplets by oil flowing perpendicularly (Fig. 1B). We flow each aqueous phase at 100 μl/h and the oil phase through each indicated channel at 500 μl/h to produce uniform droplets of ~40 μm diameter (SI Appendix Fig. S2A and S2B) at 2000 Hz. After droplet formation, the emulsion is collected into an Eppendorf tube at the channel outlet (Fig. 1C) and incubated in a 37 °C cell culture incubator. During incubation, effector cells co-encapsulated with appropriate target cells become activated and secrete IFN-γ, which is captured onto the effector cell surface. After incubation, activated effector cells are brightly fluorescent due to binding of the APC-conjugated anti-IFN-γ detection antibody (Fig. 1D), while effector cells co-encapsulated with irrelevant cells are not activated and are not fluorescent (Fig. 1E). Then, we release cells from droplets (Fig. 1F), and use a FACS instrument to identify and isolate the activated effector cells (Fig. 1G).
Figure 1: Schematic of activation assay.
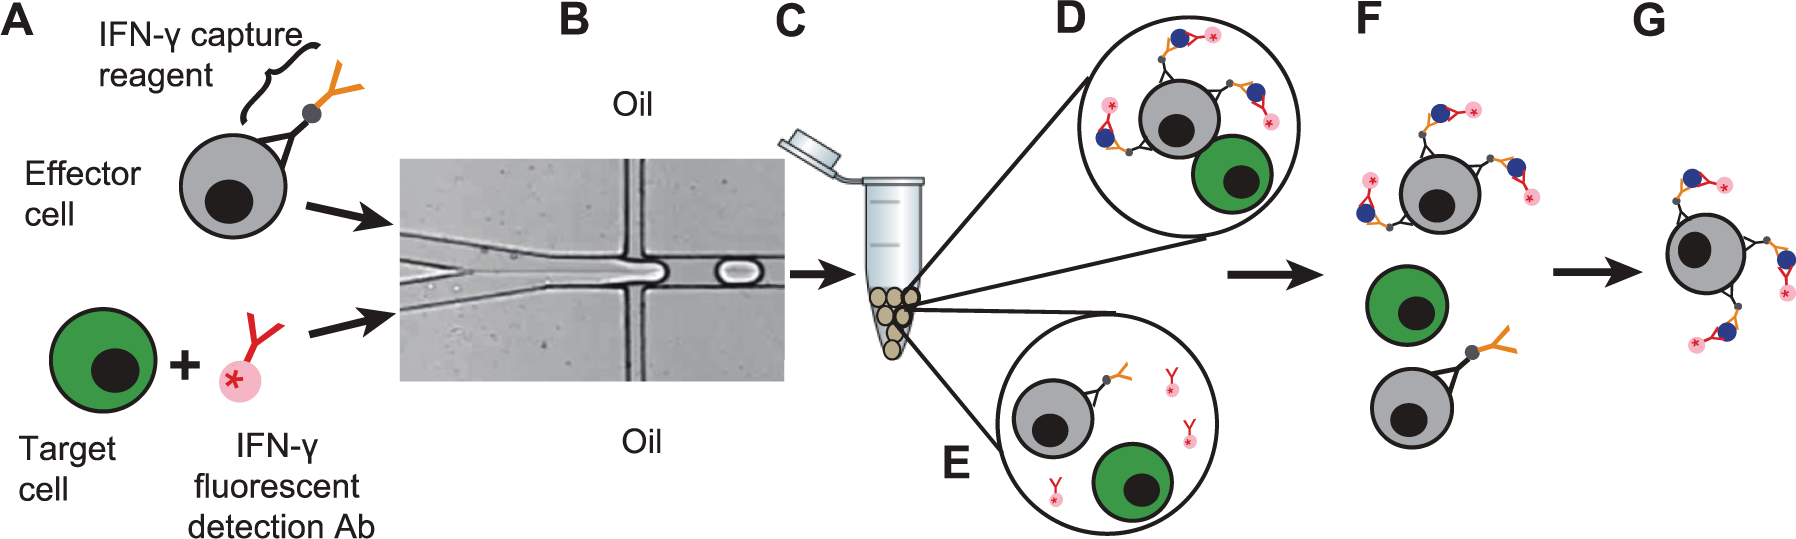
A) A sample containing effector cells (grey) coated with IFN-γ capture reagent and a sample containing target cells (green) and IFN-γ detection antibody (pink) are each injected into separate microfluidic device inlets. B) Aqueous stream is cut into droplets by the oil channel. C) Droplets are collected and incubated at 37 °C. D) After incubation, an effector cell co-encapsulated with an appropriate target cell is activated to secrete IFN-γ (blue) and its surface becomes brightly fluorescent due to binding of the fluorescent anti-IFN-γ detection antibody. E) Effector cells co-encapsulated with irrelevant cells are not activated and are not labeled with fluorescent detection antibody. F) Droplets are destabilized by 1H,1H,2H,2H-Perfluoro-1-octanol to release cells. G) FACS instrument is used to identify and sort activated effector cells.
Cytokine capture assays performed in bulk have high levels of false positive and false negative cells.
In cytokine capture assays performed in bulk, non-activated immune cells can capture cytokines secreted by nearby activated immune cells. We use NK-92 MI cells, which are activated to secrete IFN-γ by incubation with stimulation cocktail, to confirm that this cross-contamination can lead to an unacceptably large number of false positive and false negative events. We treat unstained NK-92 MI cells with stimulation cocktail to generate a population of activated immune cells; the non-activated NK-92 MI cell population is not treated with stimulation cocktail and is stained with CellTracker™ Green to distinguish it from the stimulated cell population. After 5 h incubation, cells are placed on ice for 1 h to stop secretion and then washed to remove stimulation cocktail and any secreted IFN-γ. All NK-92 MI cells are then coated with IFN-γ capture reagent. Samples comprising either or both cell types are prepared in bulk and incubated overnight at 37 ℃ to allow IFN-γ secretion from stimulated NK-92 MI cells. We first characterize these cell populations separately to aid interpretation of subsequent mixed-cell flow cytometry experiments. The unstained NK-92 MI cells treated with stimulation cocktail are strongly activated, as indicated by strong signal from the APC-conjugated detection antibody (Fig. 2A). The flow cytometry scatter plot indicates that >99% of the stimulated cells show detectable levels of IFN-γ on their surfaces (Fig. 2B). Non-stimulated cells stained with CellTracker™ Green are easily distinguished from those not stained (Fig. 2C), and the flow cytometry scatter plot shows that ~99% of the non-stimulated cells have no detectable APC fluorescence, indicating they are not activated (Fig. 2D). We use these cell populations to create mixtures of stimulated and non-stimulated NK-92 MI cells. In a 1:1 mixture of stimulated and non-stimulated NK-92 MI cells in bulk, the stimulated cells are strongly stained with anti-IFN-γ, indicating that the cells secrete IFN-γ, which is captured onto their surfaces, as expected. Strikingly, the non-stimulated NK-92 MI cells, indicated by CellTracker™ Green signal, are also strongly labeled by IFN-γ detection antibody, suggesting that IFN-γ secreted from activated cells can be captured by neighboring non-activated cells (Fig. 2E and 2F). This result is supported by summaries of the flow cytometry data showing that ~99% of the stimulated cells are clearly labeled with the IFN-γ detection antibody, while 1% are not (Fig. 2G); and that 98% of the green, non-stimulated cell population is also stained with the IFN-γ detection antibody, making these non-stimulated cells appear activated (Fig. 2H). This result suggests that for samples containing a high percentage of activated secreting cells, attempts to isolate cells based on IFN-γ detection antibody signal will result in a high rate of false positives. A shorter incubation time might reduce this problem, but true activated cells that secrete slowly would likely be undetected.
Figure 2: Droplet encapsulation dramatically reduces the frequency of both false positive and false negative cells.
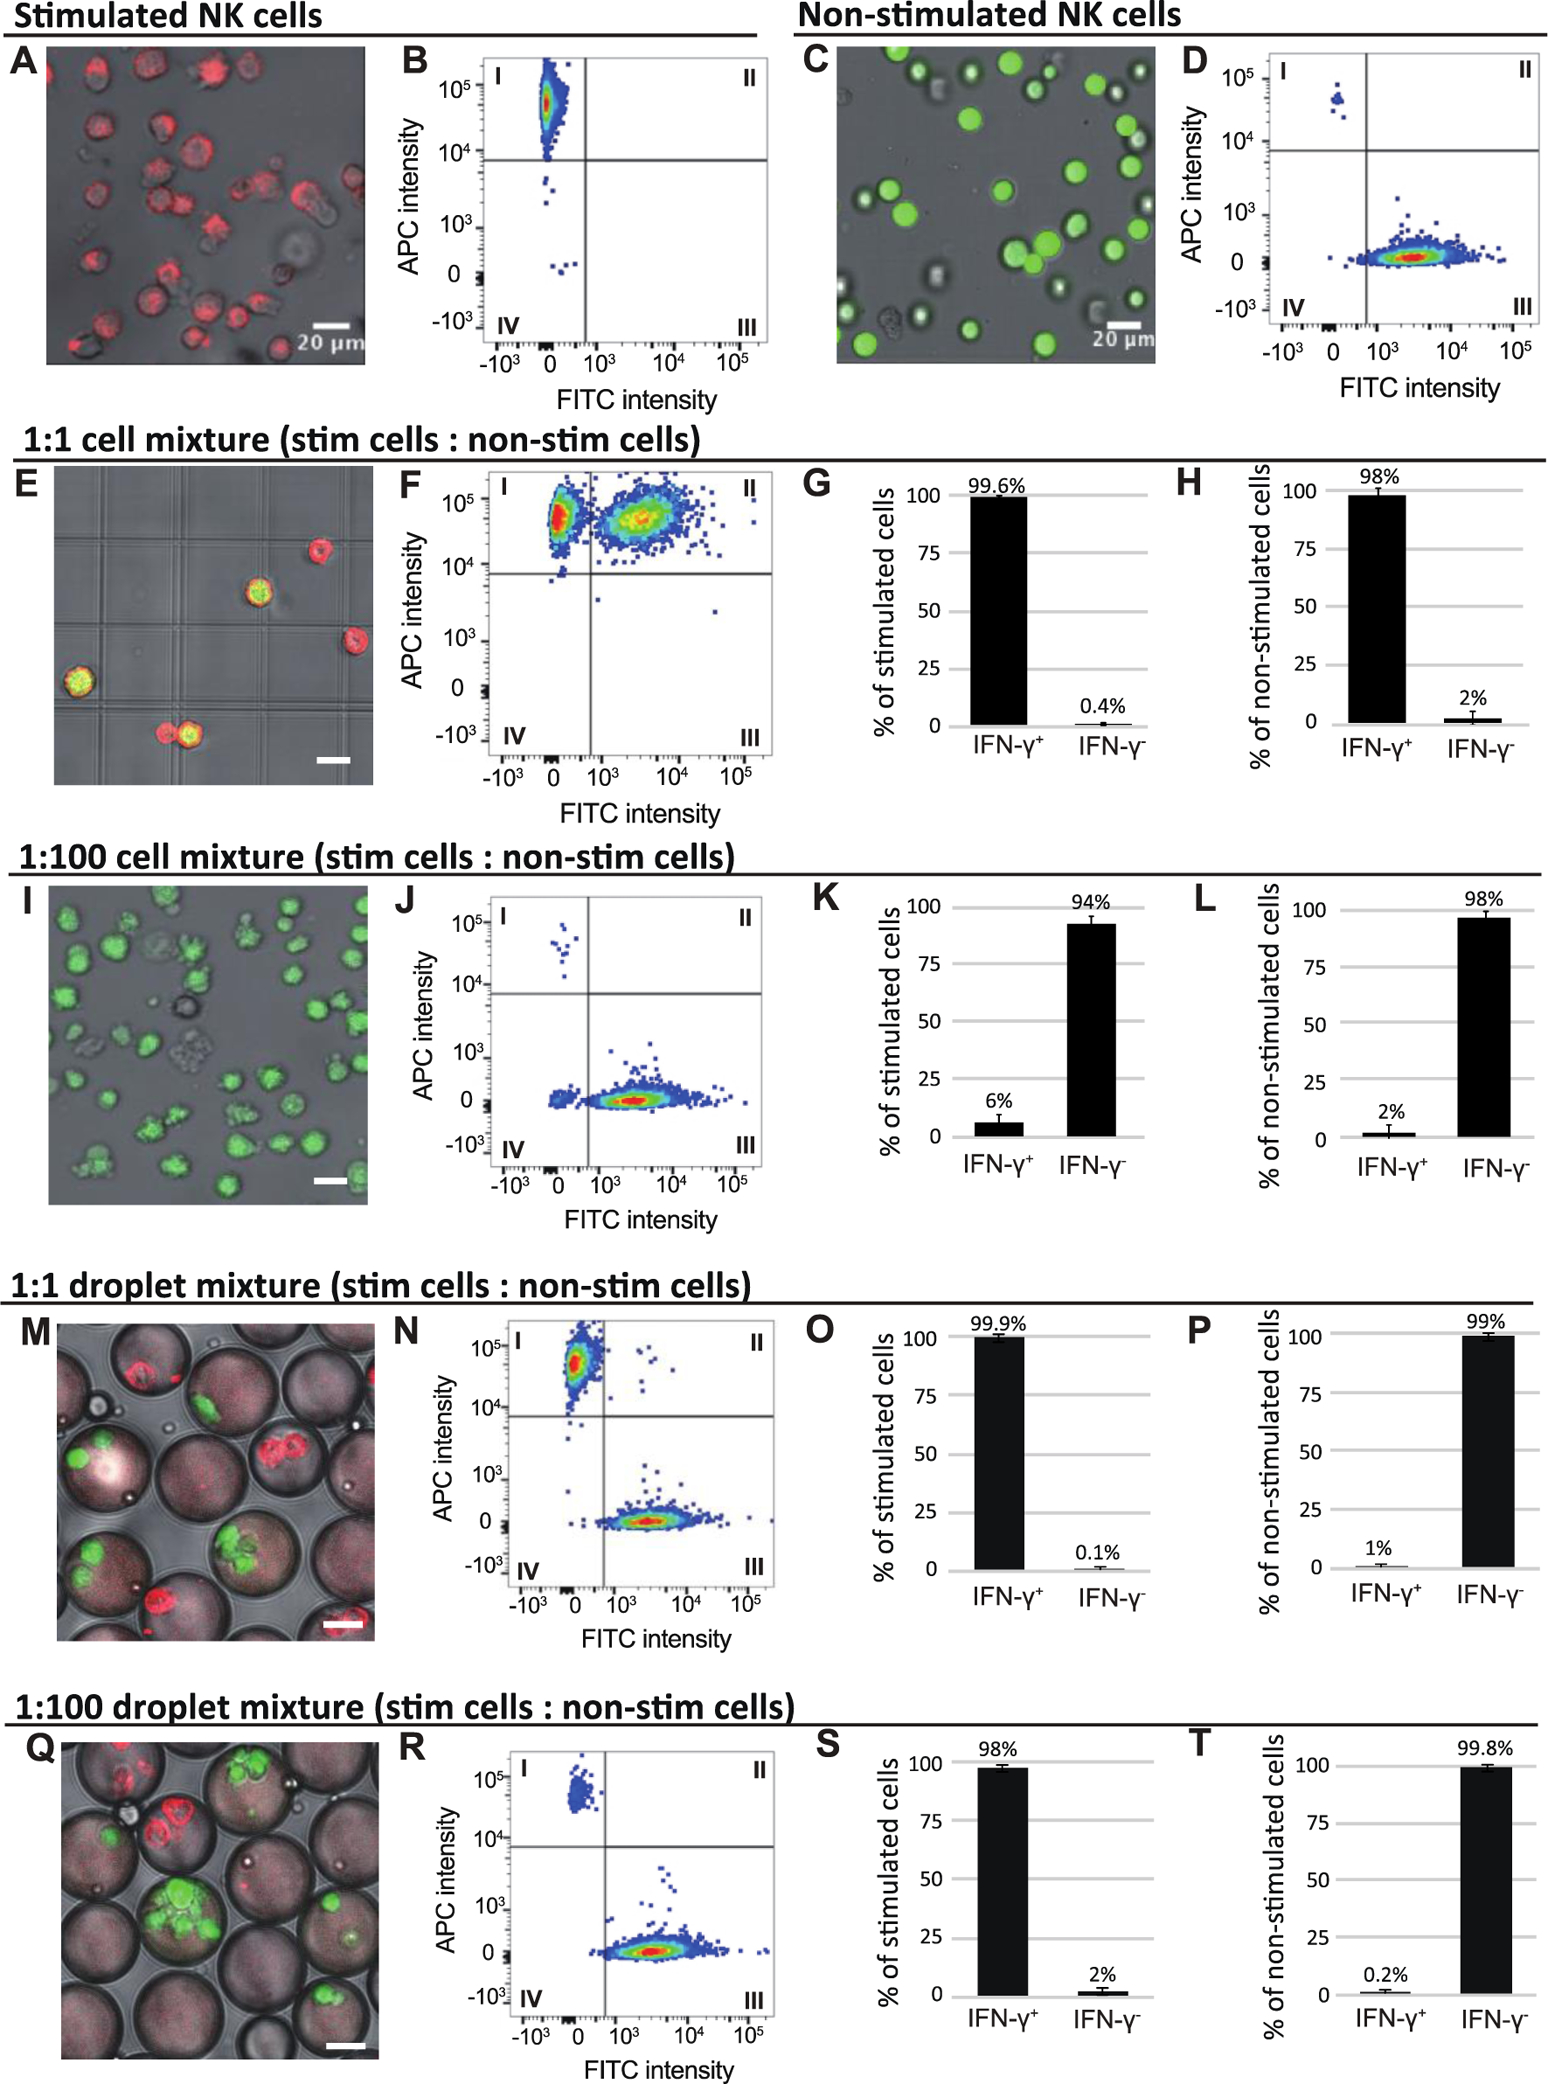
A) Unstained NK-92 MI cells are activated by stimulation cocktail; secreted IFN-γ is captured on the cell surface by capture reagent and labeled by APC-conjugated anti-IFN-γ detection antibody. B) Flow cytometry analysis of 10,000 unstained, stimulated NK-92 MI cells. C) NK-92 MI cells stained with CellTracker™ Green and not treated with stimulation cocktail show no APC fluorescence on their surfaces. D) Flow cytometry analysis of 10,000 CellTracker™ green-stained, non-stimulated NK-92 MI cells. We performed fluorescence microscopy (E, I) and flow cytometry (F, J) analysis of stimulated and non-stimulated cells mixed in bulk at ratios of 1:1 and 1:100, respectively. A summary of the flow cytometry data for the 1:1 cell mixture shows that >99% of the stimulated cells are positive by the IFN-γ secretion assay (G). Significantly, 98% of the non-stimulated cells were also stained with the APC-labeled anti-IFN-γ antibody, indicating high false positive rate (H). A summary of the flow cytometry data for the 1:100 cell mixture indicates a high false negative rate, as only 6% of the stimulated cells are positive by the IFN-γ secretion assay (K). 2% of the non-stimulated cells are labeled with the APC-conjugated anti-IFN-γ antibody and thus are false positives (L).We separately encapsulate stimulated and non-stimulated cells into droplets, mix these droplets at, respectively, 1:1 and 1:100 ratios, and incubate for 12 h. We perform fluorescence microscopy (M, Q) and flow cytometry (N, R) analysis of cells released from these droplet mixtures. A summary of the flow cytometry data for the 1:1 mixed droplet population indicates that almost all (>99%) of the stimulated cells secrete a detectable level of IFN-γ (O), while only 1% of the unstimulated cells are stained with the APC-conjugated anti-IFN-γ antibody (P). A summary of flow cytometry for the 1:100 mixed droplet population indicates that almost all (>98%) of the stimulated cells secrete detectable level of IFN-γ (S), while only 0.2% of the unstimulated cells are stained with the APC-conjugated anti-IFN-γ antibody (T). All scale bars in the image represent 20 μm.
In most applications, activated cells are a small fraction of total cells. To test this condition, we mix stimulated and non-stimulated cells at a ratio of 1:100. As expected, cells from the non-stimulated cell population (stained with CellTracker™ green) are not labeled with IFN-γ detection antibody; surprising, very few stimulated cells (not stained with CellTracker™ green) are labeled with IFN-γ detection antibody, as shown by fluorescence microscopy (Fig. 2I) and flow cytometry analysis (Fig. 2J). This is due to IFN-γ diffusion away from secreting cells and capture by neighboring non-secreting cells, resulting in an averaging of the signal detected on secreting and non-secreting cells. A summary of the flow cytometry data shows that 94% of the stimulated cells have IFN-γ detection antibody staining below detection limits and can be classified as false negative cells (Fig. 2K); 2% of the non-stimulated cells show detectable IFN-γ detection antibody staining, making them false positive cells (Fig. 2L).
Droplet encapsulation reduces cytokine capture assay false positives and false negatives
To demonstrate that droplet encapsulation reduces cross-contamination, we generate separate droplet populations containing cytokine capture assay reagents and either cocktail-stimulated or non-stimulated NK-92 MI cells, and mix them in 1:1 and 1:100 ratios (droplets with stimulated cells : droplets containing non-stimulated cells), respectively. After 12h incubation, we analyze droplets by fluorescence microscopy (Fig. 2M and 2Q) and observe APC labeled anti-IFN-γ antibody on the surface of stimulated cells, indicating that they secrete IFN-γ while in the droplets. In contrast, we detect no secreted IFN-γ on non-stimulated NK-92 MI cells, suggesting that encapsulation prevents secreted IFN-γ from reaching the non-stimulated cells. We confirm these results by using flow cytometry to analyze ~10,000 cells released from each droplet mixture for the presence of surface-captured IFN-γ (SI Appendix Fig S3A and S3B). Cells released from both the 1:1 and 1:100 droplet mixtures fall into two distinct populations. The stimulated NK-92 MI cells, not labeled with CellTracker™ Green and thus identified by their low FITC signal, have high APC signal (quadrant I of Fig. 2N and quadrant I of Fig. 2R), indicating that they secrete IFN-γ. In contrast, the non-stimulated cells, stained with CellTracker™ Green, have high signal in the FITC channel and low signal in the APC channel (quadrant III of Fig. 2N and quadrant III of Fig. 2R). Analysis of the flow cytometry data of the cells released from the 1:1 droplet mixture shows that virtually all the stimulated cells and only 1% of the non-stimulated cells have detectable IFN-γ on their surfaces (Fig. 2O and Fig. 2P, respectively), indicating droplet encapsulation greatly reduces the number of false positive cells. Similarly, analysis of the flow cytometry data of the cells released from the 1:100 droplet mixture demonstrates that encapsulation reduces the false positive rate to 0.2% (Fig. 2T). Additionally, the false negative rate is reduced to only 2% (Fig. 2S). By performing the cytokine capture assay in droplets, cross contamination is dramatically reduced, resulting in very low false positive and false negative rates (summarized in SI Appendix Table S1).
Cell activation and cell viability are dependent on in-droplet incubation time.
After confirming that droplet encapsulation improves the specificity of the cytokine secretion assay, we use it to isolate effector cells activated by contact with appropriate target cells. For effector cells, we use unstained NK-92 MI cells coated with IFN-γ capture reagent (Fig. 3A). As targets, we use K562 cells stained with CellTracker™ Green (Fig. 3B) to distinguish them from NK-92 MI cells by their green fluorescence intensity (SI Appendix Fig. S4). We first characterize cell encapsulation rates using a co-flow dropmaker, with one aqueous stream containing NK-92 MI cells at 2×10⁶/100 μl and the second stream containing K562 cells at 8×10⁶/100 μl, to generate populations in which a high percentage of droplets contain one NK-92 MI cell and at least one target K562 cell. We use fluorescence microscopy to quantify the number of each droplet type produced (Fig. 3C). We then plot the actual percentage of each droplet type, determined by counting at least 100 droplets, against the expected percentage of droplet types, calculated according to Poisson distribution (Fig. 3D). The actual percentages are consistent with those expected, with 27% of the droplets containing both K562 cells and NK-92 MI cells and 6% containing only NK-92 MI cells. Thus, in accordance with previous studies, encapsulation of cells into droplets is random and follows a Poisson distribution30,31,32.
Figure 3: Effector cells recognize target cells in droplets.
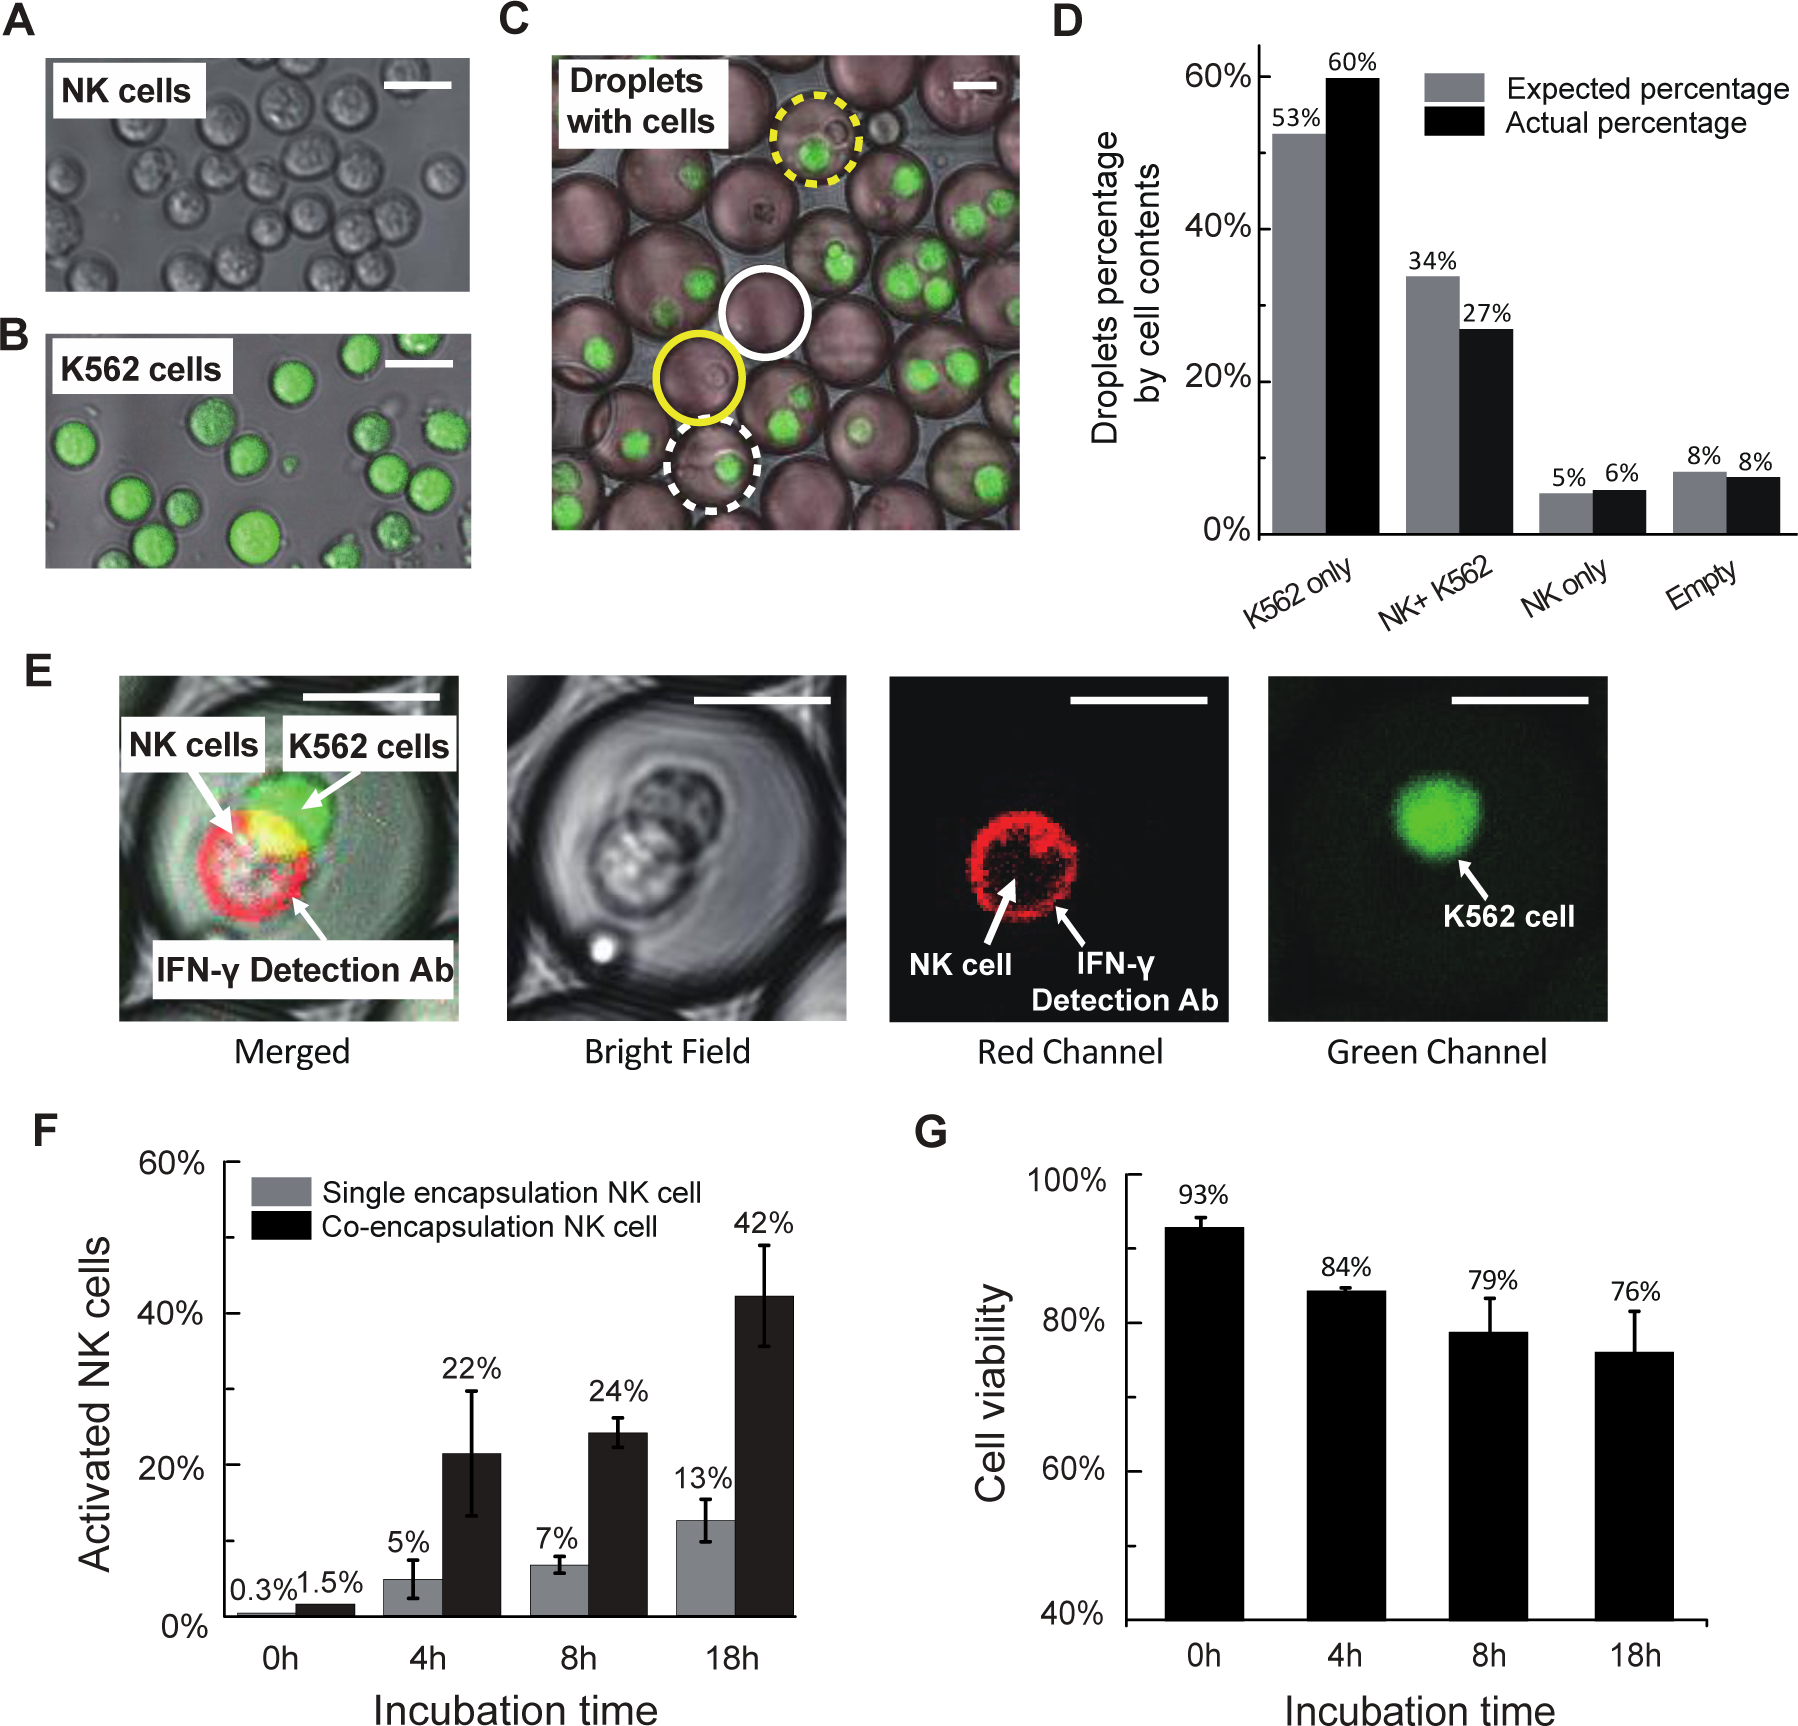
A-C: Measurement of cell encapsulation efficiency. A) We use NK-92 MI cells, coated with IFN-γ capture reagent and not stained with any cell dye, as effector cells; B) K562 cells, stained with CellTracker green, are target cells. C) Cells are encapsulated and droplets are classified as containing: no cells (solid white circle), only NK-92 MI cells (solid yellow circle), only K562 cells (dashed white circle) and both NK-92 MI and K562 cells (dashed yellow circle). D) Graph of actual cell distribution in droplets (black bars) and cell distribution predicted by Poisson loading calculation (gray bars). E-G: Cell activation and cell viability are dependent on in-droplet incubation time. E) NK-92 MI cells incubated with K562 cells in droplets are activated and secrete IFN-γ. Representative images depict unstained NK-92 MI cells coated with IFN-γ capture reagent co-encapsulated with green stained K562 target cells and incubated overnight. NK-92 MI cells are activated and secrete IFN-γ, which is captured onto the cell surface and detected with red fluorescent anti-IFN-γ antibody. F) Small fraction of NK-92 MI cells is activated by incubation in droplets; this activation increases over time as shown by grey bars. NK-92 MI cell activation is dramatically increased by co-encapsulation with K562 cells (compare black bars with grey bars). Error bar shows two replicate experiments. G) Cell viability decreases with in-drop incubation time. Input cells that are treated with IFN-γ capture reagent but not encapsulated into droplets are stained with live-dead dyes and viability is determined by fluorescence microscopy. Viability of the input cells is defined as the basal cell viability and set as 100%. The viability of cells incubated in droplets for the indicated time periods is normalized against the basal cell viability. Scale bar = 20 μm.
We next demonstrate that effector NK-92 MI cells are activated by contact with co-encapsulated K562 cells and that the cells survive in droplets and secrete detectable levels of IFN-γ. We co-encapsulate NK-92 MI cells coated with IFN-γ capture reagent along with CellTracker™ Green stained K562 target cells and analyze these droplets by fluorescence microscopy. Immediately after encapsulation, no NK-92 MI cells appear activated. However, after 18h incubation, we observe many droplets in which NK-92 MI cells are activated to secrete IFN-γ by contact with target K562 cells. K562 cells are easily distinguished from NK-92 MI cells by their green staining and are not labeled with the IFN-γ detection antibody (Fig. 3E). To better characterize this activation, we incubate for 0, 4, 8, and 18h and count numerous droplets in which an NK-92 MI cell is encapsulated alone (Fig. 3F, gray bars), or with a K562 target cell (Fig. 3F, black bars). We define the percentage of activated NK-92 MI cells as the number of IFN-γ-positive (IFN-γ+) NK-92 MI cells/total number of NK-92 MI cells. NK-92 MI cells co-encapsulated with K562 cells are much more likely to be IFN-γ+ than NK-92 MI cells encapsulated without K562 cells (Fig. 3F, compare black and grey bars at 4h), and increasing incubation time from 4h to 8h slightly increases the percentage of IFN-γ+ NK-92 MI cells. After 18h incubation, in droplets containing both an NK-92 MI cell and a K562 cell, the percentage of IFN-γ+ NK-92 MI cells increases to ~42%. However, in the droplet population containing only NK-92 MI cells, the “background activation”, i.e., IFN-γ+ NK-92 MI cells incubated without K562 cells, increases from 7% after 8h incubation to 13% after 18h incubation (Fig. 3F). We believe this increase is partially due to accumulation of IFN-γ secreted during the long incubation by NK-92 MI cells, which have been shown to secrete small amounts of IFN-γ even without being activated33.
The volume of growth medium within a droplet is small and cannot be replenished or replaced during incubation. Thus, to test the cell viability, we encapsulate cells in droplets and incubate for the indicated times. We then release cells from the droplets, stain with live-dead cell dyes and use fluorescence microscopy to determine cell viability (Fig. 3G). We use the viability of the input cells prior to encapsulation for normalization. Cell viability immediately after encapsulation is 93%, then decreases to 84% after 4h incubation and to 79% after 8h incubation. After 18h incubation, the viability drops to 76%. For applications requiring higher viability, larger droplets should be used.
Because antibodies tend to bind non-specifically to damaged cells in droplets34, it is likely that some of the IFN-γ signal on the surface of NK-92 MI cells incubated alone in droplets is the result of non-specific binding of the detection antibody. For many experiments, especially those requiring high cell viability and low background, incubations of 4 h or less may be optimal.
Activated NK-92 MI cells can be enriched by FACS.
To demonstrate identification and isolation of activated effector NK-92 MI cells, we co-encapsulate NK-92 MI cells coated with capture antibody and K562 cells stained with CellTracker™ Green in droplets and incubate for 18 h (Fig. 4A). We then release the cells from droplets. Fluorescence microscopy reveals green K562 cells and a mixture of activated and non-activated NK-92 MI cells, stained and not-stained with APC-labeled anti-IFN-γ antibody, respectively (Fig. 4B). We perform FACS on these cells and gate to collect cells having low-FITC and high-APC signal, which should be activated NK-92 MI cells (Fig. 4C, quadrant I). After sorting, we use fluorescence microscopy and flow cytometry to assess recovery and purity. Fluorescence microscopy of hundreds of sorted cells shows that all are stained with the APC-labeled IFN-γ detection antibody (Fig. 4D). The flow cytometry data, plotted using the sorting gates, shows that the vast majority of sorted cells fall into quadrant I, as expected (Fig. 4E). A small number of cells, indicated by black arrow in Fig. 4E, have APC intensity lower than the sort threshold; likely due to some APC-labeled detection antibody dissociating from cells during handling. These results strongly suggest that the sorted cell population is highly enriched for activated NK-92 MI cells. We compare flow cytometry data obtained during the sorting with post-sorting flow cytometry analysis of the sorted cell population to estimate that the sorting enriches the fraction of activated NK-92 MI cells from 28% in the input to 96% in the sorted population (Fig. 4F).
Figure 4: Target-activated NK-92 MI cells detected and sorted by FACS instrument.
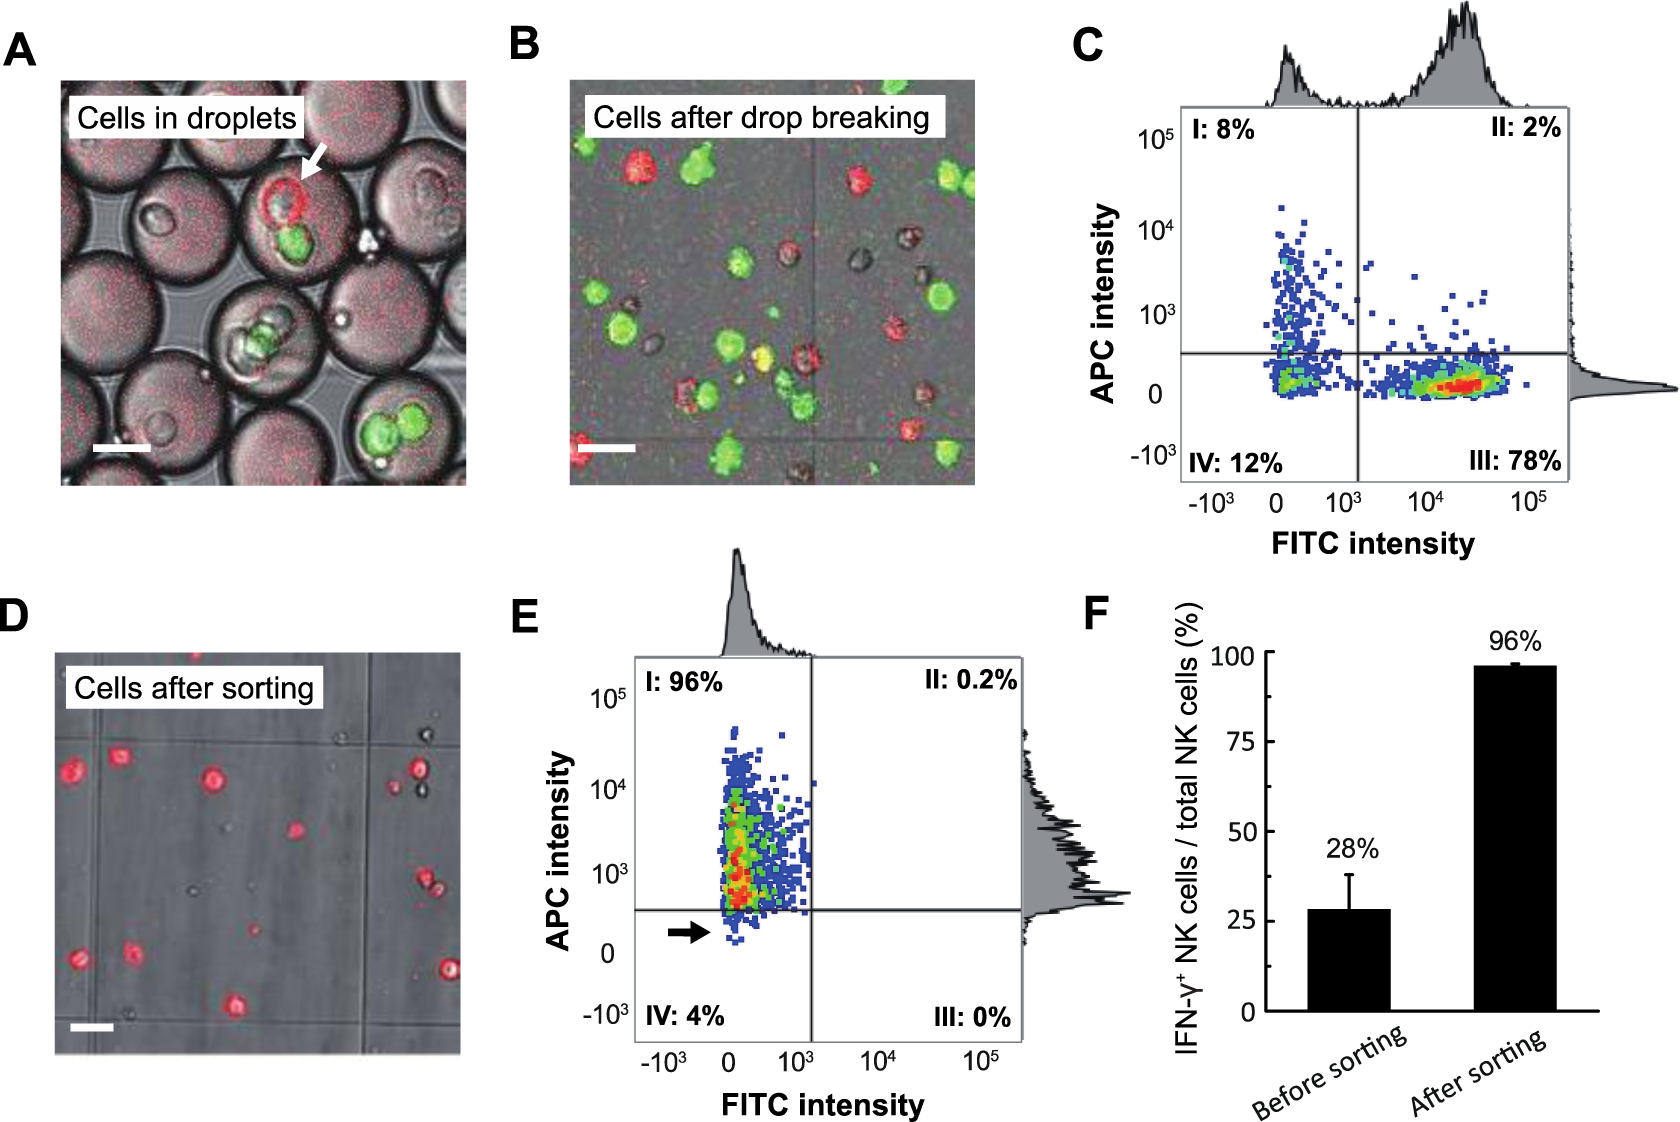
NK-92 MI Effector cells are coated with capture-antibody, encapsulated into droplets along with Cell Tracker green-stained K562 target cells and APC-labeled fluorescent detection antibody and incubated for 18 h. Cells are then released from droplets and sorted by FACS. A) Cells after incubation in droplets, with the arrow indicating an activated NK-92 MI cell; B) Representative image showing cells after release from droplets and prior to sorting. C) Scatterplot of FACS to isolate activate NK-92 MI cells. Quadrant I cells are collected and analyzed by fluorescence microscopy (D) and flow-cytometry (E), showing a population highly enriched for low-FITC, high-APC cells. F) IFN-γ+ NK-92 MI cells versus total NK-92 MI cells before and after sorting. Scale bar=20 μm.
Conclusions:
We have demonstrated that compartmentalization of single cell secretion assays can greatly reduce background and enhance sensitivity. We use microfluidic devices to encapsulate single effector cells and target cells, NK-92 MI cells and K562 cells, respectively, into droplets and perform in-droplet IFN-γ capture assays. Following in-droplet incubation, we release the cells and use a FACS instrument to isolate individual activated immune effector cells. When compared with corresponding assays performed in bulk, compartmentalization virtually eliminates contamination between cells and greatly reduces both false negatives and false positives. We further demonstrate that cells can be released from droplets and sorted efficiently by FACS, and that cells remain viable throughout the process.
This in-droplet use of the IFN-γ capture assay makes it a powerful tool to identify and isolate target-reactive T cells. Because IFN-γ secreted from very highly secreting cells cannot escape droplets to contaminate non-activated cells, compartmentalization makes the capture assays compatible with cells that secrete at vastly different rates, as is the case with patient- and donor-derived samples. Sorted cells can be expanded in culture for further functional studies and characterization. Alternatively, reverse-transcriptase PCR can be performed on individual sorted cells to isolate genes encoding target-reactive TCR α and β chains35,36. In principle, it is straightforward to design assays to monitor multiple secreted molecules simultaneously, for example IFN-γ, IL-10, and IL-2, which might enable the isolation of specific subsets of immune cells.
We have used a well-known cytokine capture assay to demonstrate that droplet encapsulation greatly improves the accuracy of single cell secretion assays. The methods are straightforward, require little specialized equipment, and can be adapted to analyze a great variety of secreted molecules. In addition, standard FACS instruments are used to analyze and sort cells after their release from the droplets, making the overall process accessible to all research labs.
Materials and Methods
Materials and methods are briefly described in main text and figure legends; details protocols are in the SI Appendix.
Supplementary Material
Acknowledgements
We acknowledge the support of NSF award DMR-1708729, NSF award DMR-1420570 (Harvard Materials Research Science and Engineering Center), NIH award R01EB023287, NIH award P01HL120839, K.C. Wong Education Foundation and NIH contract HHSN272201400046C.
Footnotes
Conflicts of interest
There are no conflicts to declare.
Cell lines
Both NK-92 MI cell line (ATCC® CRL-2408™) and K562 cell line (ATCC® CCL-243™) are purchased from ATCC.
Notes and references
- 1.Satija R and Shalek AK, Trends in Immunology, 2014, 35, 219–229. [DOI] [PMC free article] [PubMed] [Google Scholar]
- 2.Nikolich-Žugich J, Slifka MK and Messaoudi I, Nature Reviews Immunology, 2004, 4, 123–132. [DOI] [PubMed] [Google Scholar]
- 3.Vence L, Palucka AK, Fay JW, Ito T, Liu YJ, Banchereau J and Ueno H, Proceedings of the National Academy of Sciences of the United States of America, 2007, 104, 20884–20889. [DOI] [PMC free article] [PubMed] [Google Scholar]
- 4.Cohen CJ, Gartner JJ, Horovitz-Fried M, Shamalov K, Trebska-McGowan K, Bliskovsky VV, Parkhurst MR, Ankri C, Prickett TD, Crystal JS, Li YF, El-Gamil M, Rosenberg SA and Robbins PF, Journal of Clinical Investigation, 2015, 125, 3981–3991. [DOI] [PMC free article] [PubMed] [Google Scholar]
- 5.Rudolph MG and Wilson IA, Current Opinion in Immunology, 2002, 14, 52–65. [DOI] [PubMed] [Google Scholar]
- 6.Steinert EM, Schenkel JM, Fraser KA, Beura LK, Manlove LS, Igyártó BZ, Southern PJ and Masopust D, Cell, 2015, 161, 737–749. [DOI] [PMC free article] [PubMed] [Google Scholar]
- 7.Linnemann C, Heemskerk B, Kvistborg P, Kluin RJC, Bolotin DA, Chen X, Bresser K, Nieuwland M, Schotte R, Michels S, Gomez-Eerland R, Jahn L, Hombrink P, Legrand N, Shu CJ, Mamedov IZ, Velds A, Blank CU, Haanen JBAG, Turchaninova MA, Kerkhoven RM, Spits H, Hadrup SR, Heemskerk MHM, Blankenstein T, Chudakov DM, Bendle GM and Schumacher TNM, Nature Medicine, 2013, 19, 1534–1541. [DOI] [PubMed] [Google Scholar]
- 8.Turchaninova MA, Britanova OV, Bolotin DA, Shugay M, Putintseva EV, Staroverov DB, Sharonov G, Shcherbo D, Zvyagin IV, Mamedov IZ, Linnemann C, Schumacher TN and Chudakov DM, European Journal of Immunology, 2013, 43, 2507–2515. [DOI] [PubMed] [Google Scholar]
- 9.Attaf M, Huseby E and Sewell AK, Cellular and Molecular Immunology, 2015, 12, 391–399. [DOI] [PMC free article] [PubMed] [Google Scholar]
- 10.Altman JD and Davis MM, Current Protocols in Immunology, 2016, 2016, 17.3.1–17.3.44. [DOI] [PubMed] [Google Scholar]
- 11.Sims S, Willberg C and Klenerman P, Expert Review of Vaccines, 2010, 9, 765–774. [DOI] [PubMed] [Google Scholar]
- 12.He XS, Rehermann B, López-Labrador FX, Boisvert J, Cheung R, Mumm J, Wedemeyer H, Berenguer M, Wright TL, Davis MM and Greenberg HB, Proceedings of the National Academy of Sciences, 1999, 96, 5692–5697. [DOI] [PMC free article] [PubMed] [Google Scholar]
- 13.Shipkova M and Wieland E, Clinica Chimica Acta, 2012, 413, 1338–1349. [DOI] [PubMed] [Google Scholar]
- 14.Slifka MK and Whitton JL, The Journal of Immunology, 2000, 164, 208–216. [DOI] [PubMed] [Google Scholar]
- 15.Klebanoff CA, Gattinoni L and Restifo NP, Journal of Immunotherapy, 2012, 35, 651–660. [DOI] [PMC free article] [PubMed] [Google Scholar]
- 16.Lu YC, Zheng Z, Robbins PF, Tran E, Prickett TD, Gartner JJ, Li YF, Ray S, Franco Z, Bliskovsky V, Fitzgerald PC and Rosenberg SA, Molecular Therapy, 2018, 26, 379–389. [DOI] [PMC free article] [PubMed] [Google Scholar]
- 17.Su X, Yu Y, Zhong Y, Giannopoulou EG, Hu X, Liu H, Cross JR, Rätsch G, Rice CM and Ivashkiv LB, Nature Immunology, 2015, 16, 838–849. [DOI] [PMC free article] [PubMed] [Google Scholar]
- 18.Brehm MA, Daniels KA and Welsh RM, The Journal of Immunology, 2005, 175, 5043–5049. [DOI] [PubMed] [Google Scholar]
- 19.Smith SG, Smits K, Joosten SA, Van Meijgaarden KE, Satti I, Fletcher HA, Caccamo N, Dieli F, Mascart F, McShane H, Dockrell HM, Ottenhoff THM, Haks M, Stenger S, Kaufmann S, Maertzdorf J, Gicquel B, Tailleux L and Sallusto F, PLoS ONE, , DOI: 10.1371/journal.pone.0138042. [DOI] [PMC free article] [PubMed] [Google Scholar]
- 20.Bushkin Y, Radford F, Pine R, Lardizabal A, Mangura BT, Gennaro ML and Tyagi S, The Journal of Immunology, 2015, 194, 836–841. [DOI] [PMC free article] [PubMed] [Google Scholar]
- 21.Torres AJ, Hill AS and Love JC, Analytical Chemistry, 2014, 86, 11562–11569. [DOI] [PMC free article] [PubMed] [Google Scholar]
- 22.Desombere I, Meuleman P, Rigole H, Willems A, Irsch J and Leroux-Roels G, Journal of Immunological Methods, 2004, 286, 167–185. [DOI] [PubMed] [Google Scholar]
- 23.Qiu L, Wimmers F, Weiden J, Heus HA, Tel J and Figdor CG, Chemical Communications, 2017, 53, 8066–8069. [DOI] [PubMed] [Google Scholar]
- 24.Wimmers F, Subedi N, van Buuringen N, Heister D, Vivié J, Beeren-Reinieren I, Woestenenk R, Dolstra H, Piruska A, Jacobs JFM, van Oudenaarden A, Figdor CG, Huck WTS, de Vries IJM and Tel J, Nature Communications, , DOI: 10.1038/s41467-018-05784-3. [DOI] [PMC free article] [PubMed] [Google Scholar]
- 25.Davis MM and Bjorkman PJ, Nature, 1988, 334, 395–402. [DOI] [PubMed] [Google Scholar]
- 26.Yoshikai Y, Clark SP, Taylor S, Sohn U, Wilson BI, Minden MD and Mak TW, Nature, 1985, 316, 837–840. [DOI] [PubMed] [Google Scholar]
- 27.Smyth MJ, Cretney E, Kelly JM, Westwood JA, Street SEA, Yagita H, Takeda K, Dommelen SLHV, Degli-Esposti MA and Hayakawa Y, Molecular Immunology, 2005, 42, 501–510. [DOI] [PubMed] [Google Scholar]
- 28.Biron CA, Nguyen KB, Pien GC, Cousens LP and Salazar-Mather TP, Annual Review of Immunology, 1999, 17, 189–220. [DOI] [PubMed] [Google Scholar]
- 29.Lanier LL, Nature Immunology, 2008, 9, 495–502. [DOI] [PMC free article] [PubMed] [Google Scholar]
- 30.El Debs B, Utharala R, Balyasnikova IV, Griffiths AD and Merten CA, Proceedings of the National Academy of Sciences, 2012, 109, 11570–11575. [DOI] [PMC free article] [PubMed] [Google Scholar]
- 31.Novak R, Zeng Y, Shuga J, Venugopalan G, Fletcher DA, Smith MT and Mathies RA, Angewandte Chemie - International Edition, 2011, 50, 390–395. [DOI] [PMC free article] [PubMed] [Google Scholar]
- 32.Abate AR, Chen CH, Agresti JJ and Weitz DA, Lab on a Chip, 2009, 9, 2628–2631. [DOI] [PubMed] [Google Scholar]
- 33.Bezman NA, Kim CC, Sun JC, Min-Oo G, Hendricks DW, Kamimura Y, Best JA, Goldrath AW, Lanier LL, Gautier EL, Jakubzick C, Randolph GJ, Best AJ, Knell J, Miller J, Brown B, Merad M, Jojic V, Koller D, Cohen N, Brennan P, Brenner M, Shay T, Regev A, Fletcher A, Elpek K, Bellemare-Pelletier A, Malhotra D, Turley S, Jianu R, Laidlaw D, Collins JJ, Narayan K, Sylvia K, Kang J, Gazit R, Rossi DJ, Kim F, Rao TN, Wagers A, Shinton SA, Hardy RR, Monach P, Kim CC, Heng T, Kreslavsky T, Painter M, Ericson J, Davis S, Mathis D and Benoist C, Nature Immunology, 2012, 13, 1000–1008. [DOI] [PMC free article] [PubMed] [Google Scholar]
- 34.Mazutis L, Gilbert J, Ung WL, Weitz DA, Griffiths AD and Heyman JA, Nature Protocols, 2013, 8, 870–891. [DOI] [PMC free article] [PubMed] [Google Scholar]
- 35.De Simone M, Rossetti G and Pagani M, Frontiers in Immunology, 2018, 9, 1638. [DOI] [PMC free article] [PubMed] [Google Scholar]
- 36.Han A, Glanville J, Hansmann L and Davis MM, Nature Biotechnology, 2014, 32, 684–692. [DOI] [PMC free article] [PubMed] [Google Scholar]
Associated Data
This section collects any data citations, data availability statements, or supplementary materials included in this article.