

Abstract
Background
Dilated cardiomyopathy (DCM), which is characterized by enlarged ventricular dimensions and systolic dysfunction, is the most common type of cardiomyopathy. Mutations in the LMNA gene are reported in approximately 10% of familial DCM cases. However, the mechanism of LMNA mutations in human DCM remains unclear.
Material/Methods
We used the GSE36502 and GSE123916 datasets to obtain gene expression profiles from LMNA-related DCM mice and to identify differentially expressed genes (DEGs). Crucial function and pathway enrichment analyses of DEGs were performed. Protein–protein interaction (PPI) network analysis was carried out to identify the top 10 hub genes, which were validated using reverse transcription-polymerase chain reaction (RT-PCR) to find target genes. Weighted gene co-expression network analysis (WGCNA) was used to explore the module relevant to external traits of LMNA-related DCM mice. Transcription factors (TFs) for the selected genes were analyzed using NetworkAnalyst.
Results
A total of 156 common DEGs (co-DEGs) were identified, including 80 up-regulated and 76 down-regulated genes. The enriched biological functions and pathways were oxidative stress, regulation of apoptosis, regulation of fibrosis, and MAPK pathways. Five target genes (Timp1, Hmox1, Spp1, Atf3, and Adipoq) were verified after RT-PCR. Most co-DEGs were discovered to be related to the development of external traits. Three TFs (ELF1, ETS1, and NRF1) showed close interactions with the hub genes.
Conclusions
Our study used integrated bioinformatic analyses and revealed some important genes in mice with LMNA-related DCM, which could provide novel insights into the mechanism underlying human LMNA-related DCM.
MeSH Keywords: Cardiomyopathy, Dilated; Computational Biology; Gene Expression Profiling
Background
Dilated cardiomyopathy (DCM) characterized by enlarged ventricular dimensions and systolic dysfunction, is the most common type of cardiomyopathy [1]. DCM is a major cause of heart failure and cardiac death, with an estimated prevalence of 40 cases per 100 000 individuals. Although there are numerous causes of DCM, genetic factors are important at all ages, accounting for up to 35% of cases despite environmental and other unknown factors [2]. Mutations in the LMNA gene are reported in approximately 10% of the familial DCM cases and in nearly 33% of the familial DCM cases associated with atrioventricular block [3].
The LMNA gene, which encodes 2 components of the nuclear envelope, lamins A and C, is associated with a wide range of human genetic disorders called laminopathies, such as muscular dystrophy disorders, Hutchinson-Gilford progeria syndrome [4,5], Emery-Dreifuss muscular dystrophy [6], and especially DCM [5]. In contrast to other idiopathic DCMs, DCMs associated with LMNA mutations have some severe cardiac phenotypes such as atrial fibrillation and atrioventricular block, with a high incidence of heart transplantation [7]. Guidelines for the clinical management of individuals with LMNA-related DCM have been published in articles [8, 9] and books (https://www.ncbi.nlm.nih.gov/books/NBK1674/). It is known that the disrupted expression of lamin protein due to multiple LMNA gene mutations is the primary cause of the final phenotype. However, achieving treatment efficiency by targeting the gene level is difficult, and there is no genetic or biological targeted therapy that can be applied in LMNA-related DCM [10]. Therefore, uncovering how LMNA mutations alter gene expression and signaling pathways and seeking the common downstream mechanism for different LMNA mutation sites may hold great potential for therapeutic applications in LMNA-related DCM [11].
Currently, animal models carrying a modified LMNA gene are well established as a tool to thoroughly investigate the DCM molecular pathways and mechanisms [12–15]. A few studies have found that LMNA gene mutations may affect downstream activities, such as activation of the DNA damage response/TP53 pathway [12], FAS protein expression, and activation of mitochondrial pathways of apoptosis [14]. However, no systematic analyses have been conducted to uncover the potential mechanisms in relationships between LMNA mutations and DCM.
Microarray technology and bioinformatic analysis have been widely used to evaluate differences in gene expression [16], which can help us better understand the mechanisms underlying DCM associated with LMNA mutations. However, previous studies have mainly focused on only one type of LMNA mutation in DCM heart and normal tissue samples.
In our study, we downloaded 2 gene expression profiles, GSE36502 and GSE123916, from the Gene Expression Omnibus database, an international public repository for functional genomic datasets submitted by the research community [16]. GSE36502 and GSE123916 contain 2 different types of LMNA mutations, which we expected would help us identify some common differences in gene expression in LMNA-related DCM mouse models. In addition, we used reverse transcription-polymerase chain reaction (RT-PCR) to validate these differences in gene expression in another DCM mouse model (LMNA E82K). This study identifies some common mechanisms in LMNA-related DCM and provides novel insights for the potential application in genetic or biological targeted therapy.
Material and Methods
Gene expression profiling
The work flow of this study is shown in Figure 1. Gene expression profiles were downloaded from the Gene Expression Omnibus (GEO) database [16] (https://www.ncbi.nlm.nih.gov/geo/). The GEO database resource supports archiving of raw, processed, and metadata that are indexed, cross-linked, and searchable. Two series of the mice DCM model were used, each containing a different mutation in the LMNA gene.
Figure 1.

Workflow of data preparation, processing, analysis, and validation.
Series GSE36502 was based on platform GPL9899 and evaluated using genome tiling arrays. A total of 6 samples were selected in GSE36502 that included 3 LmnaN195k mutant and 3 wild-type (WT) control left ventricle tissues of mice heart. The contributors of GSE36502 used echocardiography to demonstrate that the mutant mice had reduced fractional shortening, left ventricular mass, wall thickness, and dilated cardiomyopathy before performing the comparative cDNA microarray analysis from 6-week-old LmnaN195K/N195K and the WT control ventricles.
Series GSE123916 was based on platform GPL21103 and evaluated using high-throughput sequencing. A total of 8 samples were selected in GSE123916, which included 4 LmnaD300N mutant and 4 WT control left ventricle tissues of mouse heart. The contributors of GSE123916 discovered that the expression of the mutant LMNAD300N protein in cardiac myocytes led to severe fibrosis, apoptosis, and cardiac dysfunction based on immunoblotting and echocardiography analyses. Bulk RNA-sequencing analysis was then used by the contributors to gain insights into the molecular pathogenesis of DCM caused by LMNA mutation using 2-week-old WT mice and mice expressing mutant LMNA (LMNAD300N) [12].
Differential expression analysis
First, background signal corrections and data normalizations of the 2 series were conducted using the preprocessCore package of R/bio-conductor (https://bioconductor.org/packages/release/bioc/html/preprocessCore.html). Next, the limma package of R/bio-conductor [17] (http://bioconductor.org/packages/release/bioc/html/limma.html) was used to screen the DEGs between LMNA-related DCM and normal WT healthy heart tissue samples. An unpaired t-test was applied in GSE36502, whereas the Mann-Whitney U test was applied in GSE123916. Expression data with p-value <0.05 and fold change (FC) ≥2 (namely, the absolute value of log2 fold change ≥1) were defined as significant DEGs. Venn diagrams (http://bioinformatics.psb.ugent.be/webtools/Venn/) depict the overlap of up-regulated and down-regulated DEGs in the 2 series. Overlapping DEGs were selected as common DEGs (co-DEGs).
Enrichment analysis of co-DEGs
The clusterProfiler of R/bio-conductor [18] (http://www.bioconductor.org/packages/release/bioc/html/clusterProfiler.html) was implemented for Gene Ontology (GO) enrichment function analysis [19] and Kyoto Encyclopedia of Genes and Genomes (KEGG) pathway analysis [20]. The functions of co-DEGs were grouped into biological processes (BPs), cellular components (CCs), and molecular function (MF). The enriched modules were then visualized in the bubble diagram and bar diagram. Results with an adjusted p-value <0.05 were considered significant.
Interactions between co-DEGs
The Search Tool for the Retrieval of Interacting Genes/Proteins (STRING) database (https://string-db.org/) stores all publicly available sources of protein–protein interaction (PPI) information [21]. Therefore, the PPIs between co-DEGs were determined using STRING with a criterion of medium confidence >0.4. Thereafter, the network of interactions was imported into Cytoscape (http://apps.cytoscape.org/), an open-source software project for integrating biomolecular interaction networks [22]. The application MCODE in Cytoscape was used to find core node clusters, and the application cytoHubba in Cytoscape was applied to select the top 10 hub nodes ranked by Maximal Clique Centrality (MCC) topological algorithms.
Transcriptional factor (TF) regulatory network of key genes
NetworkAnalyst (https://www.networkanalyst.ca/NetworkAnalyst/home.xhtml) is a visual analytic platform for comprehensive gene expression profiling and meta-analysis [23], which can support the integrative analysis of TF-gene interactions for given genes. In our study, the TFs of given genes were analyzed using NetworkAnalyst, wherein the ENCODE database [24] was chosen to obtain TF-gene interaction information. The gene-TF regulatory network was constructed and visualized using Cytoscape software.
Analyzing co-DEGs in modules selected with weighted gene co-expression network analysis (WGCNA)
The WGCNA algorithm is a systems biology method for describing the correlation patterns among genes across samples. The R WGCNA package [25] was used to construct a scale-free co-expression network for the hub genes. Based on statistical analysis, the powers of β=9 (GSE123916) and β=20 (GSE36502) were set as the soft thresholds to ensure a scale-free network. The cluster dendrogram of all hub genes was then obtained, and the relationship between each module and traits was calculated. Next, a heatmap was used to display module-trait relationships. Significant modules were defined with a p-value <0.05. Modules that scored the highest association with LMNA-related DCM were selected for further analysis.
To analyze the co-DEGs in selected modules, new PPI networks were constructed, and the top 10 nodes in these new PPIs were scored and compared with the previous 10 nodes.
Animals
Four-month-old C57BL/6J male mice carrying the human LMNA gene with E82K mutation, which has been widely used to study the mechanism of DCM [14], were bought from the Institute of Laboratory Animal Science (Chinese Academy of Medical Sciences, Beijing, China). Lmna (E82K) transgenic mouse lines were reported to exhibit thin-walled, dilated left and right ventricles and progressive decrease in contractile function at 4 months of age, which was assessed using echocardiography [14]. Control WT C57BL/6J male mice with matched age were bought from the Department of Laboratory Animals of Central South University (Central South University, Changsha, China). Animal experiments were conducted after approval of the ethical review board of the experimental animal welfare of Central South University (NO: 2019sydw0237). Only male mice were used in the current study to exclude the effects of estrogen; the impact of sex in LMNA-related DCM will be investigated in future studies.
Mice were housed in a specific pathogen free barrier facility at the Department of Laboratory Animals of Central South University. The room temperature was maintained at 22±2°C with a 12-h light (07: 00 to 19: 00 h) and 12-h dark (19: 00 to 07: 00 h) cycle. Food and water were provided ad libitum. Mice were housed in groups of 4 or 5 in individually ventilated cages. After a week of adjustable feeding, mice were sacrificed using deep CO2 anesthesia. The depth of anesthesia was determined by the pedal reflex test. If the mouse responded to a toe pinch, an additional 60 seconds of CO2 was given. Next, the chest was opened and the heart exposed, and the heart was removed and irrigated with normal saline before weighting. At the conclusion of the experiment, all mice were sacrificed.
Reverse transcription-polymerase chain reaction
Total RNA from heart left ventricular free wall tissues were obtained using TRIzol (Code No. 9109, Takara, Japan) according to the manufacturer’s instructions. The quantity of RNA was measured with NanoDrop One (Thermo Scientific, USA). PrimeScript™ RT reagent kit with gDNA Eraser (Perfect Real Time) (Code No. RR047A, Takara, Japan) was used to obtain cDNA, according to the manufacturer’s instructions. For RT-PCR, TB Green® Premix Ex Taq™ (Tli RNaseH Plus) (Code No. RR420A, Takara, Japan) was used according to the manufacturer’s instructions. Primers (Sangon Biotech, Shanghai, China) are shown in Supplementary Table 1. Each group included 7 or 8 independent heart samples, and the presented data are representative of at least 3 independent experiments in Applied Biosystems 7500/7500Fast Real-Time PCR machine (Applied Biosystems, America). Gene expression relative to endogenous control was calculated following the 2−ΔΔCT method.
Statistical analysis
After RT-PCR, t-tests were used to analyze the scores of different groups when the data were normally distributed, and nonparametric tests were used otherwise. Data are expressed as mean±standard deviation. SPSS (IBM SPSS Statistics, Version 20) was used for analysis and differences were considered significant at 0.01< p<0.05, highly significant at 0.001< p<0.01, and very highly significant at p<0.001.
Results
Identification of DEGs
Box-plots showed that the median expression values of all samples were similar in both series, indicating the high quality of data after background signal correction and normalization (Supplementary Figure 1). A total of 1630 DEGs, including 845 up-regulated and 785 down-regulated genes, were screened from the GSE36502 database by comparing the left ventricular free wall tissue samples of LmnaN195K/N195K mutant mice with that of the WT control mice. The same analysis was applied in GSE123916. A total of 1250 DEGs consisting of 664 up-regulated and 586 down-regulated genes were screened from GSE123916. The top 10 up-regulated and the top 10 down-regulated DEGs of GSE36502 and GSE123916 are listed in Supplementary Table 2. Venn diagrams of up-regulated and down-regulated DEGs are shown in Figure 2A and 2B, respectively. A total of 156 common DEGs (co-DEGs) with 80 up-regulated and 76 down-regulated genes were thus identified. We also found some DEGs showing different regulatory trends in GSE36502 and GSE123916. For example, Col6a1, Col6a2, and Col6a3 were down-regulated in GSE36502 but up-regulated in GSE123916 (Supplementary Table 3).
Figure 2.
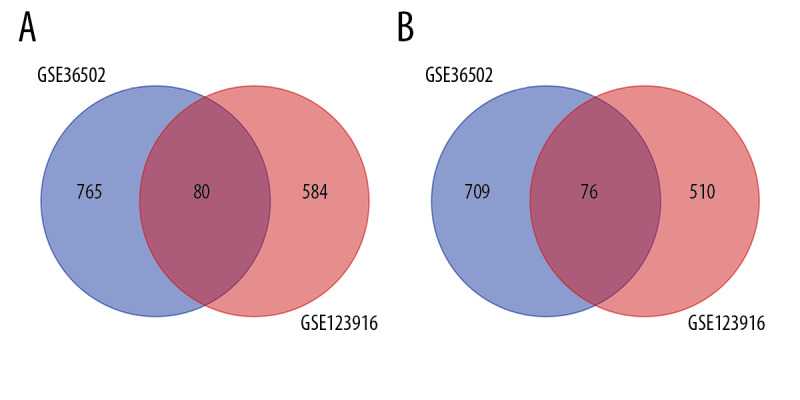
Venn diagram of common differentially expressed genes (co-DEGs). (A) Venn diagram of up-regulated co-DEGs. (B) Venn diagram of down-regulated co-DEGs.
Functional and pathway enrichment analysis of DEGs
GO and KEGG pathway analyses were performed to reveal the functions of co-DEGs. The biological processes of the co-DEGs were found to mostly pertain to response to oxidative stress, regulation of apoptotic signaling pathway, and fibroblast proliferation (Figure 3A) via GO analysis. In the GO cellular component analysis, most co-DEGs were found to be closely related to the receptor complex, membrane raft, sarcomere, and contractile fiber part (Figure 3A). In the GO molecular function analysis, the majority of co-DEGs were clustered with receptor-ligand activity, peptide binding, and amide binding (Figure 3A). Five significantly enriched pathways were identified through KEGG pathway enrichment analysis (Figure 3B). Pathways involved in antigen processing and presentation, small cell lung cancer, and the MAPK signaling pathway were scored as the top 3 pathways that were most strongly associated with co-DEGs.
Figure 3.

Functional and pathway enrichment analysis of common differentially expressed genes (co-DEGs). (A) Gene Ontology (GO) analysis results of co-DEGs in biological process (BP), cellular component (CC), and molecular function (MF). (B) Kyoto Encyclopedia of Genes and Genomes (KEGG) pathways analysis results of co-DEGs.
PPI network construction and module analysis
PPI networks were constructed to visualize the relationship between proteins encoded by co-DEGs (Figure 4A) and disconnected nodes in the network were hidden. Four significant modules from PPI networks of co-DEGs were extracted, including module 1 (score 8.667), module 2 (score 4), module 3 (score 3.333), and module 4 (score 3). In addition, with module 1 in Figure 4A as an example, 13 nodes including Lox, Ctgf, Myc, Mmp14, Cdkn1a, Timp1, Adipoq, Spp1, Fos, Hspa1b, Hmox1, Socs3, and Ptgs2 with 52 edges were found.
Figure 4.

Protein–protein interaction (PPI) network and module analysis among common differentially expressed genes (co-DEGs), and transcriptional factor (TF) regulatory network analysis among key genes. (A) PPI network construction and module analysis of co-DEGs. (B) The top 10 hub nodes (10 “key genes”) in the PPI network of co-DEGs. (C) TF regulatory network analysis of key genes. Genes are depicted as ellipses and TF as rectangles. Disconnected nodes in the network are hidden in (A, C).
As shown in Figure 4B, the top 10 hub nodes in the PPI network were Ptgs2 (score 1884), Timp1 (score 1500), Myc (score 1452), Fos (score 1398), Hmox1 (score 1396), Ctgf (score 1329), Spp1 (score 1210), Atf3 (score 604), Lox (score 367), and Adipoq (score 305). These top 10 hub nodes were selected as the 10 “key genes” in our study. All these key genes were up-regulated except Adipoq. More importantly, all 10 key genes were included in the 4 modules.
TF regulatory network analysis of key genes
To identify TFs of the 10 key genes we selected, a gene-TF regulatory network was constructed using the NetworkAnalyst platform. According to the TF-gene interaction information derived from in the ENCODE ChIP-seq database in the NetworkAnalyst platform, only peak intensity signal <500 and the predicted regulatory potential score <1 were used. The TF-gene interaction network was then constructed with 44 interaction pairs among 5 genes and 24 TFs (Figure 4C). Three TFs (ELF1, ETS1, and NRF1) were identified with a connectivity degree >2 in the gene-TF regulatory network, which suggests that these 3 TFs may have strong regulatory effects on the key genes.
Weighted co-expression network construction analysis and module selection
To analyze associations between our co-DEGs and the traits of LMNA-related DCM, we performed the WGCNA and selected the significant modules. To begin with, the samples of GSE36502 were clustered using the average linkage method and Pearson’s correlation method (Figure 5A). Then, the co-expression analysis was carried out to construct the co-expression gene network. In this part, the power of 0.9 (Scale-Free R2) was selected as the soft-thresholding parameter to ensure a scale-free network (Figure 5B, 5C). Furthermore, total modules were identified via the average linkage hierarchical clustering (Figure 5D). Finally, the blue module (score 0.98, p=6e-04) was found to have the highest association associated with LMNA-related DCM (Figure 5E), which was selected as the most significant module for further analysis. The same analysis was applied in GSE123916 (Figure 6), and the turquoise module (score 1, p=3e-07) was selected as the most significant.
Figure 5.

Weighted co-expression network analysis (WGCNA) construction and key module identification of GSE36502. (A) Sample clustering dendrogram. (B, C) Determination of soft-thresholding power in the WGCNA. Analysis of the scale-free fit index for various soft-thresholding powers (B). Analysis of the mean connectivity for various soft-thresholding powers (C). (D) Dendrogram of all DEGs clustered. (E) Heatmap of the association between module genes and traits of LMNA-related DCM mice.
Figure 6.

Weighted co-expression network analysis (WGCNA) construction and key module identification of GSE123916. (A) Sample clustering dendrogram. (B, C) Determination of soft-thresholding power in the WGCNA. Analysis of the scale-free fit index for various soft-thresholding powers (B). Analysis of the mean connectivity for various soft-thresholding powers (C). (D) Dendrogram of all clustered DEGs. (E) Heatmap of the association between module genes and traits of LMNA-related DCM mice.
Overlapping genes in the blue module of GSE36502 or the turquoise module of GSE123916 and the 156 co-DEGs discovered before are shown in Figure 7A and 7C, respectively. There were 79 and 143 co-DEGs in the overlapping area, as shown in Figure 7A and 7C, respectively. New PPI networks were constructed using the 79 or 143 overlapping genes, and the new top 10 hub nodes are shown in a hexagonal shape (Figure 7B, 7D). Two of the 10 key genes were found in the new top 10 hub genes of GSE36502, whereas 9 were found in GSE123916. Key genes in Figure 7B and 7D are displayed in orange with disconnected nodes in the network hidden.
Figure 7.

Protein–protein interaction (PPI) network and module analysis in the selected modules with common differentially expressed genes (co-DEGs). (A) Venn diagram of co-DEGs and genes in blue module of GSE36502. (B) The PPI network of overlapped 79 co-DEGs in blue module of GSE36502. The new top 10 nodes are shown in hexagonal shape. Two “key genes” are displayed in orange. (C) Venn diagram of co-DEGs and hub genes in turquoise module of GSE123916. (D) The PPI network of overlapped 143 co-DEGs in turquoise module of GSE123916. The new top 10 nodes are shown in hexagonal shape. Nine key genes are displayed in orange color. Disconnected nodes in the network are hidden in (B, D).
Validation of the top 10 key genes in LMNA E82K transgenic mice
Four-month-old WT C57BL/6J male mice and C57BL/6J male mice with human LMNA E82K gene (LMNA) were included in the study. No significant difference in body weights (WT 29.22±2.38 g vs. LMNA 30.73±1.93 g) were observed between groups, but heart weights were different (WT 0.13±0.01 g vs. LMNA 0.15±0.01 g; p=0.007). The relative heart weight refers to the proportion of total heart weight compared with the weight of the body. The relative heart weights were different (WT 0.45±0.04% vs. LMNA 0.49±0.04%; p=0.048). The baseline characteristics of mice are shown in Supplementary Table 4 and Supplementary Figure 2.
Relative mRNA expression of the 10 key genes was analyzed using RT-PCR. As shown in Figure 8, 6 key genes showed significantly different levels: Ptgs2 (WT 1.44±0.53 vs. LMNA 0.81±0.34, p=0.017), Timp1 (WT 0.67±0.16 vs. LMNA 1.55±0.30, p<0.001), Hmox1 (WT 0.84±0.14 vs. LMNA 1.28±0.51, p=0.035), Spp1 (WT 0.58±0.34 vs. LMNA 1.87±0.66, p<0.001), Atf3 (WT 0.69±0.23 vs. LMNA 1.72±1.08, p=0.031), and Adipoq (WT 8.87±4.30 vs. LMNA 0.10±0.05, p=0.001). Interestingly, the gene Ptgs2 showed a different trend compared with the previous analysis of co-DEGs.
Figure 8.

RT-PCR results of 10 key genes. (A) The relative expression of Ptgs2 (WT 1.439±0.529 vs. LMNA 0.819±0.342, p=0.017). (B) The relative expression of Timp1 (WT 0.671±0.156 vs. LMNA 1.553±0.296, p<0.001). (C) The relative expression of Myc (WT 1.050±0.155 vs. LMNA 0.970±0.178, p=0.367). (D) The relative expression of Fos (WT 1.176±0.619 vs. LMNA 1.102±0.610, p=0.812). (E) The relative expression of Hmox1 (WT 0.842±0.143 vs. LMNA 1.281±0.512, p=0.035). (F) The relative expression of Ctgf (WT 1.071±0.513 vs. LMNA 1.099±0.361, p=0.902). (G) The relative expression of Spp1 (WT 0.584±0.338 vs. LMNA 1.876±0.665, p<0.001). (H) The relative expression of Atf3 (WT 0.689±0.233 vs. LMNA 1.721±1.083, p=0.031). (I) The relative expression of Lox (WT 1.006±0.258 vs. LMNA 1.037±0.157, p=0.786). (J) The relative expression of Adipoq (WT 8.873±4.298 vs. LMNA 0.104±0.052, p=0.001). n=7 to 8 mice per group. Mean±standard deviation. 0.01≤ p<0.05 (*), 0.001≤ p<0.01 (**), and p<0.001 (***).
Discussion
Increasing evidence shows that DCM may originate from various pathogenic factors such as genetic variations, environmental effects, and other unknown factors [2]. However, genetic variations have become more important owing to their diversity and complexity. Currently, many genes, such as LMNA, TTN, cTnT, and TNNI3K, are known to have DCM-related genetic mutations [2,26–31]. Among such cases, LMNA-related DCM has a high prevalence (6.2%) in familial DCM patients with frequent conduction blocks and arrhythmias, especially in young patients [7]. Unfortunately, the mechanism of LMNA mutations in humans is still unclear, and no biomarkers for LMNA-related DCM have been found. Therefore, a better understanding of LMNA-related DCM in mouse models may give some new insights into potential therapeutic applications using genetic or biological targeted therapy for DCM patients.
Our present study used the GEO database (GSE36502 and GSE123916) to obtain gene expression profiles from mice with LMNA-related DCM. These profiles were screened for co-DEGs. We identified 156 co-DEGs from GSE36502 and GSE123916 and then performed functional enrichment analyses and meaningful pathways enrichment analyses on them. Next, PPI analysis was carried out to identify the hub genes that may play a crucial regulatory role in the pathophysiology of LMNA-related DCM. We selected 10 key genes in our study. At the same time, we used another mouse model carrying the human LMNA E82K mutant gene to verify the expression level of the selected key genes using RT-PCR. Five genes in LMNA-related DCM (Timp1, Hmox1, Spp1, Atf3, and Adipoq) were verified. In addition, we found 3 TFs (ELF1, ETS1, and NRF1) that may have strong regulatory effects on the key genes. We performed the WGCNA to select the most relevant modules (clusters of highly correlated genes) for external sample traits, and compared the proportion of the co-DEGs in the selected modules.
Three different LMNA-related DCM mouse models were used in our study. The series GSE36502 includes the LmnaN195K mouse model, and the series GSE123916 includes the LMNAD300N mouse model. The contributors of these 2 GEO database series confirmed that the mice had LMNA-related DCM phenotypes using echocardiography analysis. Previous studies have shown that LmnaN195K/N195K mice die at an early age owing to arrhythmia, using electrocardiographic monitoring of cardiac activity [32]. Likewise, the contributors of the series GSE36502 performed cDNA microarray analysis from LmnaN195K/N195K and WT control ventricles from mice at 6 weeks age. We also used a mouse model carrying the human LMNA E82K gene to perform RT-PCR verification. This mouse model was previously reported to show the DCM phenotype at 4 months of age by echocardiography analysis [14]. Relative heart weights were different between the LMNA E82K mice and the WT mice groups (Supplementary Table 4 and Supplementary Figure 2). The increase in relative heart weight was also reported in DCM patients. This increase was attributed to reactive growth processes in myocytes and the architectural rearrangement of the muscles in the myocardium, which suggests the process of ventricular remodeling and the occurrence of cardiac failure in DCM [33]. Although different LMNA mutation mouse models showed different survival periods, the 3 models used in our study were all valid.
GO and KEGG analyses revealed several potential enriched functional terms and pathways involved in LMNA-related DCM. In our study, GO and KEGG pathway analyses were applied to co-DEGs rather than the individual GEO set because some DEGs showed different regulated orientation in individual GEO sets (Supplementary Table 3). In the GO analysis, the enriched biological processes were associated with the regulation of apoptotic signaling pathway and fibroblast proliferation. Similar results were reported based on immunoblotting analysis in LMNA D300N mice, in which the expression of the mutant LMNA D300N protein in cardiac myocytes leads to severe fibrosis and apoptosis [12]. The LMNA E82K mutation was previously shown to activate FAS and mitochondrial pathways of apoptosis in heart tissue-specific transgenic mice [14]. Interestingly, after treatment with 0.8 mmol/L hydrogen peroxide, higher activation of apoptosis was observed in HEK293 cells (a human cell line) transfected with E82K mutation compared with HEK293 cells transfected with WT LMNA gene [34], which indicates that our research in mice may provide a basis for further studies in humans. In addition, it was reported that the MAPK pathway contributed to the pathological process of DCM in LMNA H222P mutant mice [15]. Therefore, prior reports corroborate the accuracy of our outcomes.
PPI networks display proteins and their functional interactions, which could help us understand the biological processes and the development of many diseases [21]. Hub genes, namely Ptgs2, Timp1, Myc, Fos, Hmox1, Ctgf, Spp1, Atf3, Lox, and Adipoq were identified in analyzing the PPI network of the co-DEGs as key genes, indicating that these genes may be vital in the mechanism of LMNA-related DCM. Five genes (Timp1, Hmox1, Spp1, Atf3, and Adipoq) showed significant expression and the same trend after PT-PCR verification (Figure 8). Adipoq (adiponectin), the only down-regulated gene, was shown to be involved in abnormal lipid profile and coronary microvascular dysfunction in patients with DCM [35] and was confirmed to be down-regulated based on cardiac mRNA and protein levels [36]. Down-regulation of Adipoq mRNA relative expression in our PCR results was similar to that in human DCM. Timp1 (tissue inhibitor of metalloproteinase 1) and Spp1 (secreted phosphoprotein 1 or osteopontin) were 2 verified up-regulated genes associated with the fibrosis process or extracellular matrix development. Many studies have shown their up-regulation in the DCM myocardium [37–40], which is consistent with our results. For instance, myocardial Spp1 expression was associated with collagen fibrinogenesis in DCM [39]. Hmox1 (heme oxygenase-1) and Atf3 (activating transcription factor 3) were up-regulated in our PCR results. Although no direct studies have shown the relationships between Hmox1 or Atf3 and DCM, Hmox1 was reported to have a protective role in oxidative injury [41]. In addition, high levels of Hmox1 in failing myocardium may suggest a cardiovascular adaptive role to hypoxic stress [42]. Atf3 deficiency promoted cardiac hypertrophy, dysfunction, and fibrosis in pressure-overload mice [43]. Interestingly, Ptgs2 was down-regulated in PCR experiments, in contrast to the bioinformatic results. The induction of Ptgs2 was reported in the myocardium of failing human hearts [44,45]. However, in the Tgalphaq*44 transgenic mouse model of DCM, no evident alteration in the expression of Ptgs2 was seen compared with control FVB mice [46]. Thus, the expression of Ptgs2 in DCM deserves further research. Based on our findings, there could be some new mechanisms in LMNA-related DCM to explore.
We performed WGCNA to find and select the modules most relevant for external sample traits in LMNA-related DCM mice. We calculated the module-trait relationship of individual GEO sets. We then analyzed the proportion of co-DEGs in the selected modules. Most co-DEGs were discovered in the blue module of GSE36502 or in the turquoise module of GSE123916, which suggests that most of our co-DEGs may play important roles in the development of LMNA-related DCM mice. In addition, most key genes were identified as new hub genes (shaped as hexagons in Figure 7B, 7D), indicating that our key genes may still participate in the development of the external sample traits in LMNA-related DCM mice.
Transcription factors are the regulators of gene expression and are critically associated with the development and progression of diseases. We identified 3 TFs (ELF1, ETS1, and NRF1) that may have strong regulatory effects on the above 5 genes (Figure 4C). An additional 5 key genes, which were no less important, were not shown in our TF-gene interaction network because of the formula mode of NetworkAnalyst platform. ELF1 and ETS1 are members of the ETS transcription factor family, characterized by an ETS-domain [47]. Many ETSs have been shown to participate in MAPK pathways and to contribute to different biological processes such as hematopoiesis, angiogenesis, cancer development, and neuronal development [48]. For example, a VEGF/MAPK/ETS pathway was identified in the vascular system [49], and ELK1/4, another member of the ETS family, was shown to interact with other cardiac TFs in congenital heart disease [50]. Few studies have reported the relationship between the ETS family and DCM, suggesting a direction for future studies. As for NRF1, over-expression of Hmox1 was reported to promote mitochondrial biogenesis by up-regulating NRF1 in doxorubicin-treated mice [41], which matched our results that NRF1 can interact with Hmox1. NRF1 also regulated the metabolic remodeling of heart failure via DNA methylation of its downstream targets [51], which suggests that NRF1 regulates the expression of genes in some other ways.
Although our study included a large sample size and presented a comprehensive and systematic study, we should acknowledge some limitations of our work. The sample size in each GEO database series was small, and not all 10 key genes showed statistically significant variation in the RT-PCR validation. For example, the Myc gene, an important TF, was up-regulated in the GSE123916 in a previous study [12] but not in our PCR results. The reason may be related to differences in the mutation type of the LMNA gene, which we plan to study in the future.
Conclusions
In conclusion, our study used integrated bioinformatic analyses and revealed important genes in LMNA-related DCM mice, which could provide novel insights into the understanding of the mechanism underlying human LMNA-related DCM. These genes also have potential applications in genetic or biological targeted therapy. However, further studies are still required.
Supplementary Data
Supplementary Table 1.
Primers for RT-PCR.
| Number | Mouse gene name | Primers |
|---|---|---|
| 1 | Ptgs2 | Forward: 5′-ACACACTCTATCACTGGCACC-3′ |
| Reverse: 5′-TTCAGGGAGAAGCGTTTGC-3′ | ||
| 2 | Timp1 | Forward: 5′-GCAACTCGGACCTGGTCATAA-3′ |
| Reverse: 5′-CGGCCCGTGATGAGAAACT-3′ | ||
| 3 | Myc | Forward: 5′-TTTTTGTCTATTTGGGGACAGTG-3′ |
| Reverse: 5′-CATCGTCGTGGCTGTCTG-3′ | ||
| 4 | Fos | Forward: 5′-CGGGTTTCAACGCCGACTA-3′ |
| Reverse: 5′-TTGGCACTAGAGACGGACAGA-3′ | ||
| 5 | Hmox1 | Forward: 5′-CCTCACTGGCAGGAAATCATC-3′ |
| Reverse: 5′-CCTCGTGGAGACGCTTTACATA-3′ | ||
| 6 | Ctgf | Forward: 5′-CCACCCGAGTTACCAATGAC-3′ |
| Reverse: 5′-GTGCAGCCAGAAAGCTCA-3′ | ||
| 7 | Spp1 | Forward: 5′-AGCTCAGAGGAGAAGCTT-3′ |
| Reverse: 5′-CTTCAGAGGACACAGCAT-3′ | ||
| 8 | Atf3 | Forward: 5′-GAGGATTTTGCTAACCTGACACC-3′ |
| Reverse: 5′-TTGACGGTAACTGACTCCAGC-3′ | ||
| 9 | Lox | Forward: 5′-GCACTGCACACACACAGGGA-3′ |
| Reverse: 5′-TTAGTGTAGTCTGATTCAGG-3′ | ||
| 10 | Adipoq | Forward: 5′-TTAATCCTGCCCAGTCATGCC-3′ |
| Reverse: 5′-CCCTTCAGCTCCTGTCATTCC-3′ | ||
| 11 | β-actin | Forward: 5′-GTGCTATGTTGCTCTAGACTTCG-3′ |
| Reverse: 5′-ATGCCACAGGATTCCATACC-3′ |
Supplementary Table 2.
Top 10 up-regulated and top 10 down-regulated differentially expressed genes (DEGs) of GSE36502 and GSE123916.
| GSE36502 | GSE123916 | ||||||
|---|---|---|---|---|---|---|---|
| Gene ID | log2FC | P value | Gene ID | log2FC | P value | ||
| Up DEGs | Dusp4 | 5.972088873 | 0.000000731 | Up DEGs | Spp1 | 7.754333296 | 0.028571429 |
| Serpina3n | 5.902067944 | 0.000007360 | Atp6v0d2 | 7.485271341 | 0.029401048 | ||
| Eif2s3y | 5.798138132 | 0.009234260 | Ereg | 6.147693779 | 0.028571429 | ||
| Ddx3y | 5.754254922 | 0.025707228 | Il6 | 5.746340944 | 0.028571429 | ||
| Cyp2b10 | 5.710190211 | 0.000000004 | Thbs4 | 5.509486792 | 0.028571429 | ||
| Psca | 5.308134293 | 0.000261828 | Crlf1 | 5.509413267 | 0.028571429 | ||
| Tmem87a | 4.802065975 | 0.000000038 | Nppa | 5.094343298 | 0.028571429 | ||
| Saa3 | 4.726369664 | 0.000403197 | Gdf15 | 5.055361703 | 0.028571429 | ||
| Spp1 | 4.319595585 | 0.000105889 | Thbs1 | 4.851951747 | 0.028571429 | ||
| Clec4d | 4.261690165 | 0.000000303 | Tnc | 4.79000984 | 0.028571429 | ||
| Down DEGs | Car3 | −5.146389732 | 0.000003580 | Down DEGs | Olfr1033 | −21.34638774 | 0.028429536 |
| Cfd | −4.232054779 | 0.000003800 | Apoa2 | −7.005968858 | 0.029401048 | ||
| Cenpf | −3.793225406 | 0.000001220 | Adipoq | −5.228469128 | 0.028571429 | ||
| Apln | −3.754582347 | 0.000001940 | Car3 | −5.177858668 | 0.028571429 | ||
| Olfr176 | −3.369978757 | 0.000001280 | Baiap2l1 | −4.721168954 | 0.028571429 | ||
| Itgb6 | −3.269411078 | 0.000008870 | Clcn1 | −4.433413719 | 0.028571429 | ||
| F830016B08Rik | −3.256671481 | 0.002654215 | Pah | −4.019766469 | 0.028571429 | ||
| Hdhd3 | −3.212583121 | 0.000017100 | Lgr6 | −3.963562023 | 0.028571429 | ||
| Cpxm2 | −3.06989206 | 0.000017400 | Tmprss13 | −3.951270715 | 0.028571429 | ||
| Hdgfl1 | −3.067331901 | 0.000001190 | Hsd17b7 | −3.548425654 | 0.028571429 | ||
Background signal correcting and normalization. (A) Series GSE36502 before normalization. (B) Series GSE36502 after normalization. (C) Series GSE123916 before normalization. (D) Series GSE123916 after normalization.
Supplementary Table 3.
Baseline data of mice. (A, B) Body and heart weight of mice. Body weight (WT 29.219±2.387 g vs. LMNA 30.732±1.936 g). Heart weights (WT 0.130±0.014 g vs. LMNA 0.150±0.011 g; p=0.007). n=8 mice per group. Mean±standard deviation. 0.01≤ p<0.05 (*), 0.001≤ p<0.01 (**), and p<0.001 (***). (C) The relative heart weight of mice (WT 0.45±0.04% vs. LMNA 0.49±0.04%; p=0.048). The relative heart weight refers to the proportion of total heart weight compared with the weight of the body. (D) Shape of hearts. LMNA on left, WT on right.
Supplementary Table 4.
Body and heart weight of mice.
| Group | Weight (g) | Group | Weight (g) | ||||
|---|---|---|---|---|---|---|---|
| WT | Body | Heart | Heart/body | LMNA | Body | Heart | Heart/body |
| WT1 | 29.65 | 0.11 | 0.003709949 | A24 | 30.00 | 0.14 | 0.004666667 |
| WT2 | 25.12 | 0.12 | 0.00477707 | A25 | 32.64 | 0.17 | 0.005208333 |
| WT3 | 30.4 | 0.14 | 0.004605263 | A28 | 29.32 | 0.14 | 0.004774898 |
| WT4 | 29.54 | 0.12 | 0.004062288 | A32 | 29.54 | 0.15 | 0.005077861 |
| WT5 | 28.14 | 0.14 | 0.004975124 | A41 | 34.73 | 0.14 | 0.004031097 |
| WT6 | 33.00 | 0.15 | 0.004545455 | A69 | 30.28 | 0.16 | 0.005284016 |
| WT7 | 27.25 | 0.12 | 0.00440367 | A71 | 29.35 | 0.15 | 0.005110733 |
| WT8 | 30.65 | 0.14 | 0.0045677 | A74 | 30.00 | 0.15 | 0.005 |
| Average | 29.21875 | 0.13 | 0.004455815 | Average | 30.7325 | 0.15 | 0.004894201 |
| Std. deviation | 2.38658 | 0.01414 | 0.000401724 | Std. deviation | 1.93557 | 0.01069 | 0.00040592 |
Acknowledgments
We would like to thank Editage (www.editage.cn) for English language editing.
Footnotes
Availability of data and material
Please contact the corresponding author for all data requests.
Ethics approval and consent to participate
Animal experiments were conducted after approval of the ethical review board of the experimental animal welfare of Central South University (NO: 2019sydw0237).
Conflict of interest
None.
Source of support: This work was funded by the Chinese Cardiovascular Association V.G foundation (No. 2017-CCA-VG-005)
References
- 1.Hershberger RE, Morales A. LMNA-related dilated cardiomyopathy. In: Adam MP, Ardinger HH, Pagon RA, et al., editors. GeneReviews®. Seattle (WA): University of Washington, Seattle; 1993. [PubMed] [Google Scholar]
- 2.Weintraub RG, Semsarian C, Macdonald P. Dilated cardiomyopathy. Lancet. 2017;390:400–14. doi: 10.1016/S0140-6736(16)31713-5. [DOI] [PubMed] [Google Scholar]
- 3.Arbustini E, Pilotto A, Repetto A, et al. Autosomal dominant dilated cardiomyopathy with atrioventricular block: A lamin A/C defect-related disease. J Am Coll Cardiol. 2002;39:981–90. doi: 10.1016/s0735-1097(02)01724-2. [DOI] [PubMed] [Google Scholar]
- 4.Xiong Z, Lu Y, Xue J, et al. Hutchinson-Gilford progeria syndrome accompanied by severe skeletal abnormalities in two Chinese siblings: two case reports. J Med Case Rep. 2013;7:63. doi: 10.1186/1752-1947-7-63. [DOI] [PMC free article] [PubMed] [Google Scholar]
- 5.Gonzalo S, Kreienkamp R, Askjaer P. Hutchinson-Gilford progeria syndrome: A premature aging disease caused by LMNA gene mutations. Ageing Res Rev. 2017;33:18–29. doi: 10.1016/j.arr.2016.06.007. [DOI] [PMC free article] [PubMed] [Google Scholar]
- 6.Wang S, Peng D. Cardiac involvement in Emery-Dreifuss muscular dystrophy and related management strategies. Int Heart J. 2019;60:12–18. doi: 10.1536/ihj.17-604. [DOI] [PubMed] [Google Scholar]
- 7.Hasselberg NE, Haland TF, Saberniak J, et al. Lamin A/C cardiomyopathy: Young onset, high penetrance, and frequent need for heart transplantation. Eur Heart J. 2018;39:853–60. doi: 10.1093/eurheartj/ehx596. [DOI] [PMC free article] [PubMed] [Google Scholar]
- 8.Yancy CW, Jessup M, Bozkurt B, et al. 2017 ACC/AHA/HFSA Focused Update of the 2013 ACCF/AHA Guideline for the Management of Heart Failure: A report of the American College of Cardiology/American Heart Association Task Force on Clinical Practice Guidelines and the Heart Failure Society of America. Circulation. 2017;136:e137–61. doi: 10.1161/CIR.0000000000000509. [DOI] [PubMed] [Google Scholar]
- 9.Yancy CW, Jessup M, Bozkurt B, et al. 2013 ACCF/AHA guideline for the management of heart failure: A report of the American College of Cardiology Foundation/American Heart Association Task Force on Practice Guidelines. J Am Coll Cardiol. 2013;62:e147–239. doi: 10.1016/j.jacc.2013.05.019. [DOI] [PubMed] [Google Scholar]
- 10.Peretto G, Sala S, Benedetti S, et al. Updated clinical overview on cardiac laminopathies: An electrical and mechanical disease. Nucleus. 2018;9:380–91. doi: 10.1080/19491034.2018.1489195. [DOI] [PMC free article] [PubMed] [Google Scholar]
- 11.Wang X, Zabell A, Koh W, Tang WH. Lamin A/C cardiomyopathies: Current understanding and novel treatment strategies. Curr Treat Options Cardiovasc Med. 2017;19:21. doi: 10.1007/s11936-017-0520-z. [DOI] [PubMed] [Google Scholar]
- 12.Chen SN, Lombardi R, Karmouch J, et al. DNA damage response/TP53 pathway is activated and contributes to the pathogenesis of dilated cardiomyopathy associated with LMNA (lamin A/C) mutations. Circ Res. 2019;124:856–73. doi: 10.1161/CIRCRESAHA.118.314238. [DOI] [PMC free article] [PubMed] [Google Scholar]
- 13.Sui T, Liu D, Liu T, et al. LMNA-mutated rabbits: A model of premature aging syndrome with muscular dystrophy and dilated cardiomyopathy. Aging Dis. 2019;10:102–115. doi: 10.14336/AD.2018.0209. [DOI] [PMC free article] [PubMed] [Google Scholar]
- 14.Lu D, Lian H, Zhang X, et al. LMNA E82K mutation activates FAS and mitochondrial pathways of apoptosis in heart tissue specific transgenic mice. PLoS One. 2010;5:e15167. doi: 10.1371/journal.pone.0015167. [DOI] [PMC free article] [PubMed] [Google Scholar]
- 15.Muchir A, Pavlidis P, Decostre V, et al. Activation of MAPK pathways links LMNA mutations to cardiomyopathy in Emery-Dreifuss muscular dystrophy. J Clin Invest. 2007;117:1282–93. doi: 10.1172/JCI29042. [DOI] [PMC free article] [PubMed] [Google Scholar]
- 16.Barrett T, Wilhite SE, Ledoux P, et al. NCBI GEO: Archive for functional genomics data sets – update. Nucleic Acids Res. 2013;41:D991–95. doi: 10.1093/nar/gks1193. [DOI] [PMC free article] [PubMed] [Google Scholar]
- 17.Ritchie ME, Phipson B, Wu D, et al. limma powers differential expression analyses for RNA-sequencing and microarray studies. Nucleic Acids Res. 2015;43:e47. doi: 10.1093/nar/gkv007. [DOI] [PMC free article] [PubMed] [Google Scholar]
- 18.Yu G, Wang LG, Han Y, He QY. clusterProfiler: An R package for comparing biological themes among gene clusters. OMICS. 2012;16:284–87. doi: 10.1089/omi.2011.0118. [DOI] [PMC free article] [PubMed] [Google Scholar]
- 19.Ashburner M, Ball CA, Blake JA, et al. Gene ontology: Tool for the unification of biology. The Gene Ontology Consortium. Nat Genet. 2000;25:25–29. doi: 10.1038/75556. [DOI] [PMC free article] [PubMed] [Google Scholar]
- 20.Kanehisa M, Goto S. KEGG: Kyoto Encyclopedia of Genes and Genomes. Nucleic Acids Res. 2000;28:27–30. doi: 10.1093/nar/28.1.27. [DOI] [PMC free article] [PubMed] [Google Scholar]
- 21.Szklarczyk D, Gable AL, Lyon D, et al. STRING v11: protein–protein association networks with increased coverage, supporting functional discovery in genome-wide experimental datasets. Nucleic Acids Res. 2019;47:D607–13. doi: 10.1093/nar/gky1131. [DOI] [PMC free article] [PubMed] [Google Scholar]
- 22.Shannon P, Markiel A, Ozier O, et al. Cytoscape: A software environment for integrated models of biomolecular interaction networks. Genome Res. 2003;13:2498–504. doi: 10.1101/gr.1239303. [DOI] [PMC free article] [PubMed] [Google Scholar]
- 23.Zhou G, Soufan O, Ewald J, et al. NetworkAnalyst 3.0: a visual analytics platform for comprehensive gene expression profiling and meta-analysis. Nucleic Acids Res. 2019;47:W234–41. doi: 10.1093/nar/gkz240. [DOI] [PMC free article] [PubMed] [Google Scholar]
- 24.Davis CA, Hitz BC, Sloan CA, et al. The Encyclopedia of DNA elements (ENCODE): Data portal update. Nucleic Acids Res. 2018;46:D794–801. doi: 10.1093/nar/gkx1081. [DOI] [PMC free article] [PubMed] [Google Scholar]
- 25.Langfelder P, Horvath S. WGCNA: An R package for weighted correlation network analysis. BMC Bioinformatics. 2008;9:559. doi: 10.1186/1471-2105-9-559. [DOI] [PMC free article] [PubMed] [Google Scholar]
- 26.Shah D, Virtanen L, Prajapati C, et al. Modeling of LMNA-related dilated cardiomyopathy using human induced pluripotent stem cells. Cells. 2019;8(6):594. doi: 10.3390/cells8060594. [DOI] [PMC free article] [PubMed] [Google Scholar]
- 27.Captur G, Arbustini E, Bonne G, et al. Lamin and the heart. Heart. 2018;104:468–79. doi: 10.1136/heartjnl-2017-312338. [DOI] [PubMed] [Google Scholar]
- 28.Lee YK, Lau YM, Cai ZJ, et al. Modeling treatment response for lamin A/C related dilated cardiomyopathy in human induced pluripotent stem cells. J Am Heart Assoc. 2017;6(8):e005677. doi: 10.1161/JAHA.117.005677. [DOI] [PMC free article] [PubMed] [Google Scholar]
- 29.Liu JS, Fan LL, Zhang H, et al. Whole-exome sequencing identifies two novel TTN mutations in Chinese families with dilated cardiomyopathy. Cardiology. 2017;136:10–14. doi: 10.1159/000447422. [DOI] [PubMed] [Google Scholar]
- 30.Fan LL, Chen YQ, Huang H, et al. Whole-exome sequencing reveals doubly novel heterozygous Myosin Binding Protein C and Titin mutations in a Chinese patient with severe dilated cardiomyopathy. Cardiol Young. 2018;28:1410–14. doi: 10.1017/S1047951118001403. [DOI] [PubMed] [Google Scholar]
- 31.Fan LL, Huang H, Jin JY, et al. Whole exome sequencing identifies a novel mutation (c.333 + 2T > C) of TNNI3K in a Chinese family with dilated cardiomyopathy and cardiac conduction disease. Gene. 2018;648:63–67. doi: 10.1016/j.gene.2018.01.055. [DOI] [PubMed] [Google Scholar]
- 32.Mounkes LC, Kozlov SV, Rottman JN, Stewart CL. Expression of an LMNA-N195K variant of A-type lamins results in cardiac conduction defects and death in mice. Hum Mol Genet. 2005;14:2167–80. doi: 10.1093/hmg/ddi221. [DOI] [PubMed] [Google Scholar]
- 33.Beltrami CA, Finato N, Rocco M, et al. The cellular basis of dilated cardiomyopathy in humans. J Mol Cell Cardiol. 1995;27:291–305. doi: 10.1016/s0022-2828(08)80028-4. [DOI] [PubMed] [Google Scholar]
- 34.Wang H, Zheng WY, Wang JZ, et al. [A novel LMNA gene mutation E82K associated with familial dilated cardiomyopathy]. Zhonghua Xin Xue Guan Bing Za Zhi. 2005;33:875–79. [in Chinese] [PubMed] [Google Scholar]
- 35.Giannessi D, Caselli C, Del RS, et al. Adiponectin is associated with abnormal lipid profile and coronary microvascular dysfunction in patients with dilated cardiomyopathy without overt heart failure. Metabolism. 2011;60:227–33. doi: 10.1016/j.metabol.2009.12.030. [DOI] [PMC free article] [PubMed] [Google Scholar]
- 36.Skurk C, Wittchen F, Suckau L, et al. Description of a local cardiac adiponectin system and its deregulation in dilated cardiomyopathy. Eur Heart J. 2008;29:1168–80. doi: 10.1093/eurheartj/ehn136. [DOI] [PubMed] [Google Scholar]
- 37.Thomas CV, Coker ML, Zellner JL, et al. Increased matrix metalloproteinase activity and selective upregulation in LV myocardium from patients with end-stage dilated cardiomyopathy. Circulation. 1998;97:1708–15. doi: 10.1161/01.cir.97.17.1708. [DOI] [PubMed] [Google Scholar]
- 38.Schwartzkopff B, Fassbach M, Pelzer B, et al. Elevated serum markers of collagen degradation in patients with mild to moderate dilated cardiomyopathy. Eur J Heart Fail. 2002;4:434–39. doi: 10.1016/s1388-9842(02)00092-2. [DOI] [PubMed] [Google Scholar]
- 39.Satoh M, Nakamura M, Akatsu T, et al. Myocardial osteopontin expression is associated with collagen fibrillogenesis in human dilated cardiomyopathy. Eur J Heart Fail. 2005;7:755–62. doi: 10.1016/j.ejheart.2004.10.019. [DOI] [PubMed] [Google Scholar]
- 40.Renault MA, Robbesyn F, Reant P, et al. Osteopontin expression in cardiomyocytes induces dilated cardiomyopathy. Circ Heart Fail. 2010;3:431–39. doi: 10.1161/CIRCHEARTFAILURE.109.898114. [DOI] [PubMed] [Google Scholar]
- 41.Hull TD, Boddu R, Guo L, et al. Heme oxygenase-1 regulates mitochondrial quality control in the heart. JCI Insight. 2016;1:e85817. doi: 10.1172/jci.insight.85817. [DOI] [PMC free article] [PubMed] [Google Scholar]
- 42.Grabellus F, Schmid C, Levkau B, et al. Reduction of hypoxia-inducible heme oxygenase-1 in the myocardium after left ventricular mechanical support. J Pathol. 2002;197:230–37. doi: 10.1002/path.1106. [DOI] [PubMed] [Google Scholar]
- 43.Zhou H, Shen DF, Bian ZY, et al. Activating transcription factor 3 deficiency promotes cardiac hypertrophy, dysfunction, and fibrosis induced by pressure overload. PLoS One. 2011;6:e26744. doi: 10.1371/journal.pone.0026744. [DOI] [PMC free article] [PubMed] [Google Scholar]
- 44.Wong SC, Fukuchi M, Melnyk P, et al. Induction of cyclooxygenase-2 and activation of nuclear factor-kappaB in myocardium of patients with congestive heart failure. Circulation. 1998;98:100–3. doi: 10.1161/01.cir.98.2.100. [DOI] [PubMed] [Google Scholar]
- 45.Fan X, Takahashi-Yanaga F, Morimoto S, et al. Celecoxib and 2,5-dimethyl-celecoxib prevent cardiac remodeling inhibiting Akt-mediated signal transduction in an inherited dilated cardiomyopathy mouse model. J Pharmacol Exp Ther. 2011;338:2–11. doi: 10.1124/jpet.111.179325. [DOI] [PubMed] [Google Scholar]
- 46.Drelicharz L, Kozlovski V, Skorka T, et al. NO and PGI(2) in coronary endothelial dysfunction in transgenic mice with dilated cardiomyopathy. Basic Res Cardiol. 2008;103:417–30. doi: 10.1007/s00395-008-0723-2. [DOI] [PubMed] [Google Scholar]
- 47.Randi AM, Sperone A, Dryden NH, Birdsey GM. Regulation of angiogenesis by ETS transcription factors. Biochem Soc Trans. 2009;37:1248–53. doi: 10.1042/BST0371248. [DOI] [PubMed] [Google Scholar]
- 48.Sharrocks AD. The ETS-domain transcription factor family. Nat Rev Mol Cell Biol. 2001;2:827–37. doi: 10.1038/35099076. [DOI] [PubMed] [Google Scholar]
- 49.Wythe JD, Dang LT, Devine WP, et al. ETS factors regulate Vegf-dependent arterial specification. Dev Cell. 2013;26:45–58. doi: 10.1016/j.devcel.2013.06.007. [DOI] [PMC free article] [PubMed] [Google Scholar]
- 50.Bouveret R, Waardenberg AJ, Schonrock N, et al. NKX2-5 mutations causative for congenital heart disease retain functionality and are directed to hundreds of targets. Elife. 2015;4:e06942. doi: 10.7554/eLife.06942. [DOI] [PMC free article] [PubMed] [Google Scholar]
- 51.Pepin ME, Drakos S, Ha CM, et al. DNA methylation reprograms cardiac metabolic gene expression in end-stage human heart failure. Am J Physiol Heart Circ Physiol. 2019;317:H674–84. doi: 10.1152/ajpheart.00016.2019. [DOI] [PMC free article] [PubMed] [Google Scholar]
Associated Data
This section collects any data citations, data availability statements, or supplementary materials included in this article.
Supplementary Materials
Supplementary Table 1.
Primers for RT-PCR.
| Number | Mouse gene name | Primers |
|---|---|---|
| 1 | Ptgs2 | Forward: 5′-ACACACTCTATCACTGGCACC-3′ |
| Reverse: 5′-TTCAGGGAGAAGCGTTTGC-3′ | ||
| 2 | Timp1 | Forward: 5′-GCAACTCGGACCTGGTCATAA-3′ |
| Reverse: 5′-CGGCCCGTGATGAGAAACT-3′ | ||
| 3 | Myc | Forward: 5′-TTTTTGTCTATTTGGGGACAGTG-3′ |
| Reverse: 5′-CATCGTCGTGGCTGTCTG-3′ | ||
| 4 | Fos | Forward: 5′-CGGGTTTCAACGCCGACTA-3′ |
| Reverse: 5′-TTGGCACTAGAGACGGACAGA-3′ | ||
| 5 | Hmox1 | Forward: 5′-CCTCACTGGCAGGAAATCATC-3′ |
| Reverse: 5′-CCTCGTGGAGACGCTTTACATA-3′ | ||
| 6 | Ctgf | Forward: 5′-CCACCCGAGTTACCAATGAC-3′ |
| Reverse: 5′-GTGCAGCCAGAAAGCTCA-3′ | ||
| 7 | Spp1 | Forward: 5′-AGCTCAGAGGAGAAGCTT-3′ |
| Reverse: 5′-CTTCAGAGGACACAGCAT-3′ | ||
| 8 | Atf3 | Forward: 5′-GAGGATTTTGCTAACCTGACACC-3′ |
| Reverse: 5′-TTGACGGTAACTGACTCCAGC-3′ | ||
| 9 | Lox | Forward: 5′-GCACTGCACACACACAGGGA-3′ |
| Reverse: 5′-TTAGTGTAGTCTGATTCAGG-3′ | ||
| 10 | Adipoq | Forward: 5′-TTAATCCTGCCCAGTCATGCC-3′ |
| Reverse: 5′-CCCTTCAGCTCCTGTCATTCC-3′ | ||
| 11 | β-actin | Forward: 5′-GTGCTATGTTGCTCTAGACTTCG-3′ |
| Reverse: 5′-ATGCCACAGGATTCCATACC-3′ |
Supplementary Table 2.
Top 10 up-regulated and top 10 down-regulated differentially expressed genes (DEGs) of GSE36502 and GSE123916.
| GSE36502 | GSE123916 | ||||||
|---|---|---|---|---|---|---|---|
| Gene ID | log2FC | P value | Gene ID | log2FC | P value | ||
| Up DEGs | Dusp4 | 5.972088873 | 0.000000731 | Up DEGs | Spp1 | 7.754333296 | 0.028571429 |
| Serpina3n | 5.902067944 | 0.000007360 | Atp6v0d2 | 7.485271341 | 0.029401048 | ||
| Eif2s3y | 5.798138132 | 0.009234260 | Ereg | 6.147693779 | 0.028571429 | ||
| Ddx3y | 5.754254922 | 0.025707228 | Il6 | 5.746340944 | 0.028571429 | ||
| Cyp2b10 | 5.710190211 | 0.000000004 | Thbs4 | 5.509486792 | 0.028571429 | ||
| Psca | 5.308134293 | 0.000261828 | Crlf1 | 5.509413267 | 0.028571429 | ||
| Tmem87a | 4.802065975 | 0.000000038 | Nppa | 5.094343298 | 0.028571429 | ||
| Saa3 | 4.726369664 | 0.000403197 | Gdf15 | 5.055361703 | 0.028571429 | ||
| Spp1 | 4.319595585 | 0.000105889 | Thbs1 | 4.851951747 | 0.028571429 | ||
| Clec4d | 4.261690165 | 0.000000303 | Tnc | 4.79000984 | 0.028571429 | ||
| Down DEGs | Car3 | −5.146389732 | 0.000003580 | Down DEGs | Olfr1033 | −21.34638774 | 0.028429536 |
| Cfd | −4.232054779 | 0.000003800 | Apoa2 | −7.005968858 | 0.029401048 | ||
| Cenpf | −3.793225406 | 0.000001220 | Adipoq | −5.228469128 | 0.028571429 | ||
| Apln | −3.754582347 | 0.000001940 | Car3 | −5.177858668 | 0.028571429 | ||
| Olfr176 | −3.369978757 | 0.000001280 | Baiap2l1 | −4.721168954 | 0.028571429 | ||
| Itgb6 | −3.269411078 | 0.000008870 | Clcn1 | −4.433413719 | 0.028571429 | ||
| F830016B08Rik | −3.256671481 | 0.002654215 | Pah | −4.019766469 | 0.028571429 | ||
| Hdhd3 | −3.212583121 | 0.000017100 | Lgr6 | −3.963562023 | 0.028571429 | ||
| Cpxm2 | −3.06989206 | 0.000017400 | Tmprss13 | −3.951270715 | 0.028571429 | ||
| Hdgfl1 | −3.067331901 | 0.000001190 | Hsd17b7 | −3.548425654 | 0.028571429 | ||
Background signal correcting and normalization. (A) Series GSE36502 before normalization. (B) Series GSE36502 after normalization. (C) Series GSE123916 before normalization. (D) Series GSE123916 after normalization.
Supplementary Table 3.
Baseline data of mice. (A, B) Body and heart weight of mice. Body weight (WT 29.219±2.387 g vs. LMNA 30.732±1.936 g). Heart weights (WT 0.130±0.014 g vs. LMNA 0.150±0.011 g; p=0.007). n=8 mice per group. Mean±standard deviation. 0.01≤ p<0.05 (*), 0.001≤ p<0.01 (**), and p<0.001 (***). (C) The relative heart weight of mice (WT 0.45±0.04% vs. LMNA 0.49±0.04%; p=0.048). The relative heart weight refers to the proportion of total heart weight compared with the weight of the body. (D) Shape of hearts. LMNA on left, WT on right.
Supplementary Table 4.
Body and heart weight of mice.
| Group | Weight (g) | Group | Weight (g) | ||||
|---|---|---|---|---|---|---|---|
| WT | Body | Heart | Heart/body | LMNA | Body | Heart | Heart/body |
| WT1 | 29.65 | 0.11 | 0.003709949 | A24 | 30.00 | 0.14 | 0.004666667 |
| WT2 | 25.12 | 0.12 | 0.00477707 | A25 | 32.64 | 0.17 | 0.005208333 |
| WT3 | 30.4 | 0.14 | 0.004605263 | A28 | 29.32 | 0.14 | 0.004774898 |
| WT4 | 29.54 | 0.12 | 0.004062288 | A32 | 29.54 | 0.15 | 0.005077861 |
| WT5 | 28.14 | 0.14 | 0.004975124 | A41 | 34.73 | 0.14 | 0.004031097 |
| WT6 | 33.00 | 0.15 | 0.004545455 | A69 | 30.28 | 0.16 | 0.005284016 |
| WT7 | 27.25 | 0.12 | 0.00440367 | A71 | 29.35 | 0.15 | 0.005110733 |
| WT8 | 30.65 | 0.14 | 0.0045677 | A74 | 30.00 | 0.15 | 0.005 |
| Average | 29.21875 | 0.13 | 0.004455815 | Average | 30.7325 | 0.15 | 0.004894201 |
| Std. deviation | 2.38658 | 0.01414 | 0.000401724 | Std. deviation | 1.93557 | 0.01069 | 0.00040592 |