Abstract
Due to the strong infectivity of COVID-19, it spread all over the world in about three months and thus has been studied from different aspects including its source of infection, pathological characteristics, diagnostic technology and treatment. Yet, the influences of control strategies on the transmission dynamics of COVID-19 are far from being well understood. In order to reveal the mechanisms of disease spread, we present dynamical models to show the propagation of COVID-19 in Wuhan. Based on mathematical analysis and data analysis, we systematically explore the effects of lockdown and medical resources on the COVID-19 transmission in Wuhan. It is found that the later lockdown is adopted by Wuhan, the fewer people will be infected in Wuhan, and nevertheless it will have an impact on other cities in China and even the world. Moreover, the richer the medical resources, the higher the peak of new infection, but the smaller the final scale. These findings well indicate that the control measures taken by the Chinese government are correct and timely.
Keywords: COVID-19, Transmission dynamics, Lockdown, Medical resources
Introduction
COVID-19 is pneumonia caused by a novel coronavirus which is an emerging infectious disease and reported early in Wuhan, China [1]. Then, Chinese government promptly informed the World Health Organization (WHO) of the real situation of it. In January 20, 2020, the characteristics of human to human transmission are publicly presented by Nanshan Zhong, who is the member of national high-level expert group. After that, people took some protective measures including restricted travel, isolation and wearing a mask. At the same time, the novel coronavirus was isolated and gene sequence was published [2–4]. In January 31, 2020, WHO announced COVID-19 as a public health emergency of international concern [5]. However, due to the extreme infectivity of COVID-19, it spread all over the world in a short time. And in March 11, 2020, WHO declared that COVID-19 has been characterized as a pandemic [6]. As of April 4, 2020, there have been 1,051,635 confirmed cases of COVID-19 worldwide, with 56,985 deaths reported in 208 countries [7]. Consequently, the study of the spread mechanisms and prevention and control strategies of COVID-19 has become a global problem to be solved.
COVID-19 is caused by a virus, severe acute respiratory syndrome coronavirus 2 (SARS-CoV-2), which is a RNA virus with single strand and has a phylogenetic similarity to SARS-CoV [1, 8]. It can be transmitted by three main routes including direct transmission, contact transmission and aerosol [9]. Direct transmission refers to the close contact with the droplets of patients by sneezing, coughing and talking; contact transmission means that hands to mucous membrane of mouth, nose and eyes after contacting droplets deposited on the surface of the object; transmission by aerosol means that droplets are mixed in the air to form aerosols that can cause infection when inhaled. The main source of infection is the infected population infected by COVID-19 and the main symptoms are fever, fatigue and dry cough [9].
Dynamical modeling is one of the useful methods to reveal the transmission rule of diseases spread as well as COVID-19, which is based on the internal transmission mechanism and can dynamically predict the future trend according to the current information [10–13]. Typically, Lin et al. posed a conceptual model for the transmission dynamics of COVID-19 in Wuhan and explained the course of its outbreak [14]. Tang et al. presented a study on the estimation of the transmission risk of COVID-19 and showed the effectiveness of control strategy by intensive contact tracing followed by quarantine and isolation [15]. Chen et al. constructed a mathematical model for phase-based transmissibility of COVID-19 and calculated the basic reproduction number [16]. We did a transmission analysis of COVID-19 in Shanxi Province with imported cases by using difference equation model and found that if lockdown is adopted with 2 days delay by Shanxi Province, the expected final scale of cases will be three times as the current number of infections [17].
For an emerging diseases, it is important to investigate the early stages for disease transmission which can provide targeted control measures. From the early timetable in Wuhan [1, 18], one can find useful information on COVID-19. A lot of researchers did meaningful work on the origin, epidemiological review, pathological characteristics, diagnostic technology, treatment and so on [4, 18–21]. However, to the best of our knowledge, there is little work focused their attention on the influence of lockdown and medical resources on the spread of COVID-19 in Wuhan based on dynamical modeling and available data.
In order to reveal the transmission dynamics of COVID-19 in Wuhan and evaluate the effects of lockdown and medical resources, we pose the dynamical models based on ordinary differential equations and investigate the corresponding global dynamics. Moreover, we estimate the parameters values using extensive Markov chain Monte Carlo (MCMC) simulations. What is more, we explore the influences of lockdown and medical resources in detail. Finally, some conclusion and discussion are given.
Dynamical modeling of COVID-19 transmission in Wuhan
We divide the total population as five groups: Susceptible (S), Exposed (E), Infected (I), Confirmed (Q) and Removed (R) (Here, removed group includes recovered and death populations). To well present the dynamical model of COVID-19 in Wuhan, we firstly give two main assumptions, which are as below:
(i) Since the time span we considered is small, natural birth and death are not considered in our dynamical model;
(ii) Exposed populations (E) have ability to infect the susceptible populations (S).
Based on the real situation of Wuhan, we will show two dynamical models to describe the transmission processes of the epidemic before and after the lockdown of the city. For the sake of simplicity, emigration and immigration rates are set as constants [22, 23]. Dynamical model before January 23, 2020, has the following form (see Fig. 1):
| 1 |
where and are infection coefficients, b is the emigration rate from Wuhan to other places, a is immigration rate from other places to Wuhan, is transform rate from the exposed population to infected populations, m is the confirmation rate from the infected population to confirmed case, and is transform rate from the confirmed population to removed population.
Fig. 1.

Transmission diagram of COVID-19 in Wuhan before lockdown. S(t), E(t), I(t), Q(t) and R(t) represent the susceptible, exposed, infected, confirmed and removed populations
When Wuhan government adopted the measure of lockdown, the people can hardly leave or return Wuhan. In this case, dynamical model with lockdown after January 23, 2020, is as follows:
| 2 |
where and are infection coefficients under lockdown and is the confirmation rate depends on the richness of medical resources.
For system (1), we have the following equation for total population N:
| 3 |
It can found from (3) that:
-
(i)
When , the total population N tend to 0 and thus system (1) collapses;
-
(ii)
When , there exists line equilibria point , is the arbitrary positive constant;
-
(iii)
When , , then
We notice , that is
If , then and
On the one hand, one has:
which leads to
On the other hand, we obtain:
which results in
Consequently, if , then there may have two cases for system (1):
S(t) tends to , and E(t), I(t), Q(t), R(t) all tends to 0 as ;
S(t), E(t), I(t), Q(t), R(t) all tends to as .
If , we assume that there exists equilibrium of system (1) where
As a result, we obtain
where
with and .
Assume that , which equals to . Then, we have , and thus
If , then . In this case, we have the following conclusions:
- When , for arbitrarily , one can have
where is any positive number. When , , we have , all the variables in the system (1) tend to 0.
We show the stability of equilibria of the system (1) by numerical results in three cases.
Case 1: .
We choose the parameter , , , , , , , with the initial value and the time series of the state variables under the case 1 is as shown in Fig. 2. In this case, all the population will disappear as time is large enough.
Fig. 2.
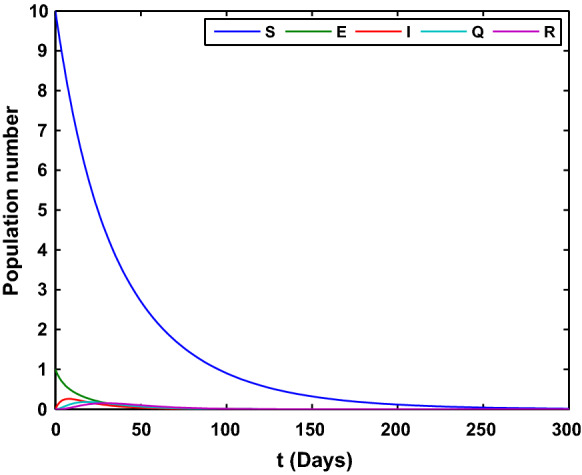
The time series of the state variables in system (1). All the variables in the system (1) tend to 0
Case 2: (1) and ; (2) and .
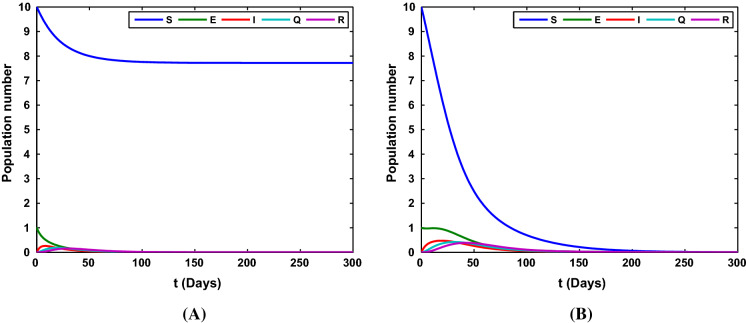
Taking the parameter , , , , , with the initial value , we show the time series of the state variables under the case 2 in Fig. 3. In this case, the susceptible populations tends to or 0 and the other populations converge to 0.
Fig. 3.
The time series of the state variables in system (1). a S(t) tends to and the other state variables tend to 0 with ; b all the variables in the model tend to 0 with
Case 3: (1) and ; (2) , and ; (3) , and ; (4) , and .
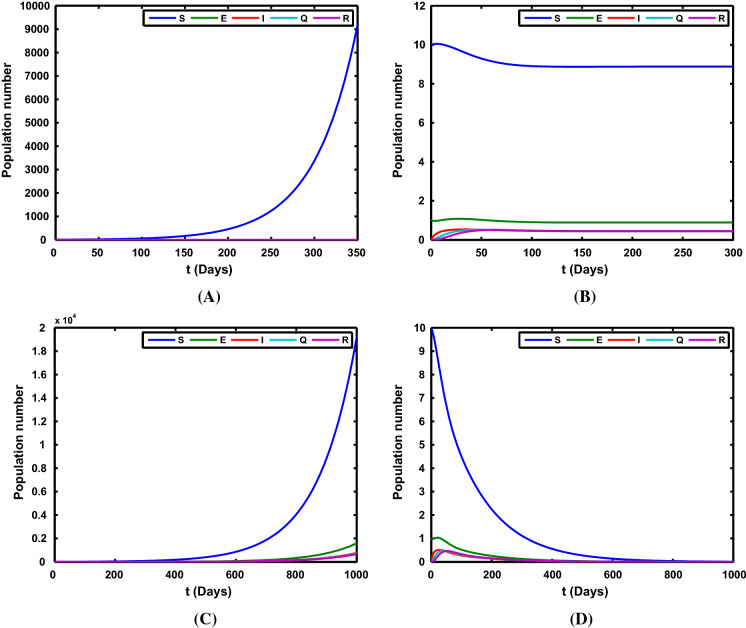
We take the parameter , , , , with the initial value , and the time series of the state variables under the case 3 is shown in Fig. 4. Four different results can be found in this figure.
Fig. 4.
The time series of the state variables of system (1). a S(t) tend to , the other state variables tend to 0 with and ; b the state variables (S(t), E(t), I(t), Q(t), R(t)) tend to with and ; c All the state variables tend to with and ; d All the variables in the model tend to 0 with and
Estimation of epidemiological parameters
Calibration of under-reported infection data
Under-reporting of infections is a common issue in the data collection of infectious disease. Figure 5 shows that on February 12 the cumulative confirmed cases in Wuhan had clear jumps with significantly large sizes. Such sizable jumps cannot happen within one day, rather they represent an accumulation of cases that have not been reported in previous dates prior to February 12. Since February 04, Huoshenshan Hospital, Leishenshan Hospital and many cabin hospitals have been used, and the medical resources become more reliable, so certain adjustments in data typically occur. Using the calibration method of confirmed cases in previous paper [24], we also assume an exponential growth curve for the cumulative number of confirmed cases in Wuhan from February 04 to February 12 with the form , where are to be estimated. Under the boundary conditions , and , one can obtain , respectively. The resulting calibration curve for the cumulative number of confirmed cases from February 04 to February 12 is also shown as the solid red curves in Fig. 5.
Fig. 5.
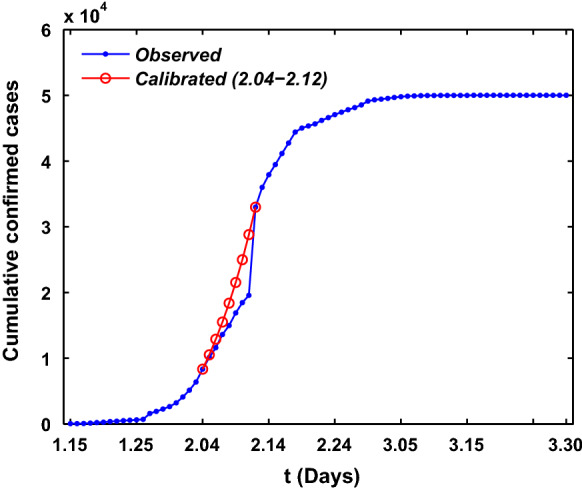
Under-reporting calibration of the infected cases in Wuhan city
Parameter estimation
On January 23, 2020, the Chinese authorities introduced the implementation of the lock-down strategy in Wuhan to shut down the movement and to control the transmission of COVID-19. And since February 04, Huoshenshan Hospital, Leishenshan Hospital and many cabin hospitals have been used, the medical resources become more reliable. Hence, the COVID-19 epidemic in Wuhan can be divided into three stages. The first stage is from 15 January to 23 January, there does not exist the travel restriction and the medical diagnostic tools may be less accurate and reliable. The second stage is from 23 January to 04 February, when the medical resources are not reliable and travel restriction is used. The third stage is from 04 February to 30 March, there exists the strict community control strategy and the medical resources become more reliable. The strict community control strategy means that the community is closed, which is reflected in decreasing of transmission rate. And the reliable medical resources reflect the increasing of laboratory diagnosis rate m and the transform rate .
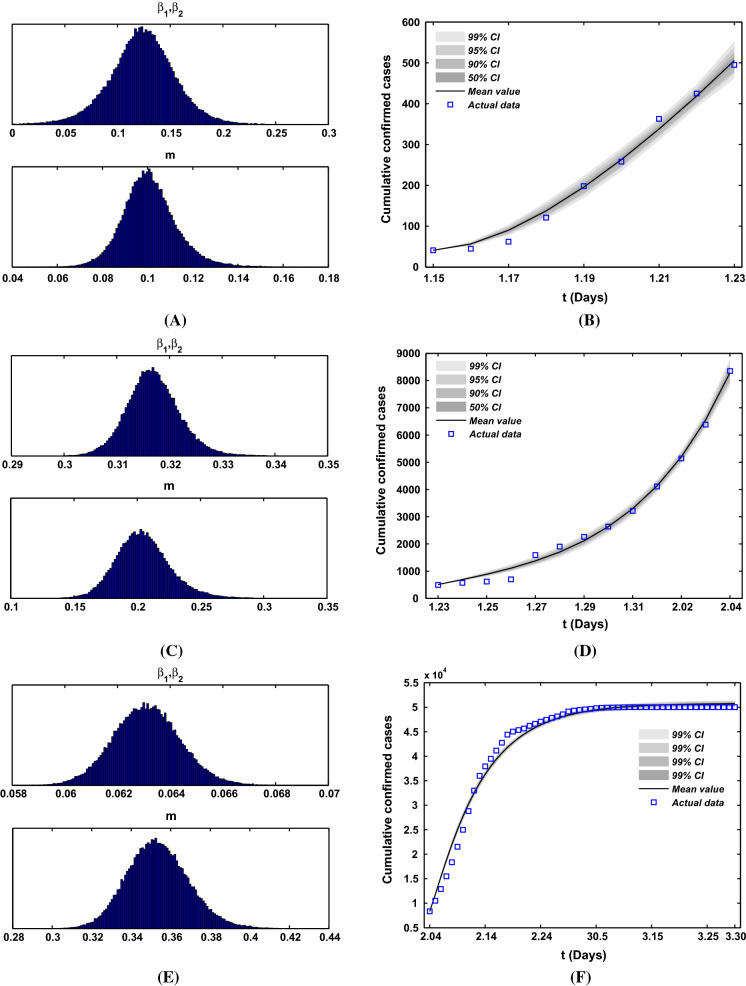
In the previous work [25], we obtained that the mean incubation period was 4 days (95% CI, 2 to 7), so we choose the value of is . For parameter , which depends on the actual situation of infected cases, and it also does not influence the model simulation. By the end of 2019, the total population of Wuhan was 14.1865 million, and the time of Spring Festival travel rush in Wuhan lasted for 13 days starting on January 10 and ending at 10 am on January 23, in the meantime about 5 million people had moved out Wuhan. Thus, we can calculate the migration rate is . For the migration rate a, due to the large population base and the small impact of the incoming population on the epidemic in Wuhan, in order to reflect the proportion of moving in and out of Wuhan, we assume that . Here, we assume that the transmission rate . In order to estimate the values of parameters m, and , we use extensive Markov chain Monte Carlo (MCMC) simulations based on the adaptive combination Delayed rejection and Adaptive Metropolis (DRAM) algorithm [26, 27] for model (1) and (2). Using 100,000 sample realizations, we can acquire the parameter values for m, and with MCMC chain histogram and the time evolution of both infection cases and comparison with the confirmed of COVID-19 cases with three different stages in Fig. 6. Then we further get the mean values, the standard deviation, Geweke values of and the mean value and standard deviation of the reproduction number for these three different stages, which are shown in Table 1. The mean values of reproduction number of these three stages are 1.3469, 2.8349, and 0.4312, respectively. One can obtain that the second stage is the most serious in Wuhan, and most of individuals are infected, although confirmed cases are rare.
Fig. 6.
a, c, e The histogram of MCMC chain for parameters and m with 100,000 sample realizations for the first, second and third stage, respectively. b, d, f Fitting results of theoretical cumulative number of confirmed COVID-19 cases with its actual reported number for the first, second and third stage, respectively
Table 1.
Parameter estimation with the method of MCMC
| Stage | Notation | Mean | Standard | Geweke | Reproduction Number | Mean | Standard |
|---|---|---|---|---|---|---|---|
| First | 0.1238 | 0.0315 | 0.99748 | 1.3469 | 0.4225 | ||
| m | 0.1009 | 0.0121 | 0.99871 | ||||
| Second | 0.3170 | 0.0051 | 0.99998 | 2.8349 | 0.2085 | ||
| m | 0.2049 | 0.0220 | 0.99990 | ||||
| Third | 0.0631 | 0.0013 | 0.99898 | 0.4312 | 0.0038 | ||
| m | 0.3535 | 0.0155 | 0.99664 |
Fitting results with three stages
With the uncertainty for estimated parameters values, Monte Carlo simulation runs and then be conducted to assess the performance of the model by using the available model parameters in Table 1. Figure 7 unveils the time evolution of both infection cases and comparison with empirical record of cumulative and daily number of confirmed COVID-19 cases in Wuhan city with three stages, and which also shows the 95% percent interval for all 10,000 passing simulation trajectories and the median of these 10,000 simulation outputs. It is clear that the theoretical prediction is nearly full agreement with real data, which also well validates the accuracy of proposed model.
Fig. 7.
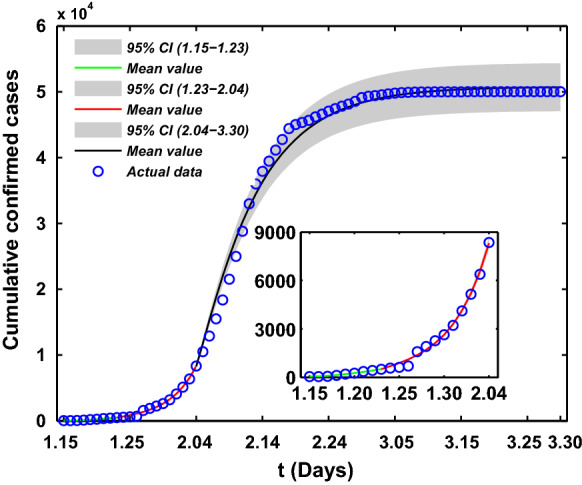
Fitting results of theoretical cumulative number of confirmed COVID-19 cases with its actual reported number
Effects of lockdown and medical resources
The influence of lockdown on the spread of COVID-19 in Wuhan
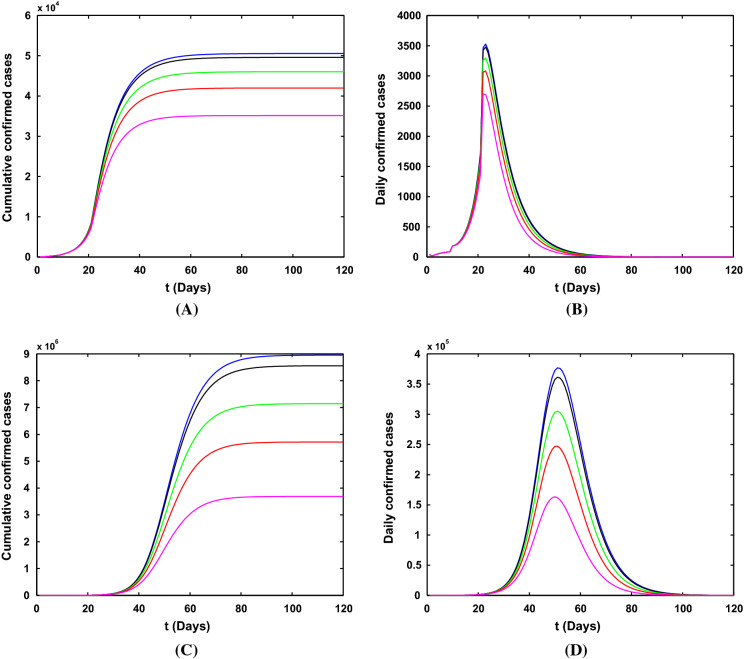
Simulation results for the number of confirmed COVID-19 cases with different lockdown strategy dates (January 19, January 21, January 23, January 25 and January 27) in Wuhan city are shown in Fig. 8. We will only discuss the impact of time on the epidemic trend and the final scale. The later using the lockdown measure in Wuhan, the lower the peak of newly infected people in the city and the smaller the final scale. Although the lockdown measures taken late will reduce the scale of the city’s epidemic, the export cases of Wuhan will increase with the delay of time, which will cause uncontrollable impact on other provinces and even the world.
Fig. 8.
Simulation results for the number of confirmed COVID-19 cases with different lockdown dates in Wuhan city. a, b The cumulative and newly cases with reliable medical resources and the strict community control strategy. c, d The cumulative and newly cases without reliable medical resources and the strict community control strategy. The orange, red, green, black, blue lines indicate that the Wuhan lockdown dates are January 19, January 21, January 23, January 25, January 27, respectively
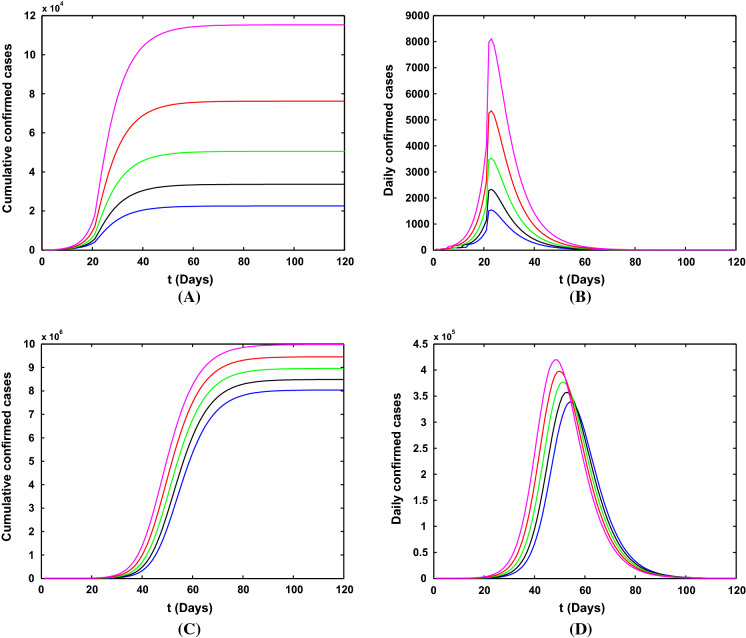
Figure 9 shows the influence of different strengths of lockdown after January 23, 2020. The smaller the lockdown strategy strength of the city, the lower the peak of the epidemic (see Fig. 9b, d), and the smaller the final scale (see Fig. 9a, c). The conclusion is consistent with the impact of the lockdown strategy time. The smaller the lockdown strategy strength, the smaller the impact on the epidemic in Wuhan.
Fig. 9.
Simulation results for the number of confirmed COVID-19 cases with different lockdown strengths in Wuhan city. a, b The cumulative and newly cases with reliable medical resources and the strict community control strategy. c, d The cumulative and newly cases without reliable medical resources and the strict community control strategy. The orange, red, green, black and blue lines mean that the values of b (Wuhan lockdown strength) after January 23 are 0.02, 0.01, 0.005, 0.001 and 0, respectively
The influence of medical resources on the dynamics of COVID-19 in Wuhan
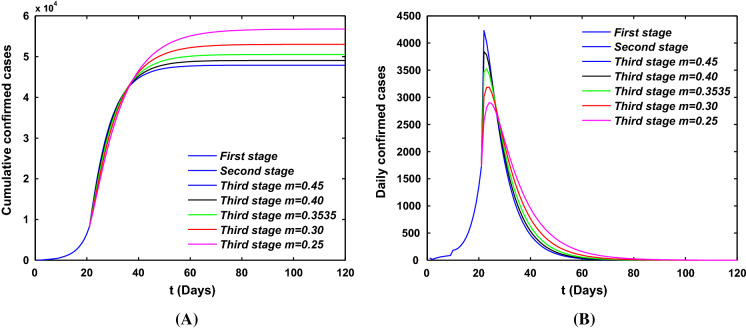
Since February 04, 2020, simulation results for the number of confirmed COVID-19 cases with different medical resources in Wuhan city are shown in Fig. 10. It can be seen that the more medical resources used in Wuhan, the smaller epidemic time (see Fig. 10b) and the final scale (see Fig. 10a), and the higher the peak of newly infected people (see Fig. 10b). Reason for the more medical resources used the higher peak of newly infected cases is the more initial value of exposed and infected individuals on February 04, 2020. This phenomena can also explain that most of individuals are infected in the second stage, although confirmed cases are rare.
Fig. 10.
Simulation results for the number of confirmed COVID-19 cases with different medical resources in Wuhan city. a The cumulative cases. b The newly cases
Conclusion and discussion
In this work, we constructed a mathematical model for COVID-19 transmission in Wuhan. Based on mathematical analysis and data fitting, we revealed the effects of lockdown and medical resources. It was found that the later Wuhan takes the lockdown measures, the lower the peak value of new infections and the smaller the final scale. Moreover, although the late implementation of lockdown measures will reduce the scale of the epidemic in this city, due to the fact that Wuhan’s export disease will increase with the delay of time, it will have an uncontrollable impact on other provinces in China and even the world. Our results suggest that the lockdown strategy adopted by Chinese government is right and timely which shows the responsibility of great power of China.
Tian et al. presented a study on the effects of control strategies on COVID-19 transmission in Wuhan during the first 50 days from December 31, 2019, to February 19, 2020 [28]. They claimed that lockdown measure makes the people outside Wuhan to cope with the COVID-19 ahead of time. It is also announced that more than 700,000 people outside Wuhan may be protected from the COVID-19 which demonstrated the effectiveness of control measures and thus are consistent with our findings in this work.
It should be noted that the situations in the worldwide is becoming worse and worse. Here, we want to provide some suggesting for the control of COVID-19 spread. Firstly, from the individual level, we need to reconstruct the transmission path, trace back the transmission path of confirmed cases which are infected by COVID-19, find out the key nodes of transmission, and reveal the communication relationship between different individuals. Secondly, from the methodological aspect, it requires to integrate methods and theories from big data, networks science, epidemiology, mathematical model to predict the peak time, final size and so on. Lastly, from the control point of view, it needs to characterize the transmission probability between regions and the spatial-temporal aggregation within regions, show the spatial-temporal evolution process of COVID-19 in a visual form, and give quantitative indicators of high-risk and potential high-risk areas.
Acknowledgements
This work is supported by the National Key Research and Development Program of China (Grant No. 2018YFE0109600), National Natural Science Foundation of China under Grant No. (11671241, 11801398), Program for the Outstanding Innovative Teams (OIT) of Higher Learning Institutions of Shanxi, Natural Science Foundation of Shanxi Province Grant No. (201801D221024, 201801D221003), Outstanding Young Talents Support Plan of Shanxi province, and Selective Support for Scientific and Technological Activities of Overseas Scholars of Shanxi province.
Compliance with ethical standards
Conflict of interest
The authors declare that they have no conflict of interest.
Footnotes
Publisher's Note
Springer Nature remains neutral with regard to jurisdictional claims in published maps and institutional affiliations.
References
- 1.Zhu N, Zhang D, Wang W, et al. A novel coronavirus from patients with pneumonia in China, 2019. N. Engl. J. Med. 2020;382:727–733. doi: 10.1056/NEJMoa2001017. [DOI] [PMC free article] [PubMed] [Google Scholar]
- 2.Chan JF, Yuan S, Kok KH, et al. A familial cluster of pneumonia associated with the 2019 novel coronavirus indicating person-to-person transmission: a study of a family cluster. Lancet. 2020;395:514–523. doi: 10.1016/S0140-6736(20)30154-9. [DOI] [PMC free article] [PubMed] [Google Scholar]
- 3.Zhou P, Yang X-L, Wang X-G, et al. A pneumonia outbreak associated with a new coronavirus of probable bat origin. Nature. 2020;579:270–273. doi: 10.1038/s41586-020-2012-7. [DOI] [PMC free article] [PubMed] [Google Scholar]
- 4.Wu F, Zhao S, Yu B, et al. A new coronavirus associated with human respiratory disease in China. Nature. 2020;579:265–269. doi: 10.1038/s41586-020-2008-3. [DOI] [PMC free article] [PubMed] [Google Scholar]
- 5.https://www.who.int/dg/speeches/detail/who-director-general-s-statement-on-ihr-emergency-committee-on-novel-coronavirus-(2019-ncov). Accessed 30 Jan 2020
- 6.https://www.who.int/dg/speeches/detail/who-director-general-s-opening-remarks-at-the-media-briefing-on-covid-19---11-march-2020. Accessed 11 Mar 2020
- 7.https://www.who.int/emergencies/diseases/novel-coronavirus-2019. Accessed 4 Apr 2020
- 8.Ruan S. Likelihood of survival of coronavirus disease 2019. Lancet Infect. Dis. 2020;20:630–631. doi: 10.1016/S1473-3099(20)30257-7. [DOI] [PMC free article] [PubMed] [Google Scholar]
- 9.http://www.nhc.gov.cn/jkj/s3577/202003/4856d5b0458141fa9f376853224d41d7.shtml. Accessed 7 Mar 2020
- 10.Kang D, Choi H, Kim J-H, et al. Spatial epidemic dynamics of the COVID-19 outbreak in China. Int. J. Infect. Dis. 2020;94:96–102. doi: 10.1016/j.ijid.2020.03.076. [DOI] [PMC free article] [PubMed] [Google Scholar]
- 11.Xing Y, Song L, Sun G-Q, et al. Assessing reappearance factors of H7N9 avian influenza in China. Appl. Math. Comput. 2017;309:192–204. [Google Scholar]
- 12.Sun G-Q, Xie J-H, Huang S-H, et al. Transmission dynamics of cholera: mathematical modeling and control strategies. Commun. Nonlinear Sci. Numer. Simul. 2017;45:235–244. doi: 10.1016/j.cnsns.2016.10.007. [DOI] [Google Scholar]
- 13.Li M-T, Jin Z, Sun G-Q, et al. Modeling direct and indirect disease transmission using multi-group model. J. Math. Anal. Appl. 2017;446:1292–1309. doi: 10.1016/j.jmaa.2016.09.043. [DOI] [Google Scholar]
- 14.Lin Q, Zhao S, Gao D, et al. A conceptual model for the coronavirus disease 2019 (COVID-19) outbreak in Wuhan, China with individual reaction and governmental action. Int. J. Infect. Dis. 2020;93:211–216. doi: 10.1016/j.ijid.2020.02.058. [DOI] [PMC free article] [PubMed] [Google Scholar]
- 15.Tang B, Wang X, Li Q, et al. Estimation of the transmission risk of the 2019-nCoV and its implication for public health interventions. J. Clin. Med. 2020;9:462. doi: 10.3390/jcm9020462. [DOI] [PMC free article] [PubMed] [Google Scholar]
- 16.Chen TM, Rui J, Wang QP, et al. A mathematical model for simulating the phase-based transmissibility of a novel coronavirus. Infect. Dis. Poverty. 2020;9:1–8. doi: 10.1186/s40249-019-0617-6. [DOI] [PMC free article] [PubMed] [Google Scholar]
- 17.Li M, Sun G-Q, Zhang J, et al. Transmission analysis of COVID-19 in Shanxi Province for discrete time imported cases with difference equation model. Math. Biosci. Eng. 2020;17:3710–3720. doi: 10.3934/mbe.2020208. [DOI] [PubMed] [Google Scholar]
- 18.Li Q, Guan X, Wu P, et al. Early transmission dynamics in Wuhan, China, of novel coronavirus-infected pneumonia. N. Engl. J. Med. 2020;382:1199–1207. doi: 10.1056/NEJMoa2001316. [DOI] [PMC free article] [PubMed] [Google Scholar]
- 19.Xu X, Chen P, Wang J, et al. Evolution of the novel coronavirus from the ongoing Wuhan outbreak and modeling of its spike protein for risk of human transmission. Sci. China Life Sci. 2020;63:457–460. doi: 10.1007/s11427-020-1637-5. [DOI] [PMC free article] [PubMed] [Google Scholar]
- 20.Lu R, Zhao X, Li J, et al. Genomic characterisation and epidemiology of 2019 novel coronavirus: implications for virus origins and receptor binding. Lancet. 2020;395:565–574. doi: 10.1016/S0140-6736(20)30251-8. [DOI] [PMC free article] [PubMed] [Google Scholar]
- 21.Du Z, Wang L, Cauchemez S, et al. Risk for transportation of 2019 novel coronavirus disease from Wuhan to other cities in China. Emerg. Infect. Dis. 2020;26:1049–1052. doi: 10.3201/eid2605.200146. [DOI] [PMC free article] [PubMed] [Google Scholar]
- 22.Long Y, Wang L. Global dynamics of a delayed two-patch discrete SIR disease model. Commun. Nonlinear Sci. Numer. Simul. 2020;83:105117. doi: 10.1016/j.cnsns.2019.105117. [DOI] [Google Scholar]
- 23.Lee S, Castillo-Chavez C. The role of residence times in two-patch dengue transmission dynamics and optimal strategies. J. Theor. Biol. 2015;3747:152–164. doi: 10.1016/j.jtbi.2015.03.005. [DOI] [PubMed] [Google Scholar]
- 24.Song, P.X., Wang, L., Zhou, Y.: An epidemiological forecast model and software assessing interventions on COVID-19 epidemic in China. 10.1101/2020.02.29.20029421
- 25.Guan W-J, Ni Z-Y, Hu Y, et al. Clinical characteristics of coronavirus disease 2019 in China. N. Engl. J. Med. 2020;382:1708–1720. doi: 10.1056/NEJMoa2002032. [DOI] [PMC free article] [PubMed] [Google Scholar]
- 26.Haario H, Laine M, Mira A. Efficient adaptive MCMC. Stat. Comput. 2006;16:339–354. doi: 10.1007/s11222-006-9438-0. [DOI] [Google Scholar]
- 27.Gamerman D, Lopes HF. Markov Chain Monto Carlo: Stochastic Simulation for Bayesian Inference. 2. London, New York: Taylor and Francis Group; 2006. [Google Scholar]
- 28.Tian H, Liu Y, Li Y, et al. An investigation of transmission control measures during the first 50 days of the COVID-19 epidemic in China. Science. 2020;368:638–642. doi: 10.1126/science.abb6105. [DOI] [PMC free article] [PubMed] [Google Scholar]


