

Abstract
Objective
In an effort to improve the efficiency of computer algorithms applied to screening for coronavirus disease 2019 (COVID-19) testing, we used natural language processing and artificial intelligence–based methods with unstructured patient data collected through telehealth visits.
Materials and Methods
After segmenting and parsing documents, we conducted analysis of overrepresented words in patient symptoms. We then developed a word embedding–based convolutional neural network for predicting COVID-19 test results based on patients’ self-reported symptoms.
Results
Text analytics revealed that concepts such as smell and taste were more prevalent than expected in patients testing positive. As a result, screening algorithms were adapted to include these symptoms. The deep learning model yielded an area under the receiver-operating characteristic curve of 0.729 for predicting positive results and was subsequently applied to prioritize testing appointment scheduling.
Conclusions
Informatics tools such as natural language processing and artificial intelligence methods can have significant clinical impacts when applied to data streams early in the development of clinical systems for outbreak response.
Keywords: COVID-19, artificial intelligence, AI, risk assessment, text analytics
INTRODUCTION
Coronavirus disease 2019 (COVID-19) is caused by severe acute respiratory syndrome coronavirus 2 (SARS-CoV-2), a virus in a family of highly pathogenic human coronaviruses.1
This novel coronavirus is a particularly infectious strain resulting in a global pandemic that reached the United States early in the course of the outbreak.2 One of the lynchpins of controlling the spread of COVID-19 is aggressive testing.3 Testing for SARS-CoV-2 is resource-intensive, as it involves the collection of a nasopharyngeal swab specimen under biosafety level 2 conditions and laboratory capacity for reverse-transcription polymerase chain reaction (RT-PCR) assay of SARS-CoV-2 RNA.4 As individual states in the United States ramp up testing facilities, prioritizing testing based on risk of exposure, clinical symptoms, and preexisting risk factors5 has become an imperative.
The Medical University of South Carolina (MUSC) Health system established a free virtual care consultation and screening service for symptomatic individuals in the state of South Carolina. Telehealth providers then screen and prioritize patients for testing. The virtual care visits are captured through a telehealth system, which allows providers to screen patients and prioritize testing via a drive-through testing facility. The data are captured in the telehealth system (Zipnosis, Minneapolis, MN), which includes patient-entered text information. As testing was a limited resource, even with computer screening, there were significant delays for patients in scheduling tests. The informatics research team at MUSC, as part of its outbreak response strategy, undertook the task of enhancing access to and use of the data in Zipnosis notes to prioritize and inform testing.
One of the main challenges of this task was that the information piped into the electronic health record (EHR) is not in a structured format, but rather in a text “blob” that contained information both from a template-based patient-facing form and free-text data entered by the patient. The use of EHR to identify specific clinical phenotypes has gained significant momentum over recent years.6–8 Characterizing patients based on EHR has several useful purposes, including, but not limited to, clinical decision support,9–12 population health studies,13–15 and identification of participants for research recruitment.16,17 As exemplified by the virtual care data feed at MUSC, a good portion of the information within the EHR resides in free-text format contained inside numerous types of clinical notes.7,9 In addition to well-established natural language processing (NLP) pipelines that have been developed for extracting information from unstructured data,18–20 machine learning–based clinical text classification approaches have also been used to characterize patients using EHR data.21–23 More recently, deep learning approaches such as convolutional neural networks (CNNs) have been used both in predictive modeling in the clinical domain24 and for phenotyping efforts through clinical text classification.25 In this case report, we describe the application of text analysis and deep learning methods to improve our testing algorithms.
MATERIALS AND METHODS
Context
The virtual urgent care program for COVID-19 was established by MUSC Health based on the Centers for Disease Control and Prevention guidelines26 to screen and evaluate presumptive cases in our region. To minimize exposure and lessen the risk of nosocomial infections, patients are advised to visit MUSC Health virtual urgent care for screening and medical advice from trained MUSC Health care providers via a secure online telehealth virtual care system by Zipnosis. Referral for testing for patients at high risk or those who need inpatient care is determined based on the consultation with the providers. The data from the virtual care system are fed into our EHR system (Epic Systems Corporation, Verona, WI) via a proprietary application programming interface (HL7 V2.x.). Data were subsequently extracted from Epic Clarity and moved to a cloud-based “data lake” analytics infrastructure in Azure (Microsoft, Redmond, WA).
Patient population
We included patients with virtual care visits with COVID-19 listed as the reason for the visit. Patients without test results 14 days following the visit were excluded. For patients with multiple test results, only the final result was considered. The total number of patients included in our analysis was 6813, 498 of whom tested positive and 6315 of whom tested negative.
Text processing
The telehealth system notes were preprocessed using a simple Apache UIMA–based NLP application.27 A pattern matching–based algorithm split the notes into sections and labeled these sections to enable filtering out boilerplate information and instructions from the Zipnosis template while focusing on relevant sections. Examples of such header-demarcated sections included a “Patient Summary:” section in which symptoms were reported by the patient and a section labeled “Pertinent COVID-19 information” in which travel information was reported. Simple pattern matching was also used for limited dataset de-identification, replacing patient names, phone numbers, and addresses with generic tokens in order to protect patient privacy. Diagnosis codes that were demarcated by the template were extracted and appended to the end of the clinical note. Stop words were removed prior to tokenization.
Text analytics
As part of the analysis prior to machine learning, we examined differences in word frequencies across clinical notes with positive test results as compared with notes from those with known negative results. We performed a chi-square analysis to assess words that are overrepresented across these corpora of text.28 This analysis provided insight into key words associated with positive COVID-19 tests results.
Model architecture
We used Keras29 and TensorFlow version 2.030 for constructing and training the CNN model. To construct the features for the deep learning models, the text sequences were tokenized and padded with zeros at the end of sequences to match the length of the longest string in the training set. The input layer had a dimension size of 628, slightly exceeding the maximum length of the input sequences of tokens. We used word2vec31 for the word-embedding layer. The embedding weights were initialized with 200-dimension word vectors from a word2vec model pretrained on a PubMed corpus.32 The embedding layer had a drop rate of 0.3. This was followed by a convolutional layer with multiple filter sizes (3, 4, and 5) in parallel, with 100 filters in each, ReLU (Rectified Linear Unit) activation, a stride of 1, and global max-pooling, which was followed by a merge tensor then a fully connected 512-node hidden layer with ReLU activation and a drop rate of 0.3. Finally, the output layer had a single binary node with a sigmoid activation function. Several hyperparameter configurations were tried, for example, randomly initialized with uniform distributions with dimension 50, 100, or 200 dimensions in the embedding layer; 50, 80, 100, or 200 filters in the convolutional layer; kernel sizes (2,3,4), (3,4,5), or (4, 5,6); and a variety of learning rates and learning rate reduction factors. These were all tracked with MLflow33 and the model with best performance on the hold-out set was selected. The final learning rate used was 4 × 10⁻⁴, with a reduction factor of 0.5 on performance plateau.
Training and evaluation
The data were partitioned into 3 sets based on random sampling of patients into a training set (60%), cross-validation set (16%), and hold-out test set (24%). There was no overlap of patients across the 3 partitions. The cross-validation set was used for the validation during training epochs. The test set was only used after model fitting to assess performance. A logistic regression model using a bag-of-words count-based vectors as features was used as a comparator. The performance was evaluated using the area under the receiver-operating characteristic curve (AUC). To assess the precision, recall, and F1 score, we downsampled the test set to balance the notes to an equal number of positives and negatives. We did a 100 different cycles of random selections of 120 cases in each class to calculate the mean AUC, precision, recall, and F1-score. We used a probability threshold of 0.2 to optimize for the F1 score. We later examined the output of the model on all patients with virtual care visits with COVID-19 listed as the reason for the visit to assess the discriminant power of the model across three risk categories based on the predicted probability (low if P ≤ .2, medium if P is between .2 and .9, high if P ≥ .9).
Ethical considerations
The purpose of this project was intended to improve the screening process of our virtual care visit program at MUSC for COVID-19 testing and did not involve a systematic investigation or experimental procedure. Therefore, the project was determined to be quality improvement and was not subject to Institutional Review Board for Human Research approval based on the definition of research pursuant to the Common Rule [45 CFR 46.102(d)].34,35
RESULTS
Word frequencies
The results from the analysis of overrepresented keywords in clinical notes with positive test results as compared with notes from those with negative test results are shown in Figure 1. All results are highly statistically significant. For example, the words smell, taste, sense, and lost are mentioned at a much higher frequency (P < .0001) by patients who tested positive for SARS-CoV-2 vs those who did not.
Figure 1.
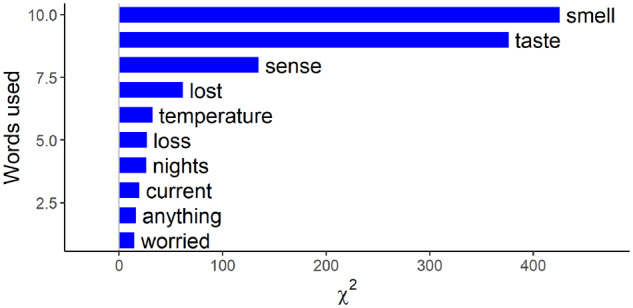
Top 10 words that are overrepresented in patients who tested positive for COVID-19 (coronavirus disease 2019), showing relevant words expressed by patients during the virtual care visit intake process.
Deep learning performance
The deep learning model was extremely accurate in classification of training sets (AUC = 0.962) but because of the small size of the training sample yielded only moderate performance, with an AUC of 0.729 (Figure 2) in the hold-out test set; this compared with an AUC of 0.704 for the logistic model regression in the same dataset—a modest but important improvement.
Figure 2.
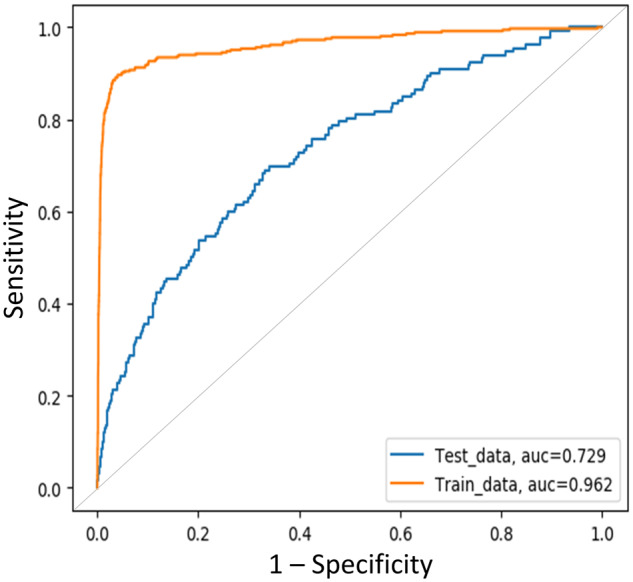
The area under the receiver-operating characteristic curve (AUC) of the convolutional neural network for predicting SARS-CoV-2 (severe acute respiratory syndrome coronavirus 2)–positive results based on the text content of the virtual care visit notes.
The evaluation metrics base on the repeated cycles of randomly selected balanced test sets are shown in Table 1. The CNN outperformed the logistic regression model on all the metrics except for precision.
Table 1.
Mean values for AUC, precision, recall, and F1 score based on repeated balanced test sets
| Model | AUC (95% CI) | Precision | Recall | F1 score |
|---|---|---|---|---|
| CNN | 0.732 (0.697-0.767) | 0.754 | 0.453 | 0.566 (0.541-0.586) |
| LR | 0.707 (0.665-0.739) | 0.800 | 0.227 | 0.354 (0.329-0.377) |
AUC: area under the receiver-operating characteristic curve; CI: confidence interval; CNN: convolutional neural network; LR: logistic regression.
The overall rate of positive tests of patients seen via virtual care was 5.6%. In discussions with the telehealth providers, we decided to optimize risk groups into 3 categories with the selected cutoffs at 0.2 and 0.9, respectively, which puts a low-risk group at <3% positive test rates and a high-risk group at around 60% positive test rate, resulting in a reasonable follow-up rate of around a few dozen calls per day. Even though the accuracy of the model was only acceptable, it was still useful in discriminating patients into these risk categories (Table 2). Looking across all patients with virtual care visits who were tested, we were able to identify a high-risk group that was potentially useful in prioritizing tests.
Table 2.
Analysis of discriminant power of the model
| Category | Tested | Positive | % Positive |
|---|---|---|---|
| High | 475 | 289 | 60.84 |
| Medium | 1,915 | 127 | 6.63 |
| Low | 9,401 | 244 | 2.60 |
| Total | 11,791 | 660 | 5.60 |
DISCUSSION
COVID-19 has brought new scenarios to medicine in which patients are systematically screened using computer algorithms for eligibility for viral testing and subsequent care.36–39 This case report demonstrates the rapid application of what previously have been “research” methods to rapidly improve an institution’s computer screening algorithms for COVID-19.
Predicting positive results based on clinical text is challenging. The clinical notes can contain a significant amount of noise, both as a result of the templated text, as well as patient-entered information that is often irrelevant with respect to the result of SARS-CoV-2 PCR testing. This may explain the modest performance of the model (AUC = 0.729). However, risk stratification of potentially positive individuals may have significant value. At MUSC, during the period of this study, despite application of a computer algorithm, only 5.6% of tested individuals tested positive, which was not a very efficient use of limited testing resources. Even with an imperfect model, it was possible to risk-stratify the population, helping direct resources to patients in most need. Daily predictions from the model were applied to prioritize appointments for drive-through testing procedures (i.e., high-risk patients were called first).
The text analytics highlighted important symptoms that had not been captured by the screening form—namely, lack of smell and taste in affected patients. Anosmia and the alteration of the sense of taste have been reported by mildly symptomatic patients with SARS-CoV-2 infection and are often the first noted symptoms.40 In our hands, the presence of these symptoms as reported by the patients themselves turned out to be the most sensitive predictor of positive testing results. Other words relevant to COVID-19 signs and symptoms (eg, temperature, fever, cough, and words related to dyspnea) were not as prominent as we expected, likely owing to the fact that such symptoms were captured through the semistructured template, which could have masked overrepresentation. This finding, along with other published literature, resulted in the alteration of the online screening form to specifically include questions about smell and taste just ahead to the updated Centers for Disease Control and Prevention guidelines on the “symptoms of coronavirus,” which includes these specific symptoms.41 This finding demonstrates the value of a data-driven approach for the identification of relevant symptoms in novel infections such as the one at the root of this rapidly evolving pandemic.
Limitations
Fortunately, the number of positive SARS-CoV-2 test results was low at our institution. As a result, the sample size for training a deep learning model such as the CNN described herein is suboptimal. More data are needed to refine the model and provide better risk stratification. The complete clinical picture should be considered in testing decisions, including the severity of symptoms and history of underlying chronic diseases.5,42 Patients with preexisting or comorbid conditions are at higher risk of mortality42 and may need to be prioritized for clinical reasons, even if the risk of a positive test is low.
Future work
Future work will include more advanced NLP extraction including local context analysis to identify negated terms (e.g., “denies fever”) and terms referring to individuals other than the patient (e.g., “spouse has a fever”), term normalization to standard terminologies, and algorithms that generalize to a variety of clinical text notes. Moreover, expanding training sets and developing predictive models that include preexisting risk factors will provide a more comprehensive tool that informs the decisions of our telehealth providers.
CONCLUSION
This case report describes our rapid use of artificial intelligence methods to improve the efficiency of COVID-19 testing. The results from our text analysis identified symptoms that informed the electronic triage process prior to wide publication of these associations and also revealed how artificial intelligence methods could be used prioritize patients screening positive for testing.
AUTHOR CONTRIBUTIONS
All authors provided substantial input into the conception and design of this work, participated in drafting and revising it critically, and provided final approval of the version to be published.
ACKNOWLEDGMENTS
We thank Rachel McNeely and Grace Neil for their help with programming and data cleaning and Jean Craig, Katie Kirchoff, and Ekaterina Pekar for their help with data extraction.
CONFLICT OF INTEREST STATEMENT
None declared.
REFERENCES
- 1. Paules CI, Marston HD, Fauci AS.. Coronavirus infections-more than just the common cold. JAMA 2020; 323 (8): 707–8. [DOI] [PubMed] [Google Scholar]
- 2. Omer SB, Malani P, Del Rio C.. The COVID-19 pandemic in the US: a clinical update. JAMA 2020; 323 (18): 1767–8. doi: 10.1001/jama.2020.5788. [DOI] [PubMed] [Google Scholar]
- 3. Parodi SM, Liu VX.. From containment to mitigation of COVID-19 in the US. JAMA 2020; 323 (15): 1441–2. [DOI] [PubMed] [Google Scholar]
- 4. Wang D, Hu B, Hu C, et al. Clinical characteristics of 138 hospitalized patients with 2019 novel coronavirus-infected pneumonia in Wuhan, China. JAMA 2020; 323 (11): 1061–9. [DOI] [PMC free article] [PubMed] [Google Scholar]
- 5. Wu C, Chen X, Cai Y, et al. Risk factors associated with acute respiratory distress syndrome and death in patients with coronavirus disease 2019 pneumonia in Wuhan, China. JAMA Intern Med 2020. Mar 13 [E-pub ahead of print]; doi:10.1001/jamainternmed.2020.0994. [DOI] [PMC free article] [PubMed] [Google Scholar]
- 6. Frey LJ, Lenert L, Lopez-Campos G.. EHR Big Data Deep Phenotyping. Contribution of the IMIA Genomic Medicine Working Group. Yearb Med Inform 2014; 23 (1): 206–11. [DOI] [PMC free article] [PubMed] [Google Scholar]
- 7. Shivade C, Raghavan P, Fosler-Lussier E, et al. A review of approaches to identifying patient phenotype cohorts using electronic health records. J Am Med Inform Assoc 2014; 21 (2): 221–30. [DOI] [PMC free article] [PubMed] [Google Scholar]
- 8. Richesson RL, Sun J, Pathak J, Kho AN, Denny JC.. Clinical phenotyping in selected national networks: demonstrating the need for high-throughput, portable, and computational methods. Artif Intell Med 2016; 71: 57–61. [DOI] [PMC free article] [PubMed] [Google Scholar]
- 9. Meystre SM, Savova GK, Kipper-Schuler KC, Hurdle JF.. Extracting information from textual documents in the electronic health record: a review of recent research. Yearb Med Inform 2008; 17 (1): 128–44. [PubMed] [Google Scholar]
- 10. Wilke RA, Xu H, Denny JC, et al. The emerging role of electronic medical records in pharmacogenomics. Clin Pharmacol Ther 2011; 89 (3): 379–86. [DOI] [PMC free article] [PubMed] [Google Scholar]
- 11. Jensen PB, Jensen LJ, Brunak S.. Mining electronic health records: towards better research applications and clinical care. Nat Rev Genet 2012; 13 (6): 395–405. [DOI] [PubMed] [Google Scholar]
- 12. Miotto R, Li L, Kidd BA, Dudley JT.. Deep patient: an unsupervised representation to predict the future of patients from the electronic health records. Sci Rep 2016; 6 (1): 26094. [DOI] [PMC free article] [PubMed] [Google Scholar]
- 13. Kim DJ, Rockhill B, Colditz GA.. Validation of the Harvard Cancer Risk Index: a prediction tool for individual cancer risk. J Clin Epidemiol 2004; 57 (4): 332–40. [DOI] [PubMed] [Google Scholar]
- 14. Schmiedeskamp M, Harpe S, Polk R, Oinonen M, Pakyz A.. Use of International Classification of Diseases, Ninth Revision, Clinical Modification codes and medication use data to identify nosocomial Clostridium difficile infection. Infect Control Hosp Epidemiol 2009; 30 (11): 1070–6. [DOI] [PubMed] [Google Scholar]
- 15. Zhong VW, Obeid JS, Craig JB, et al. An efficient approach for surveillance of childhood diabetes by type derived from electronic health record data: the SEARCH for Diabetes in Youth Study. J Am Med Inform Assoc 2016; 23 (6): 1060–7. [DOI] [PMC free article] [PubMed] [Google Scholar]
- 16. Obeid JS, Beskow LM, Rape M, et al. A survey of practices for the use of electronic health records to support research recruitment. J Clin Transl Sci 2017; 1 (4): 246–52. [DOI] [PMC free article] [PubMed] [Google Scholar]
- 17. Cowie MR, Blomster JI, Curtis LH, et al. Electronic health records to facilitate clinical research. Clin Res Cardiol 2017; 106 (1): 1–9. [DOI] [PMC free article] [PubMed] [Google Scholar]
- 18. Aronson AR, Lang F-M.. An overview of MetaMap: historical perspective and recent advances. J Am Med Inform Assoc 2010; 17 (3): 229–36. [DOI] [PMC free article] [PubMed] [Google Scholar]
- 19. Savova GK, Masanz JJ, Ogren PV, et al. Mayo clinical Text Analysis and Knowledge Extraction System (cTAKES): architecture, component evaluation and applications. J Am Med Inform Assoc 2010; 17 (5): 507–13. [DOI] [PMC free article] [PubMed] [Google Scholar]
- 20. Soysal E, Wang J, Jiang M, et al. CLAMP-a toolkit for efficiently building customized clinical natural language processing pipelines. J Am Med Inform Assoc 2020; 25 (3): 331–6. doi: 10.1093/jamia/ocx132. [DOI] [PMC free article] [PubMed] [Google Scholar]
- 21. López Pineda A, Ye Y, Visweswaran S, Cooper GF, Wagner MM, Tsui FR.. Comparison of machine learning classifiers for influenza detection from emergency department free-text reports. J Biomed Inform 2015; 58: 60–9. [DOI] [PMC free article] [PubMed] [Google Scholar]
- 22. Afzal Z, Schuemie MJ, van Blijderveen JC, Sen EF, Sturkenboom M, Kors JA.. Improving sensitivity of machine learning methods for automated case identification from free-text electronic medical records. BMC Med Inform Decis Mak 2013; 13 (1): 30. [DOI] [PMC free article] [PubMed] [Google Scholar]
- 23. Amrit C, Paauw T, Aly R, Lavric M.. Identifying child abuse through text mining and machine learning. Expert Syst Appl 2017; 88: 402–18. [Google Scholar]
- 24. Rajkomar A, Oren E, Chen K, et al. Scalable and accurate deep learning with electronic health records. NPJ Digit Med 2018; 1: 18. [DOI] [PMC free article] [PubMed] [Google Scholar]
- 25. Obeid JS, Weeda ER, Matuskowitz AJ, et al. Automated detection of altered mental status in emergency department clinical notes: a deep learning approach. BMC Med Inform Decis Mak 2019; 19 (1): 164. [DOI] [PMC free article] [PubMed] [Google Scholar]
- 26.Centers for Disease Control and Prevention. Coronavirus Disease 2019 (COVID-19). https://www.cdc.gov/coronavirus/2019-ncov/hcp/clinical-criteria.html Accessed April 27, 2020.
- 27. Ferrucci D, Lally A.. UIMA: an architectural approach to unstructured information processing in the corporate research environment. Nat Lang Eng 2004; 10 (3–4): 327–48. [Google Scholar]
- 28. Culpeper J. Keyness: Words, parts-of-speech and semantic categories in the character-talk of Shakespeare’s Romeo and Juliet . Int J Corpus Linguist 2009; 14 (1): 29–59. [Google Scholar]
- 29. Keras Chollet F. 2018. https://keras.io/ Accessed November 20, 2018.
- 30. Abadi M, Agarwal A, Barham P, et al. TensorFlow: large-scale machine learning on heterogeneous systems. 2018. https://www.tensorflow.org/ Accessed November 20, 2018
- 31. Mikolov T, Chen K, Corrado G, Dean J. Efficient estimation of word representations in vector space. arXiv:1301.3781.v3.
- 32. McDonald R, Brokos G-I, Androutsopoulos I. Deep relevance ranking using enhanced document-query interactions. arXiv:1809.01682.v2
- 33.MLflow-a platform for the machine learning lifecycle. https://mlflow.org/ Accessed May 4, 2020.
- 34.U.S. Department of Health and Human Services. 45 CFR 46. HHS.gov. https://www.hhs.gov/ohrp/regulations-and-policy/regulations/45-cfr-46/index.html Accessed April 26, 2020.
- 35.Medical University of South Carolina. QI Program Evaluation Self-Certification Tool. https://research.musc.edu/resources/ori/irb/submissions/qi-tool Accessed April 26, 2020.
- 36. Reeves JJ, Hollandsworth HM, Torriani FJ, et al. Rapid response to COVID-19: health informatics support for outbreak management in an academic health system. J Am Med Inform Assoc 2020; 27 (6): 853–9. doi: 10.1093/jamia/ocaa037. [DOI] [PMC free article] [PubMed] [Google Scholar]
- 37. Perez-Alba E, Nuzzolo-Shihadeh L, Espinosa-Mora JE, Camacho-Ortiz A.. Use of self-administered surveys through QR code and same center telemedicine in a walk-in clinic in the era of COVID-19. J Am Med Inform Assoc 2020; 27 (6): 985–6. doi: 10.1093/jamia/ocaa054. [DOI] [PMC free article] [PubMed] [Google Scholar]
- 38. Judson TJ, Odisho AY, Neinstein AB, et al. Rapid design and implementation of an integrated patient self-triage and self-scheduling tool for COVID-19. J Am Med Inform Assoc 2020; 27 (6): 860–6. doi: 10.1093/jamia/ocaa051. [DOI] [PMC free article] [PubMed] [Google Scholar]
- 39. Turer RW, Jones I, Rosenbloom ST, Slovis C, Ward MJ.. Electronic personal protective equipment: a strategy to protect emergency department providers in the age of COVID-19. J Am Med Inform Assoc 2020; 27 (6): 967–71. doi: 10.1093/jamia/ocaa048. [DOI] [PMC free article] [PubMed] [Google Scholar]
- 40. Spinato G, Fabbris C, Polesel J, et al. Alterations in smell or taste in mildly symptomatic outpatients with SARS-CoV-2 infection. JAMA 2020; 323 (20): 2089–90. doi: 10.1001/jama.2020.6771. [DOI] [PMC free article] [PubMed] [Google Scholar]
- 41.Centers for Disease Control and Prevention. Coronavirus disease 2019 (COVID-19)–symptoms. https://www.cdc.gov/coronavirus/2019-ncov/symptoms-testing/symptoms.html Accessed May 4, 2020.
- 42.Centers for Disease Control and Prevention COVID-19 Response Team. Preliminary estimates of the prevalence of selected underlying health conditions among patients with coronavirus disease 2019-United States, February 12-March 28, 2020. MMWR Morb Mortal Wkly Rep 2020; 69 (13): 382–6. [DOI] [PMC free article] [PubMed] [Google Scholar]