Abstract
Purpose
To assess feasibility of training a convolutional neural network (CNN) to automate liver segmentation across different imaging modalities and techniques used in clinical practice and to apply this technique to enable automation of liver biometry.
Materials and Methods
A two-dimensional U-Net CNN was trained for liver segmentation in two stages by using 330 abdominal MRI and CT examinations. First, the neural network was trained with unenhanced multiecho spoiled gradient-echo images from 300 MRI examinations to yield multiple signal weightings. Then, transfer learning was used to generalize the CNN with additional images from 30 contrast material–enhanced MRI and CT examinations. Performance of the CNN was assessed by using a distinct multi-institutional dataset curated from multiple sources (498 subjects). Segmentation accuracy was evaluated by computing Dice scores. These segmentations were used to compute liver volume from CT and T1-weighted MRI examinations and to estimate hepatic proton density fat fraction (PDFF) from multiecho T2*-weighted MRI examinations. Quantitative volumetry and PDFF estimates were compared between automated and manual segmentation by using Pearson correlation and Bland-Altman statistics.
Results
Dice scores were 0.94 ± 0.06 for CT (n = 230), 0.95 ± 0.03 (n = 100) for T1-weighted MRI, and 0.92 ± 0.05 for T2*-weighted MRI (n = 168). Liver volume measured with manual and automated segmentation agreed closely for CT (95% limits of agreement: −298 mL, 180 mL) and T1-weighted MRI (95% limits of agreement: −358 mL, 180 mL). Hepatic PDFF measured by the two segmentations also agreed closely (95% limits of agreement: −0.62%, 0.80%).
Conclusion
By using a transfer-learning strategy, this study has demonstrated the feasibility of a CNN to be generalized to perform liver segmentation across different imaging techniques and modalities. With further refinement and validation, CNNs may have broad applicability for multimodal liver volumetry and hepatic tissue characterization.
© RSNA, 2019
Summary
Automated liver segmentation from CT and MRI data is feasible with a convolutional neural network, requiring relatively few image datasets for generalization to multiple imaging modalities and techniques.
Key Points
■ For the multimodal convolutional neural network, Dice scores were 0.92 ± 0.05 for two-dimensional spoiled gradient-recalled echo (SPGR) (first echo), 0.93 ± 0.02 for three-dimensional SPGR (first echo), 0.94 ± 0.06 for contrast-enhanced and unenhanced CT, and 0.95 ± 0.03 for hepatobiliary phase T1-weighted MRI.
■ Liver volume measured with manual and automated segmentation agreed closely for CT (95% limits of agreement: −298 mL, 180 mL) and T1-weighted MRI (limits of agreement: −358 mL, 180 mL]).
■ Hepatic proton density fat fraction measured by the two segmentations also agreed closely (limits of agreement: −0.62%, 0.80%).
Introduction
Quantitative imaging, the extraction of quantifiable features from medical images, has been shown to be useful for grading disease severity, determining appropriate treatment choice, and monitoring treatment response (1). However, current technologies often require manual analysis by radiologists to extract these quantitative features, which is time-consuming, labor intensive, and prone to error (1). Automated image analysis may reduce errors from manual analysis (2–4). Specifically, in abdominal imaging, liver segmentation has multiple direct potential clinical applications, including automated liver volume measurement, which is an important prognostic metric for hepatic surgical procedures (5–9), and determination of radiation dose in liver tumor radioembolization (10). Other emerging applications include quantification of proton density fat fraction (PDFF) from multiecho MRI examinations to assist in the diagnosis and management of nonalcoholic fatty liver disease (NAFLD) and assessment of liver morphology to assist in the detection of liver cirrhosis (11,12).
While efforts have been made to develop segmentation algorithms for a single modality or for a particular phase of intravenous contrast material enhancement (9,13–19), a generalized algorithm that is robust across multiple imaging modalities, techniques, sequences, signal weightings, and phases of contrast enhancement would be beneficial for many clinical applications. For example, a patient might undergo different types of CT and MRI examinations during routine clinical care. A modality-independent segmentation algorithm that can automatically track liver volume longitudinally from any or all scans could provide useful prognostic information (20,21). Another application of automated segmentation is hepatic PDFF quantification, which is commonly performed by using chemical shift–encoded (CSE) MRI techniques. CSE MRI techniques often use multiecho proton density weighted MRI with variable T2* weighting (22). However, there is no one standard for CSE MRI, and examinations may be performed across multiple scanners and field strengths at different institutions (23). A segmentation algorithm that is robust to technical parameters and scanner types would permit automated hepatic PDFF quantification and broaden its clinical applicability. In addition, cross-modality registration, which has proven useful in the detection of longitudinal change in follow-up studies may benefit from modality-independent segmentation (24).
Recently, convolutional neural networks (CNNs), a form of machine learning, have shown promise for performing automated liver segmentation during routine CT examinations (13). CNNs are capable of automatically learning relevant features to segment the liver in a training set of images. Unlike traditional algorithms, in which a limited set of image features for segmentation are carefully designed by computer programmers, CNNs have the ability to automatically identify and weigh these features (25). This property may enable CNNs to handle heterogeneous image data well. One commonly believed drawback of CNNs is that they require a large amount of manually labeled data to learn a specific task (25), which could be a substantial barrier to developing applications in medical imaging because expert annotation could be required. Transfer learning is a technique in which a CNN trained for one task is adapted to perform a related task, which may reduce the amount of training data required (25).
We therefore hypothesized that it may be possible to develop a single CNN to accomplish the liver segmentation task, using a staged transfer-learning strategy to minimize the number of training datasets required. We assess the feasibility of this general framework to train a CNN to perform liver segmentation across different imaging modalities and techniques. We further evaluated the CNN for two applications to show its clinical potential: (a) automated CT and MRI liver volumetry and (b) automated hepatic PDFF quantification.
Materials and Methods
Data Sources and Patient Demographics
In this cross-sectional institutional review board–approved, Health Insurance Portability and Accountability Act–compliant study, we retrospectively identified a convenience sample of 563 abdominal CT and MRI examinations performed between 2009 and 2017 in 530 adults (mean age, 55 years ± 13 [standard deviation]; 49% female; mean weight, 76 kg ± 15) for research (n = 350) or clinical care (n = 180) at our institution. In addition, we retrospectively identified 298 abdominal CT and MRI examinations from other institutions available to us through collaborative research agreements and public data to provide external validation of our study. Demographics and other characteristics of each cohort are summarized in Table 1 and Figure E1 and Appendix E1 (supplement). For research images, written informed consent was obtained from each subject at the time of the original study. For clinical images, we obtained a waiver of consent from our institutional review board. All images were de-identified before inclusion in this study. Some of the image data obtained for research (300 of 530 subjects) were published previously in the context of other research studies unrelated to machine-learning research (22,37). Most of the previously published studies focused on hepatic PDFF estimations from manually placed regions of interest on MR images, while the current study focuses on training and validating an automated liver segmentation method. Thus, the data are used in a completely different way.
Table 1:
Patient Characteristics for the Different Types of Image Data Used in the Current Study
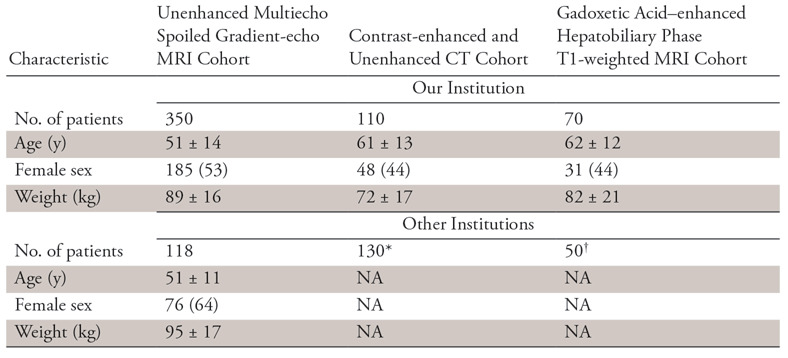
Note.—Data are either number of patients or mean ± standard deviation. Data in parentheses are percentages. NA = not available.
*This is an anonymous publicly available CT image dataset; thus, patient demographic information is not available.
†These are anonymized clinical image data from a collaborating institution; thus, patient demographic data are not available.
CT and MRI Data
Four different types of images were included in this study: (a) unenhanced low flip angle two-dimensional (2D) multiecho spoiled gradient-echo (SPGR) MRI with variable T2* weighting (hereafter, 2D SPGR), (b) unenhanced low flip angle three-dimensional (3D) multiecho SPGR MRI with variable T2* weighting (hereafter, 3D SPGR), (c) contrast-enhanced CT obtained during the portal venous phase about 70 seconds after injection of iohexol (Omnipaque 350; GE Healthcare, Princeton, NJ) and unenhanced CT, and (d) contrast-enhanced T1-weighted MRI in the hepatobiliary phase (HBP) performed about 20 minutes after injection of 0.025 mmol per kilogram of body weight gadoxetate disodium (Eovist; Bayer-Scherling, Berlin, Germany), which is a hepatobiliary agent (hereafter, HBP T1-weighted MRI). The imaging systems and techniques are summarized in Table 2. These imaging types were selected because at our institution the first two are routinely used for hepatic PDFF quantification, while the latter two are routinely used for liver volumetry prior to hepatic surgery (26,27). An additional advantage is that each of the first two examination types generated perfectly coregistered images acquired simultaneously during single-breath holds at successively longer echo times (TEs) with increasing T2* weighting and variable degrees of fat-water signal oscillation. Since all images were coregistered in those two examination types, one manual segmentation yielded ground-truth for all six TEs, which facilitated CNN training over a range of image contrasts.
Table 2:
Imaging Systems and Parameters
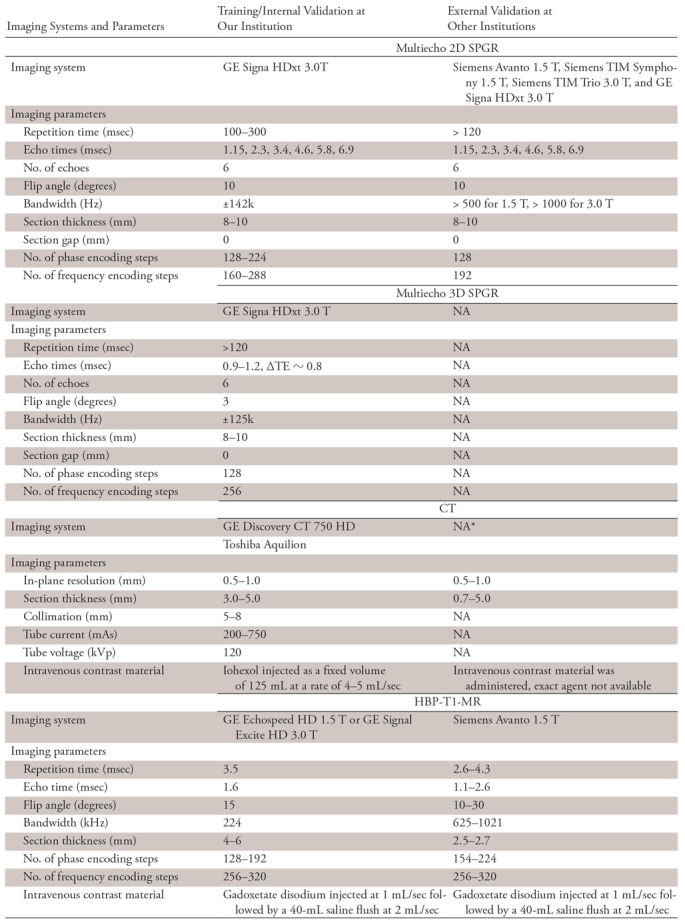
Note.—HBP-T1-MR = contrast-enhanced hepatobiliary phase T1-weighted MRI, NA = not available, TE = echo time, 3D-SPGR = unenhanced low-flip-angle three-dimensional multiecho spoiled gradient-echo MRI with variable T2* weighting; 2D-SPGR = unenhanced low-flip-angle two-dimensional multiecho spoiled gradient-echo MRI with variable T2* weighting.
*This is a de-identified publicly available CT image dataset; some of the imaging parameters are not available from the image headers.
Both multiecho SPGR sequences used TEs optimally spaced for fat-water signal separation using magnitude (for 2D SPGR) (22) or complex (for 3D SPGR) (28) reconstruction. From the source images, hepatic PDFF parametric maps were generated by the scanner applying inline algorithms that corrected for T2* decay (29,30) and fat-water signal interference (28). Those maps were then used to quantify hepatic PDFF.
Initial CNN Training
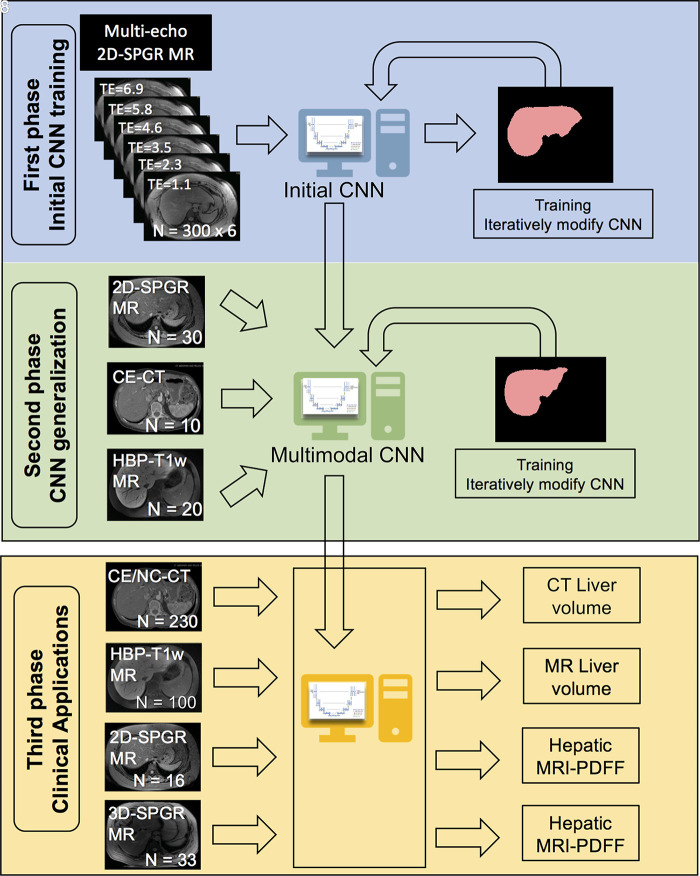
In this first phase, we trained a modified U-Net CNN to segment the liver by using 300 unenhanced multiecho 2D SPGR source image sets acquired from unique subjects at six TEs (TE range, 1.15–6.90 msec). Since the different TEs generated different image contrasts, images acquired at each TE were used as independent inputs to the CNN (Fig 1).
Figure 1:
Overview of the study design, which comprised three phases. In the first phase, we trained with unenhanced low-flip-angle two-dimensional (2D) multiecho spoiled gradient-echo (SPGR) MR images with variable T2* weighting (n = 300) with multiple echo times (TEs) to be robust against different signal weightings. In the second phase, we used transfer learning to generalize our convolutional neural network (CNN) to other imaging modalities by using multimodal image data (30 2D SPGR MRI datasets, 10 contrast-enhanced CT datasets, 20 contrast-enhanced T1-weighted hepatobiliary phase MRI datasets). In the third phase, we assessed the accuracy of liver segmentation, liver volumetry, and hepatic proton density fat fraction (PDFF) estimation. 3D-SPGR = unenhanced low-flip-angle three-dimensional multiecho spoiled gradient-echo MRI with variable T2* weighting; CE/NC-CT = contrast-enhanced and unenhanced CT; HBP-T1w MR = contrast-enhanced T1-weighted MRI in the hepatobiliary phase performed about 20 minutes after injection of 0.025 mmol per kilogram of body weight gadoxetate disodium, a hepatobiliary agent.
This initial CNN was unable to accurately segment the liver on contrast-enhanced and unenhanced CT (mean Dice score, 0.82 ± 0.14) or HBP T1-weighted MR images (mean Dice score, 0.08 ± 0.15), presumably due to differences in tissue contrast between the contrast-enhanced CT and MR images and the unenhanced MR images used in the initial training.
CNN Generalization
In this second phase, we applied transfer learning to generalize the CNN to other imaging methods and tissue contrasts. Transfer learning is a technique in which a CNN that has previously been trained for a specific task is used as a starting model to train a new CNN for a related task (25). Since the training begins with a starting model, the new CNN has the potential to learn the new task with a smaller amount of training data. In this case, we used the initial CNN described earlier in the article as the starting model and provided additional training using a total of 60 image sets, including samples from three imaging methods: (a) 30 unenhanced multiecho 2D SPGR MRI liver examinations, including a subset of the original training data selected at random to ensure that the multimodal CNN could retain its ability to perform liver segmentation on these images; (b) 10 contrast-enhanced CT abdominal examinations, and (c) 20 contrast-enhanced T1-weighted MRI abdominal examinations in the HBP.
To further investigate how the amount of training data may affect the accuracy of liver segmentation, we also explored the incremental effect of training the CNN, varying number of CT image sets from one to 10, while keeping the number of training data sets for other imaging types constant. Similarly, we explored the incremental effect of training the CNN varying the number of HBP T1-weighted MR image sets from one to 20.
CNN Validation
We assessed the accuracy of the CNNs for liver segmentation, liver volumetry, and hepatic PDFF quantification using two datasets, one from our institution using the same scanner as the training data (internal validation) and another in which the majority of data were from collaborative institutions or publicly available data (external validation).
Internal Validation
Four different sets of CT and MR images were included: (a) 100 clinical contrast-enhanced and unenhanced CT image sets of the abdomen, (b) 50 contrast-enhanced 1.5- or 3-T HBP T1-weighted MR examinations, (c) 50 unenhanced 3-T multiecho 2D SPGR MRI examinations with six TEs (1.1, 2.3, 3.5, 4.6, 5.8, and 6.9 msec), and (d) 33 unenhanced 3-T multiecho 3D SPGR MRI examinations with six TEs (0.9, 1.7, 2.5, 3.2, 4.0, and 4.7 msec). Of note, the multiecho 2D and 3D SPGR MRI examinations were performed in the same 50 patients. Also, the multiecho 3D SPGR image type had not been used in either the initial CNN training or CNN generalization phases.
External Validation
Three different sets of CT and MR images are included: (a) 130 publicly available contrast-enhanced abdominal CT image sets from seven institutions across Europe and Canada (http://www.lits-challenge.com) (31), (b) 50 contrast-enhanced abdominal 1.5-T T1-weighted MRI examinations in the HBP obtained from an outside institution through a research collaboration, and (c) 118 unenhanced multiecho liver 2D SPGR MRI examinations, each with six TEs, from a multicenter clinical trial in which our institution was a participating site (32).
Liver Segmentation
We conducted two validation experiments to assess the accuracy of our initial and final multimodal CNN for liver segmentation. In the first experiment, we assessed the accuracy of the initial CNN for liver segmentation using each of the six echoes from the 50 multiecho 2D and 3D SPGR MRI examinations from the internal validation dataset. The goal of this experiment was to assess the robustness of the initial CNN across different signal-weighting and MRI techniques, even those that were not used in the training. In the second experiment, we compared the accuracy of the initial and multimodal CNN for liver segmentation using all four types of images from both the internal and the external validation datasets. The first echo used was from the multiecho 2D and 3D SPGR MRI examinations for this experiment because segmentation accuracy was not affected by TEs (see Results). The goal of the second experiment was to investigate the effectiveness of transfer learning on CNN training. In addition, we evaluated the segmentation accuracy of the additional CNNs trained by using varying numbers of CT and contrast-enhanced HBP T1-weighted MRI examinations, as described previously.
Ground Truth for Liver Segmentation
Under the supervision of a board-certified abdominal radiologist, two readers (K.W., A.M.), a radiology resident and an image analyst with at least 2 years of experience evaluating CT and MRI examinations, manually labeled the liver on all images from both the CT and the MRI examinations. The interactive image segmentation software (ITK-SNAP 3.6; Penn Image Computing and Science Laboratory, Philadelphia, Pa) was used for manual segmentation (33).
Liver Volumetry
For the contrast-enhanced and unenhanced CT and contrast-enhanced T1-weighted HBP MRI examinations, liver area was computed for each axial image using multimodal CNN-based liver segmentation, liver areas were multiplied by section thickness to obtain per-image liver volumes, and those liver volumes were summed over all images to obtain an estimate of whole-liver volume.
Ground Truth for Liver Volumetry
For liver volumetry, liver volumes calculated based on manual segmentation (as described previously) were used as the reference standard.
Hepatic PDFF Estimation
For the multiecho 2D and 3D SPGR image sets, mean hepatic PDFF was computed by averaging the PDFF values within the whole liver. This was done by colocalizing the automated CNN-based liver segmentations obtained from the first echo of the multiecho SPGR MRI examinations to the corresponding PDFF parametric maps and then averaging the PDFF values of all pixels contained within the segmented volumes. The PDFF maps and the multiecho SPGR MR images were perfectly coregistered, so no additional registration was required. The first echo was chosen because it provided the best average liver segmentation accuracy in the validation dataset (see Results). Liver segmentations were performed on the source SPGR images instead of on the PDFF maps directly because source images were used in the manual segmentation (described in a subsequent section).
Ground Truth for Hepatic PDFF Estimation
For hepatic PDFF estimation, the manual liver segmentations obtained from the first echo of the multiecho SPGR MR images were colocalized to the corresponding PDFF parametric maps, and the PDFF values of all pixels contained within the segmented volumes were averaged. The liver was segmented manually on source images rather than PDFF maps because the source images provided better visualization of liver borders subjectively.
Statistical Analysis
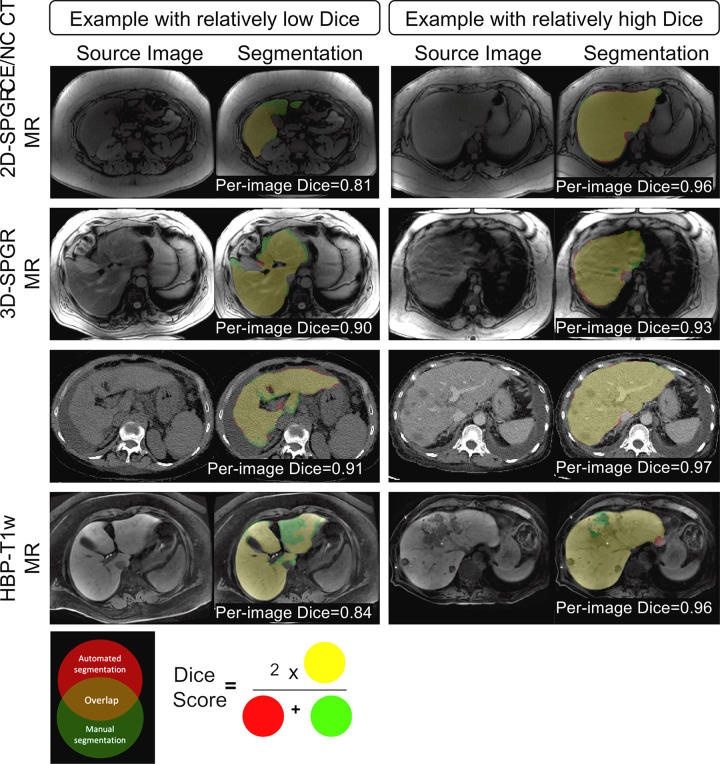
Descriptive summaries were generated, including calculation of means, standard deviations, and ranges. To evaluate segmentation accuracy quantitatively, we computed the Dice score between CNN-predicted and manually labeled liver segmentations. The Dice score was defined as the volume of overlap between segmentations from the CNN and from the manual labeling divided by the averaged segmentation volume between the two methods, as shown in Figure 2. To examine the effect of TEs and 2D or 3D SPGR sequences on segmentation accuracy, repeated one-way analysis of variance was performed on Dice scores for each factor (TEs or SPGR sequence). To compare the performance of the initial CNN and the multimodal CNN, a paired t test was performed on Dice scores for each of the four validation datasets. To compare manual versus automated liver volumetry, linear regression and Bland-Altman analyses were performed on liver volume assessed with automated and manual segmentations. Hepatic PDFF estimations from automated and manual segmentations were compared by using similar analyses.
Figure 2:
Examples of multimodal convolutional neural network (CNN) liver segmentation results for each imaging modality. Each row represents example images and resulting segmentation from a specific imaging modality. Two examples are shown for each modality, one with relatively low Dice score and one with relatively high Dice score. Segmentation results are color coded, as shown in the Venn diagram. The color-coded labels give a sense of what the numeric Dice score represents. The definition of Dice score between the automated and manual method is also shown. HBP-T1w-MRI = contrast-enhanced T1-weighted MRI in the hepatobiliary phase performed about 20 minutes after injection of 0.025 mmol/kg gadoxetate disodium, a hepatobiliary agent; CE/NC CT = contrast-enhanced or noncontrast CT; 3D-SPGR = unenhanced low-flip-angle three-dimensional multiecho spoiled gradient-echo MRI with variable T2* weighting; 2D-SPGR = unenhanced low-flip-angle two-dimensional multiecho spoiled gradient-echo MRI with variable T2* weighting.
Results
Segmentation Accuracy of the Initial CNN on Multiecho 2D and 3D SPGR Sequences
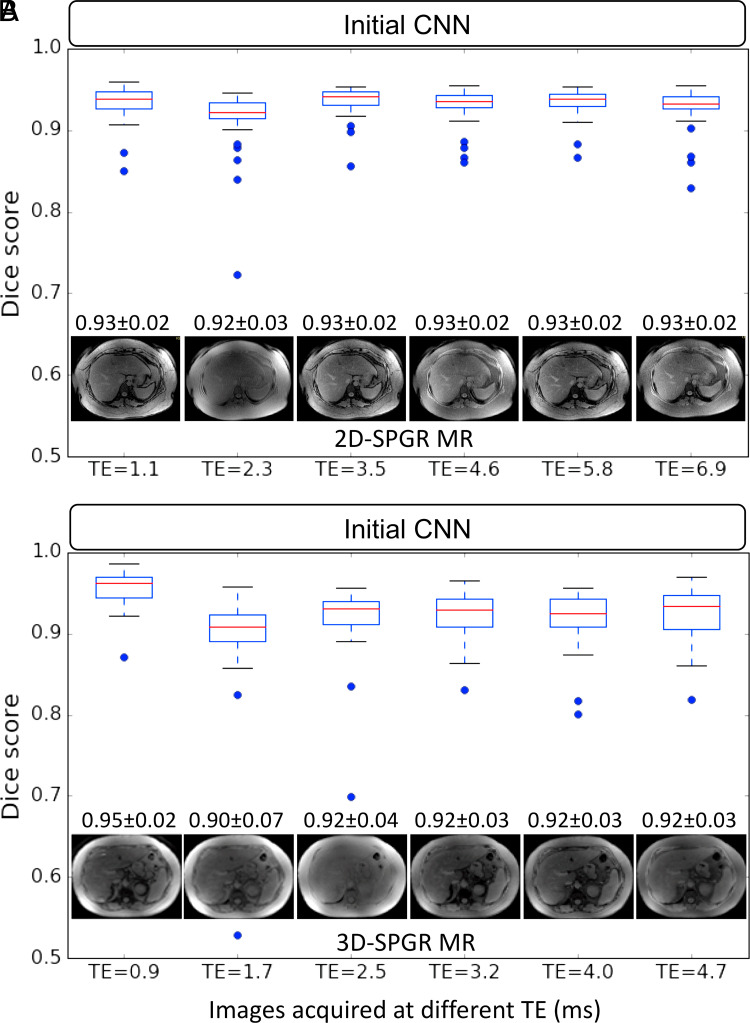
Dice scores of the initial CNN for liver segmentation on multiecho 2D and 3D SPGR MR images ranged from 0.90 ± 0.07 to 0.95 ± 0.02 (Fig 3). Nominally, the first echo provided the highest Dice scores for both 2D and 3D SPGR, although repeated one-way analysis of variance testing revealed no significant differences between TEs (F = 1.29. P = .23) or SPGR sequence (F = 1.005, P = .31). Since there was no significant difference in segmentation accuracy between images from different TEs, subsequent analyses focused only on the first echo for the multiecho SPGR image sets.
Figure 3:
Liver segmentation accuracy of the initial convolutional neural network (CNN) on images with different technical parameters (ie, echo time [TE]) and MR techniques (unenhanced low-flip-angle two-dimensional multiecho spoiled gradient-echo MRI with variable T2* weighting [2D-SPGR] vs unenhanced low-flip-angle three-dimensional multiecho spoiled gradient-echo MRI with variable T2* weighting [3D-SPGR]). Each boxplot summarizes Dice scores on image series acquired with the same imaging technique and TE. Dices scores for image series acquired with 2D SPGR and 3D SPGR MRI sequences were plotted separately in, A, and, B, respectively. A representative MR image acquired by using each TE and MR technique is shown along with the mean Dice score ± standard deviation.
Segmentation Accuracy of the Initial and Multimodal CNNs in the Validation Image Sets
Dice scores for initial CNN and multimodal CNN in the four validation datasets are summarized in Figure 4a and 4b, respectively. For the initial CNN, Dice scores were 0.93 ± 0.04 for 2D SPGR (first echo), 0.95 ± 0.02 for 3D SPGR (first echo), 0.82 ± 0.14 for contrast-enhanced and unenhanced CT, and 0.08 ± 0.15 for HBP T1-weighted MRI. For the multimodal CNN, Dice scores were 0.92 ± 0.05 for 2D SPGR (first echo), 0.93 ± 0.02 for 3D SPGR (first echo), 0.94 ± 0.06 for contrast-enhanced and unenhanced CT, and 0.95 ± 0.03 for HBP T1-weighted MRI. When compared with the initial CNN, Dice scores for the multimodal CNN were meaningfully higher for contrast-enhanced and unenhanced CT (ΔDice = 0.12 ± 0.12, P < .001) and HBP T1-weighted MRI (ΔDice = 0.87 ± 0.16, P < .001) but were only slightly lower for unenhanced 2D SPGR (first echo) (ΔDice = −0.01 ± 0.02, P < .001) and 3D SPGR (first echo) (ΔDice = −0.03 ± 0.02, P < .001) (Table 3 summarizes the comparison). Although the mean Dice scores are greater than 0.90 for multimodal CNN regardless of image type, there were a few outliers for each image type, suggesting that robustness of the CNN needs to be improved before it is ready for clinical use.
Figure 4a:
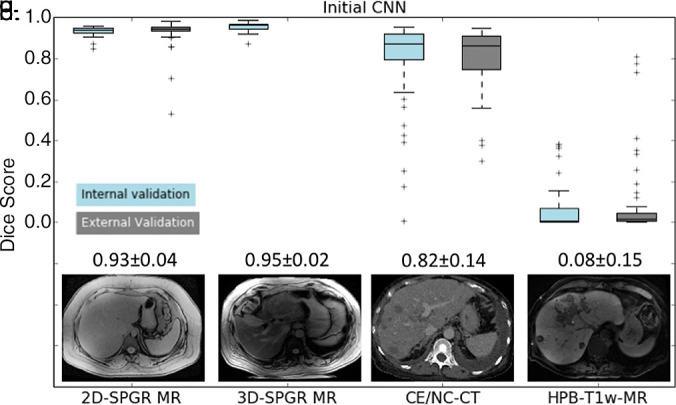
Liver segmentation accuracy for (a) the initial convolutional neural network (CNN) and (b) the multimodal CNN. (c) Segmentation accuracy for the multimodal CNN trained by using one to 10 CT image sets. (d) Segmentation accuracy for the multimodal CNN trained using one to 20 contrast-enhanced hepatobiliary phase T1-weighted MRI datasets (HBP-T1w-MRI). 3D-SPGR = unenhanced low-flip-angle three-dimensional multiecho spoiled gradient-echo MRI with variable T2* weighting; 2D-SPGR = unenhanced low-flip-angle two-dimensional multiecho spoiled gradient-echo MRI with variable T2* weighting; CE/NC-CT = contrast-enhanced or unenhanced CT.
Figure 4b:
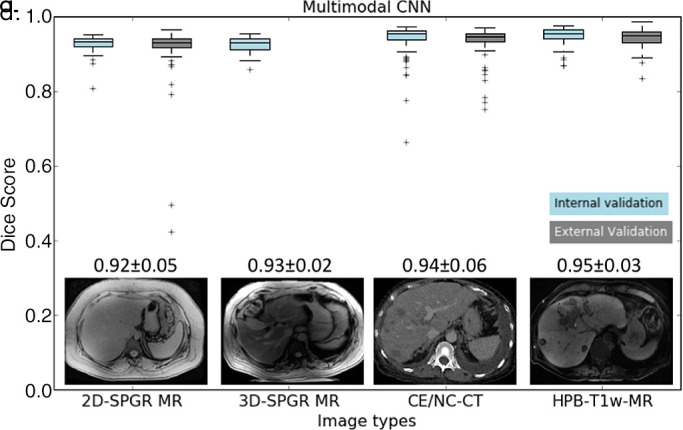
Liver segmentation accuracy for (a) the initial convolutional neural network (CNN) and (b) the multimodal CNN. (c) Segmentation accuracy for the multimodal CNN trained by using one to 10 CT image sets. (d) Segmentation accuracy for the multimodal CNN trained using one to 20 contrast-enhanced hepatobiliary phase T1-weighted MRI datasets (HBP-T1w-MRI). 3D-SPGR = unenhanced low-flip-angle three-dimensional multiecho spoiled gradient-echo MRI with variable T2* weighting; 2D-SPGR = unenhanced low-flip-angle two-dimensional multiecho spoiled gradient-echo MRI with variable T2* weighting; CE/NC-CT = contrast-enhanced or unenhanced CT.
Table 3:
Comparison of Segmentation Accuracy (Dice Scores) between Initial CNN and the Multimodal CNN

Note.—Data are mean ± standard deviation Dice score for each convolutional neural network (CNN) and the pairwise difference between Dice score are reported. Pairwise t test with Bonferroni correction for multiple hypothesis testing was used to test the statistical significance in each of the four validation datasets. 3D-SPGR = unenhanced low-flip-angle three-dimensional multiecho spoiled gradient-echo MRI with variable T2* weighting; 2D-SPGR = unenhanced low-flip-angle two-dimensional multiecho spoiled gradient-echo MRI with variable T2* weighting.
Effect of Training Data Size on Segmentation Accuracy
As shown in Figure 4c, the average Dice score increased as we added more CT image sets to train the multimodal CNN (eg, from 0.88 ± 0.13 for one CT image set to 0.91 ± 0.10 for two CT image sets). The average Dice score plateaued around 10 CT image sets (Dice = 0.94 ± 0.06). Similarly, the average Dice score increased as we increased the number of training contrast-enhanced HBP T1-weighted MR image sets (eg, from 0.81 ± 0.12 for one to 0.88 ± 0.06 for two) and plateaued at 20 HBP T1-weighted MR image sets (Dice = 0.95 ± 0.03, Fig 4d). An increase in the number of training images increased the mean Dice score (average performance) and reduced the standard deviation of the Dice score (ie, robustness).
Figure 4c:
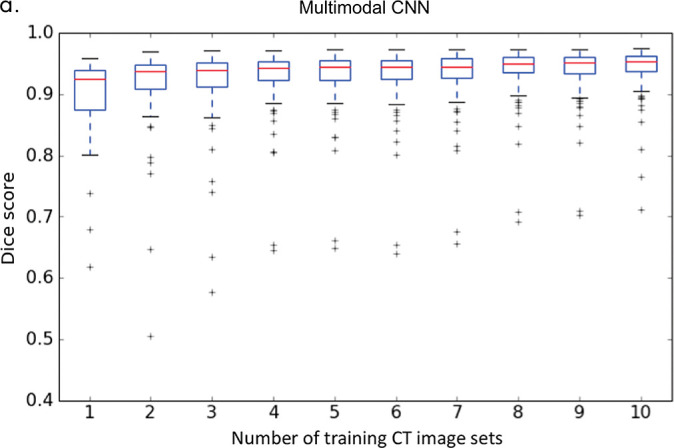
Liver segmentation accuracy for (a) the initial convolutional neural network (CNN) and (b) the multimodal CNN. (c) Segmentation accuracy for the multimodal CNN trained by using one to 10 CT image sets. (d) Segmentation accuracy for the multimodal CNN trained using one to 20 contrast-enhanced hepatobiliary phase T1-weighted MRI datasets (HBP-T1w-MRI). 3D-SPGR = unenhanced low-flip-angle three-dimensional multiecho spoiled gradient-echo MRI with variable T2* weighting; 2D-SPGR = unenhanced low-flip-angle two-dimensional multiecho spoiled gradient-echo MRI with variable T2* weighting; CE/NC-CT = contrast-enhanced or unenhanced CT.
Figure 4d:
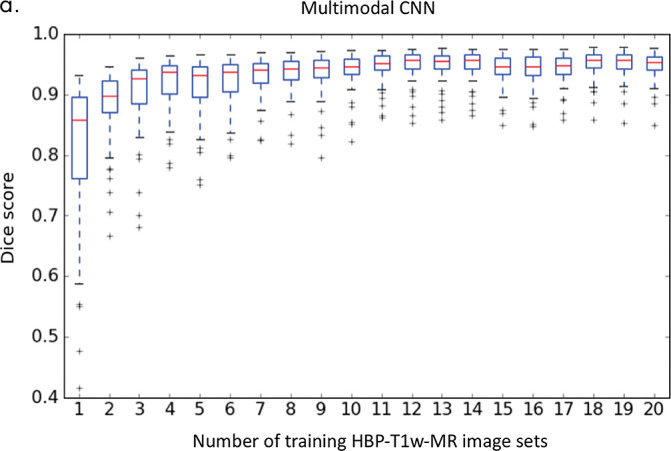
Liver segmentation accuracy for (a) the initial convolutional neural network (CNN) and (b) the multimodal CNN. (c) Segmentation accuracy for the multimodal CNN trained by using one to 10 CT image sets. (d) Segmentation accuracy for the multimodal CNN trained using one to 20 contrast-enhanced hepatobiliary phase T1-weighted MRI datasets (HBP-T1w-MRI). 3D-SPGR = unenhanced low-flip-angle three-dimensional multiecho spoiled gradient-echo MRI with variable T2* weighting; 2D-SPGR = unenhanced low-flip-angle two-dimensional multiecho spoiled gradient-echo MRI with variable T2* weighting; CE/NC-CT = contrast-enhanced or unenhanced CT.
As shown in Figure 4c and 4d, the performance gain with transfer learning is substantial even with very few training image sets (ie, n < 5). This is especially true for HBP T1-weighted MR images in which the segmentation accuracy increased from 0.08 ± 0.16 to 0.81 ± 0.12 using just one HBP T1-weighted MR image set. We speculated the poor performance for contrast-enhanced T1-weighted MRI in the HBP using the initial CNN is related to the much higher signal intensity values of the liver parenchyma relative to the background. This level of high signal intensity is probably “perceived” as intra-abdominal fat or artifact in the unenhanced 2D-SPGR data, so the initial CNN learned to ignore these intensity values. However, with some training of contrast-enhanced T1-weighted MRI in the HBP data, the CNN quickly adjusted, and its performance improved substantially.
Liver Volumetry Accuracy
A comparison of liver volume assessments between automated and manual liver segmentations is summarized in Figure 5.
Figure 5a:
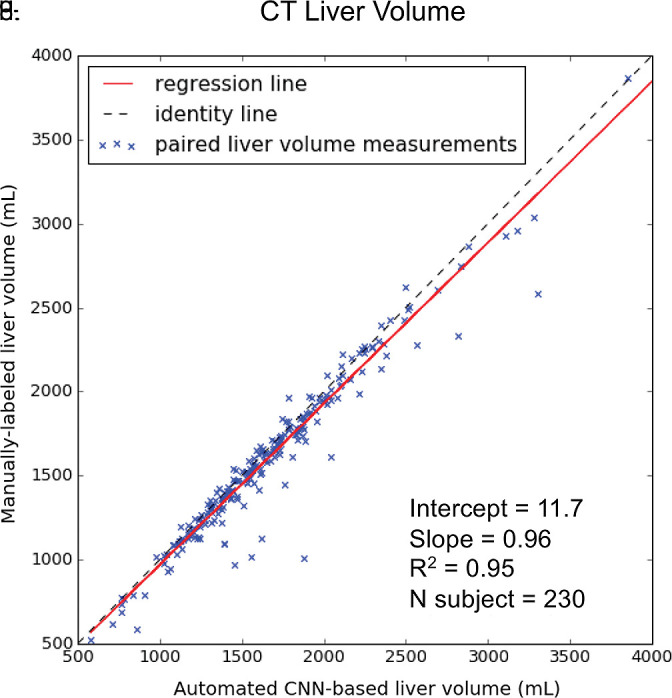
Agreement of liver volume assessments between convolutional neural network (CNN)−predicted and manual liver segmentation (third phase and clinical applications are shown in Fig 1). (a) Linear regression and (b) Bland-Altman analysis of liver volume assessments from contrast-enhanced and unenhanced CT. (c) Linear regression and (d) Bland-Altman analysis of liver volume estimates from contrast-enhanced hepatobiliary phase T1-weighted MRI (HBP-T1w-MRI). There are a few outliers for both CT and HBP-T1w-MR. These represent cases in which the multimodal CNN failed to automatically recognize and segment a portion of the liver; thus, the automated liver volume measurements are significantly lower than the manual liver volume measurements. A few cases of failed segmentation are shown in Figure E2 (supplement).
For contrast-enhanced and unenhanced CT, liver volumes from manual segmentation ranged from 577 to 5186 mL (mean volume, 1677 mL ± 540). Liver volumes from automated segmentation ranged from 400 to 5006 mL (mean volume, 1619 mL ± 532). Manual and automated liver measurements correlated strongly (R2 = 0.95, slope = 0.96, intercept = 11.7 mL; Fig 5a). When compared with the manual method, the automated method resulted in slight underestimation of liver volume (bias = −58.1 mL, P < .001); 95% limits of agreement (LoA) were −298 mL and 180 mL (Fig 5b).
Figure 5b:
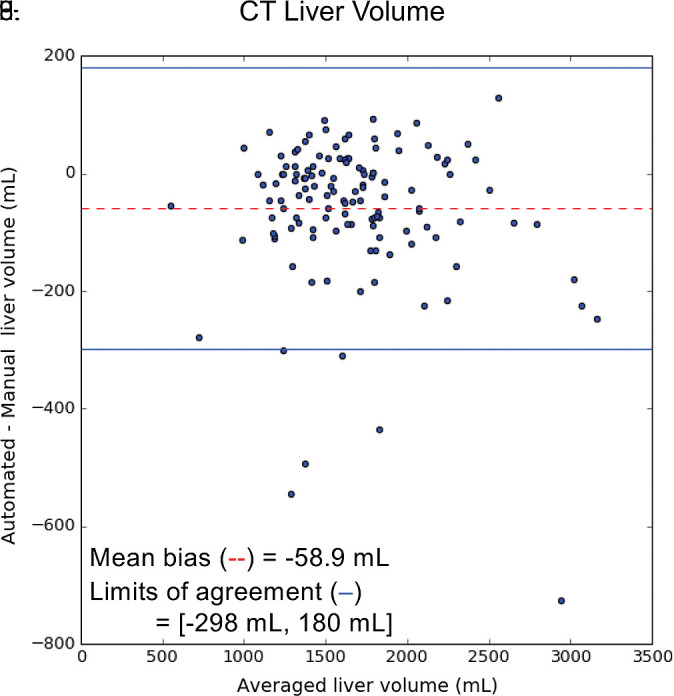
Agreement of liver volume assessments between convolutional neural network (CNN)−predicted and manual liver segmentation (third phase and clinical applications are shown in Fig 1). (a) Linear regression and (b) Bland-Altman analysis of liver volume assessments from contrast-enhanced and unenhanced CT. (c) Linear regression and (d) Bland-Altman analysis of liver volume estimates from contrast-enhanced hepatobiliary phase T1-weighted MRI (HBP-T1w-MRI). There are a few outliers for both CT and HBP-T1w-MR. These represent cases in which the multimodal CNN failed to automatically recognize and segment a portion of the liver; thus, the automated liver volume measurements are significantly lower than the manual liver volume measurements. A few cases of failed segmentation are shown in Figure E2 (supplement).
For HBP T1-weighted MRI, liver volumes from manual segmentation ranged from 858 to 5445 mL (mean volume, 2315 mL ± 901). Liver volumes from automated segmentation ranged from 856 to 5357 mL (mean, 2226 mL ± 858). Manual and automated MR liver volumetry correlated strongly (R2 = 0.98, slope = 0.94, intercept = 45.1 mL; Fig 5c). When compared with the manual method, the automated method slightly underestimated liver volume (bias = −89 mL, P < .01); 95% limits of agreement were −358 mL and 180 mL (Fig 5d).
Figure 5c:
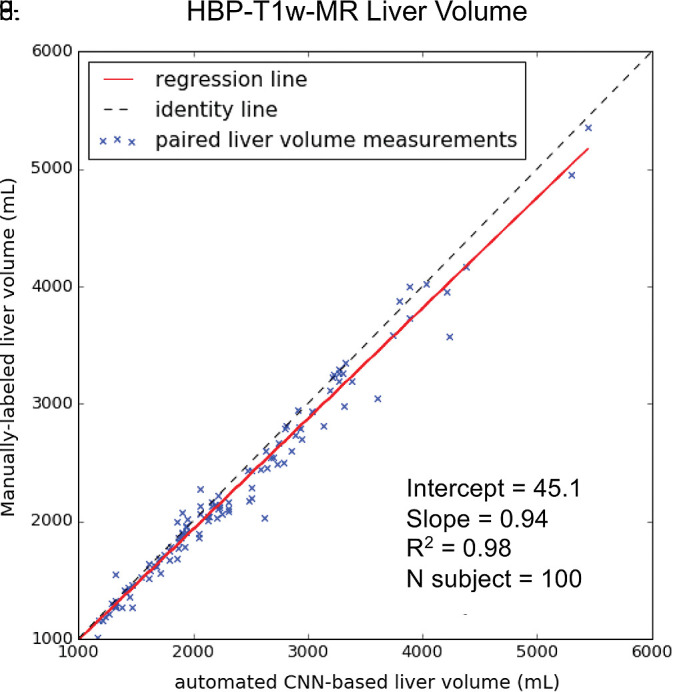
Agreement of liver volume assessments between convolutional neural network (CNN)−predicted and manual liver segmentation (third phase and clinical applications are shown in Fig 1). (a) Linear regression and (b) Bland-Altman analysis of liver volume assessments from contrast-enhanced and unenhanced CT. (c) Linear regression and (d) Bland-Altman analysis of liver volume estimates from contrast-enhanced hepatobiliary phase T1-weighted MRI (HBP-T1w-MRI). There are a few outliers for both CT and HBP-T1w-MR. These represent cases in which the multimodal CNN failed to automatically recognize and segment a portion of the liver; thus, the automated liver volume measurements are significantly lower than the manual liver volume measurements. A few cases of failed segmentation are shown in Figure E2 (supplement).
Figure 5d:
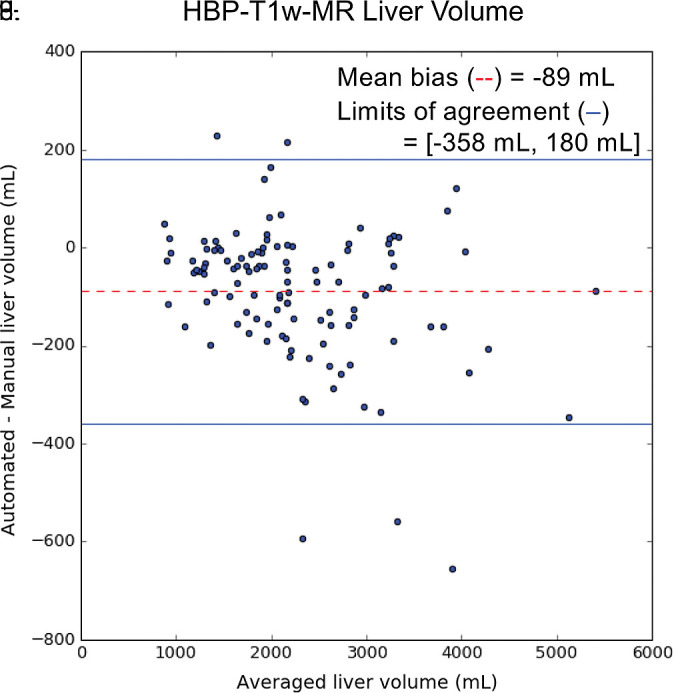
Agreement of liver volume assessments between convolutional neural network (CNN)−predicted and manual liver segmentation (third phase and clinical applications are shown in Fig 1). (a) Linear regression and (b) Bland-Altman analysis of liver volume assessments from contrast-enhanced and unenhanced CT. (c) Linear regression and (d) Bland-Altman analysis of liver volume estimates from contrast-enhanced hepatobiliary phase T1-weighted MRI (HBP-T1w-MRI). There are a few outliers for both CT and HBP-T1w-MR. These represent cases in which the multimodal CNN failed to automatically recognize and segment a portion of the liver; thus, the automated liver volume measurements are significantly lower than the manual liver volume measurements. A few cases of failed segmentation are shown in Figure E2 (supplement).
Accuracy of Hepatic PDFF Estimation
On the basis of manual measurements, hepatic MRI PDFF ranged from 1.7% to 53% for the 2D SPGR dataset and from 3.3% to 32% for the 3D SPGR dataset. Hepatic MRI PDFF measurements from manual and automated liver segmentation are compared in Figure 6. Hepatic MRI PDFF measurements with automated and manual segmentations correlated closely for 2D SPGR (R = 0.99, slope = 1.001, intercept = 0.01%; Fig 6a), and 3D SPGR (R = 0.99, slope = 0.99, intercept = 0.27%; Fig 6c). With the manual method, the automated method had no significant bias (2D SPGR: bias = 0.09%, P = .15; 3D SPGR: bias, −0.21%, P = .10); 95% limits of agreement were −0.62% and 0.80% for 2D SPGR (Fig 6b) and −1.63% and 1.21% for 3D SPGR (Fig 6d).
Figure 6a:
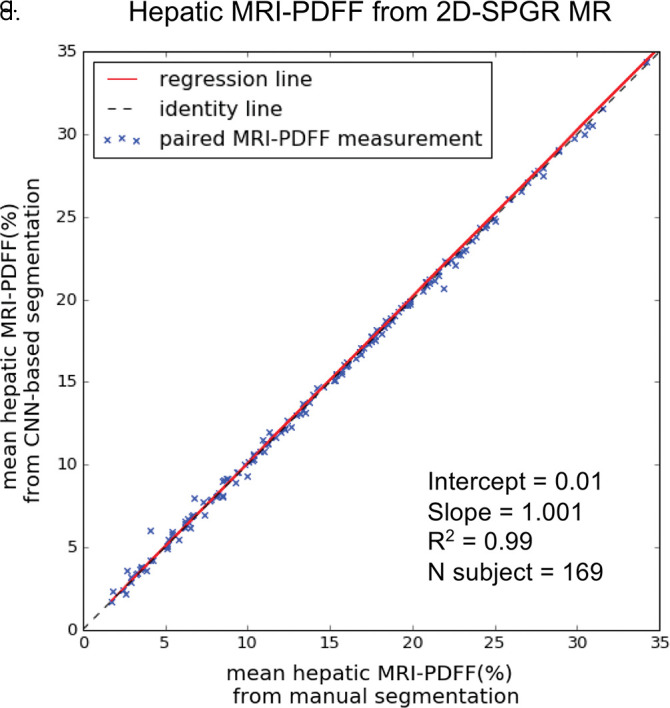
Agreement of hepatic proton density fat fraction (PDFF) assessments between convolutional neural network (CNN)−predicted and manual liver segmentation. (a) Linear regression and (b) Bland-Altman analysis of hepatic PDFF estimations computed from multiecho unenhanced low-flip-angle two-dimensional multiecho spoiled gradient-echo MRI with variable T2* weighting (2D-SPGR) MR images. (c) Linear regression and (d) Bland-Altman analysis of hepatic PDFF estimations from multiecho unenhanced low-flip-angle three-dimensional multiecho spoiled gradient-echo MRI with variable T2* weighting (3D-SPGR) MR images.
Figure 6c:
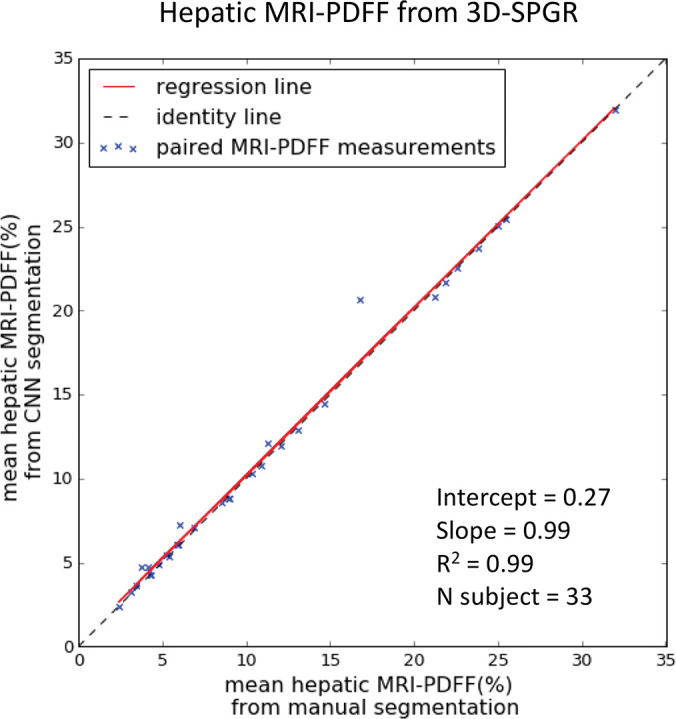
Agreement of hepatic proton density fat fraction (PDFF) assessments between convolutional neural network (CNN)−predicted and manual liver segmentation. (a) Linear regression and (b) Bland-Altman analysis of hepatic PDFF estimations computed from multiecho unenhanced low-flip-angle two-dimensional multiecho spoiled gradient-echo MRI with variable T2* weighting (2D-SPGR) MR images. (c) Linear regression and (d) Bland-Altman analysis of hepatic PDFF estimations from multiecho unenhanced low-flip-angle three-dimensional multiecho spoiled gradient-echo MRI with variable T2* weighting (3D-SPGR) MR images.
Figure 6b:
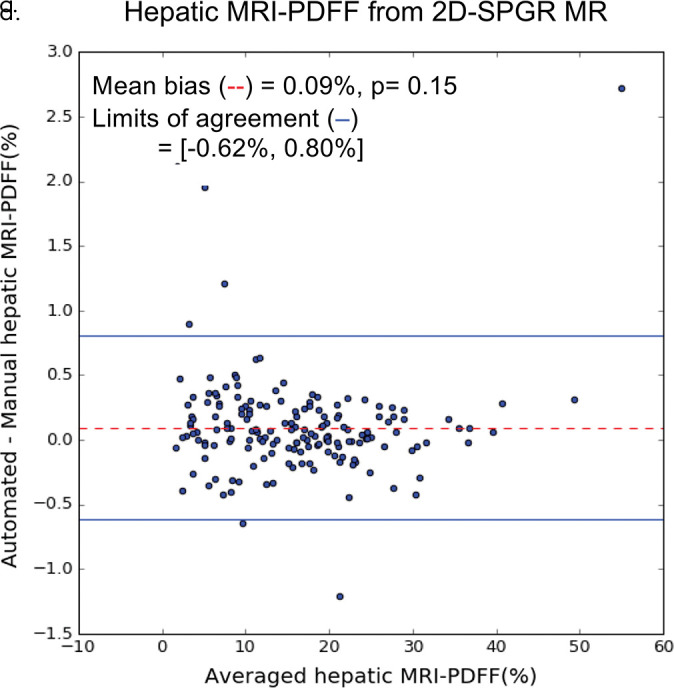
Agreement of hepatic proton density fat fraction (PDFF) assessments between convolutional neural network (CNN)−predicted and manual liver segmentation. (a) Linear regression and (b) Bland-Altman analysis of hepatic PDFF estimations computed from multiecho unenhanced low-flip-angle two-dimensional multiecho spoiled gradient-echo MRI with variable T2* weighting (2D-SPGR) MR images. (c) Linear regression and (d) Bland-Altman analysis of hepatic PDFF estimations from multiecho unenhanced low-flip-angle three-dimensional multiecho spoiled gradient-echo MRI with variable T2* weighting (3D-SPGR) MR images.
Figure 6d:
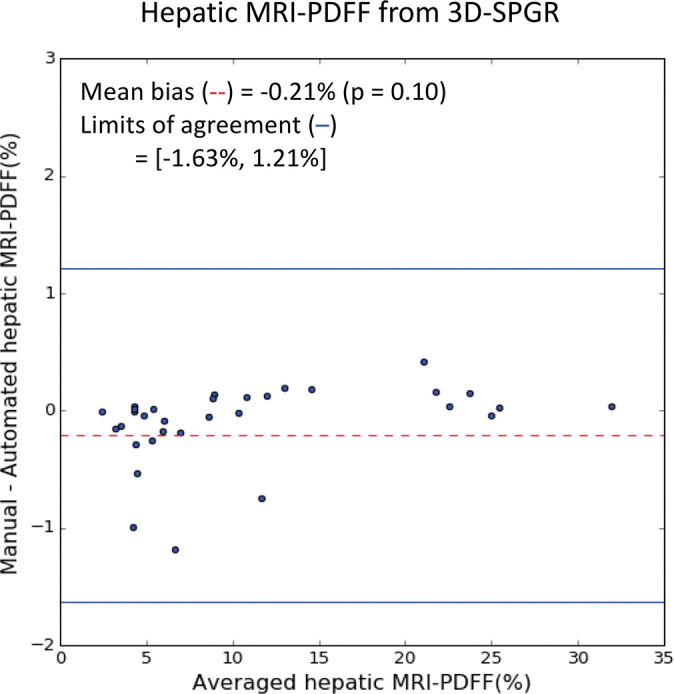
Agreement of hepatic proton density fat fraction (PDFF) assessments between convolutional neural network (CNN)−predicted and manual liver segmentation. (a) Linear regression and (b) Bland-Altman analysis of hepatic PDFF estimations computed from multiecho unenhanced low-flip-angle two-dimensional multiecho spoiled gradient-echo MRI with variable T2* weighting (2D-SPGR) MR images. (c) Linear regression and (d) Bland-Altman analysis of hepatic PDFF estimations from multiecho unenhanced low-flip-angle three-dimensional multiecho spoiled gradient-echo MRI with variable T2* weighting (3D-SPGR) MR images.
Discussion
In this study, we showed that a CNN can be trained to perform automated and accurate liver segmentation on images acquired with different imaging modalities and techniques. While it is generally believed that many labeled images are required to train CNNs, we used two strategies in the current study that might help reduce the workload of manual segmentation. First, we leveraged perfectly coregistered MR images at different TEs in the multiecho 2D SPGR datasets, so each instance of manual segmentation provides multiple instances of training data for the CNN. Second, we used transfer learning to generalize this CNN to different imaging modalities and showed that this could be performed with a relatively small amount of additional training data.
This work shows that transfer learning can be an effective approach for training CNNs for organ segmentation. The initial CNN was trained using 300 image studies, which included about 30 000 axial images. The time and effort required to generate this training data with manual segmentations represents a major bottleneck in development of CNN-based algorithms. We showed that by using transfer learning, an initial model can be generalized to other imaging modalities with a relatively small amount of additional training data (10 contrast-enhanced CT and 20 contrast-enhanced HBP T1-weighted MRI examinations). This suggests that the amount of training data for a particular task does not need to increase linearly with the number of modalities or image contrasts. A two-step staged approach shown here might be more efficient for CNN training.
Several methods have been proposed to help automate liver segmentation, but they have historically been developed and validated for a single imaging modality or technique. For CT, state-of-the-art algorithms typically have shown good performance, with mean Dice scores of 0.93–0.95 (13–15). For MRI, a wide performance range has been reported, with mean Dice scores ranging from 0.85 to 0.95 depending on the specific MR technique and contrast material used (9,16–19,34,35). In this work, we explored the feasibility of a single multimodal CNN to perform this task with comparable accuracy across different imaging modalities and techniques. This was not only feasible, but accuracy equivalent to state-of-the-art single-modality methods appears to be readily achievable.
Although the proposed multimodal CNN can perform accurate liver segmentation in most cases, there were a small number of cases in each dataset in which the CNN had difficulty, as evidenced by the outliers (see example fail cases in Fig E2 [supplement]). For example, among the contrast-enhanced and unenhanced CT images, two failed cases contain large ill-defined intrahepatic lesions that distort the normal liver architecture. Among the 2D SPGR images, two failed cases showed mild to moderate motion artifact. This was somewhat puzzling though, as the CNN was able to segment the liver accurately in other cases with marked motion artifact. In addition, the CNN appeared to be robust against many other potentially confounding diseases, such as cirrhosis, ascites, and pleural effusion. We speculate that the neural network was capable of handling these coexisting factors because they were sufficiently represented among the training data. Thus, more research and validation may be required before a system like this can be deployed and relied on in clinical practice.
Modality-independent segmentation algorithms might broaden the scope of potential clinical applications of liver segmentation techniques. A common application of liver segmentation is liver volumetry. Currently, liver volumetry is clinically indicated only for major hepatic surgical procedures or radioembolization, but other applications (eg, evaluation of hepatomegaly) have been suggested (8,20). Liver volumetry is not assessed routinely for these other applications because automated methods have not been previously demonstrated as being sufficiently robust against various diseases and for imaging modalities encountered in routine clinical studies. Our study demonstrated that when using a multimodal CNN, accurate and automated multimodal liver volumetry may be feasible in routine clinical studies. Thus, with further improvement and validation, routine volumetric measurements of solid organs including the liver might become available for multiple modalities, and the use of automated liver volumetry to detect hepatomegaly and other conditions might become practical.
Additionally, automated liver segmentation might yield a more objective and reproducible method for hepatic PDFF quantification. Current practice requires a radiologist or technologist to place regions of interest in the liver to obtain PDFF estimates. However, there is no standardization to the size, number, and location of liver regions of interest (36). Because of spatial heterogeneity of liver fat, the lack of standardization introduces some degree of measurement variability. Moreover, the placement of regions of interest is laborious, and the recording of region of interest values is subject to data entry error. Automated PDFF estimations from whole-liver segmentation standardize the method of region of interest placement while also accounting for the spatial heterogeneity of liver fat, thus potentially reducing estimation variability and increasing precision (37). Yan et al also developed a method for automated whole-liver PDFF measurements (19) in which an extra set of T1-weighted images was acquired and an atlas-based liver segmentation method was developed for the T1-weighted images. Our proposed approach could obviate the need for a separate acquisition by performing liver segmentation directly on the source SPGR MR images (38).
We recognize several limitations to this technical feasibility study. This study relied on retrospective data to train and validate the multimodal CNN, though we included image data from multiple different vendors, institutions, and imaging techniques. Contrast-enhanced images were acquired in the portal venous phase for CT and in the hepatobiliary phase for MRI. Further work may be required to ensure similar performance across other scanner manufacturers, imaging phases, and institutional protocols. More extensive testing will help identify the failure modes of the CNN, thereby informing the selection of additional training data to further improve performance. For hepatic PDFF quantification, we calculated mean PDFF from the whole-liver segmentation without excluding the intrahepatic vessels. This is known to result in slight underestimation of the true hepatic PDFF (37). In the future, intrahepatic vessel segmentation and artifact identification may be used to further improve the accuracy of automated hepatic PDFF estimation from this neural network.
In summary, we show that by using transfer learning, it is possible to generalize the performance of a CNN to perform liver segmentations across different imaging modalities and techniques. With further refinement and validation, this may have broad applicability for multimodal liver volumetry and technique-independent hepatic tissue characterization. Furthermore, we believe that a similar approach may be used to train CNNs to perform similar imaging tasks for other organs and tissues.
APPENDIX
SUPPLEMENTAL FIGURES
Acknowledgments
Acknowledgments
We gratefully acknowledge the support of NVIDIA for their generous donation of a Titan Xp graphics processing unit to train the convolutional neural networks in this research. We also thank multisite Diagnósticos da América SA (DASA) for providing part of the external validation image data for this article. We also thank the investigators of the FLINT trial for providing the 2D SPGR external validation data.
Supported by the National Institute of Diabetes and Digestive and Kidney Diseases (1R01DK088925-01), the National Institute of Biomedical Imaging and Bioengineering (5T32EB005970-09), and a collaborative research and development agreement between the National Institute of Diabetes and Digestive and Kidney Diseases and Intercept Pharmaceuticals.
Disclosures of Conflicts of Interest: K.W. disclosed no relevant relationships. A.M. disclosed no relevant relationships. T.R. disclosed no relevant relationships. N.B. disclosed no relevant relationships. K.H. disclosed no relevant relationships. K.B. disclosed no relevant relationships. E.B. disclosed no relevant relationships. T.D. disclosed no relevant relationships. G.C. disclosed no relevant relationships. M.S.M. Activities related to the present article: disclosed no relevant relationships. Activities not related to the present article: is a consultant to Novo Nordisk; institution received a grant from Gilead; holds stock in Pfizer and divested stock in General Electric; travel and accommodations for meetings related to clinical trials are covered under lab services agreements with Gilead; is a consultant for Median and Kowa; institution has lab service agreements with Alexion, AstraZeneca, Bioclinica, Biomedical Systems, Bristol-Myers Squibb, Enanta, Galmed, General Electric, Genzyme, Gilead, Guerbet, Icon, Intercept, Janssen, NuSirt, Pfizer, Profil, Roche, Sanofi, Shire, Siemens, Synageva, Takeda, and Virtualscopics. Other relationships: disclosed no relevant relationships. R.L. Activities related to the present article: institution received grants from GE and Siemens. Activities not related to the present article: disclosed no relevant relationships. Other relationships: disclosed no relevant relationships. B.A.N. Activities related to the present article: disclosed no relevant relationships. Activities not related to the present article: is a consultant for Allergan, Arrowhead, Blade, Boehringer Ingleheim, BMS, Coherus, Consynance, Enanta, Gelesis, Gilead, Intercept, Lipocine, Madrigal, Medimmune, Merck, Metacrine, NGM, pHPharma, and Prometheus. Other relationships: disclosed no relevant relationships. C.B.S. Activities related to the present article: disclosed no relevant relationships. Activities not related to the present article: is on the advisory boards of AMRA, Guerbet, VirtualScopics, and Bristol Myers Squibb as a representative for the University of California board of regents; is a consultant for GE Healthcare, Bayer, AMRA, Fulcrum Therapeutics, IBM/Watson Health, and Exact Sciences as a representative for the University of California board of regents; institution received grants from of has grants pending with Gilead, GE Healthcare, Siemens, GE MRI, Bayer, GE Digital, GE US, ACR Innovation, Philips, and Celgene; University of California regents received money from GE Healthcare and Bayer for speaking services; received royalties from Wolters Kluwer; University of California regents received money from Medscape, Resoundant, and UpToDate Publishing for development of educational presentations or articles; institution has lab service agreements with Enanta, ICON Medical Imaging, Gilead, Shire, Virtualscopics, Intercept, Synageva, Takeda, Genzyme, Janssen, and NuSirt; has independent consulting contracts with Epigenomics and Arterys. Other relationships: disclosed no relevant relationships. A.H. Activities related to the present article: disclosed no relevant relationships. Activities not related to the present article: institution received a grant from GE Healthcare; is a founder, shareholder, and consultant for Arterys; is a speaker for and received grant funding from Bayer. Other relationships: disclosed no relevant relationships.
Abbreviations:
- CNN
- convolutional neural network
- CSE
- chemical shift encoded
- HBP
- hepatobiliary phase
- LoA
- limits of agreement
- NAFLD
- nonalcoholic fatty liver disease
- PDFF
- proton density fat fraction
- SPGR
- spoiled gradient-recalled echo
- 3D
- three dimensional
- TE
- echo time
- 2D
- two dimensional
References
- 1.Kessler LG, Barnhart HX, Buckler AJ, et al. The emerging science of quantitative imaging biomarkers terminology and definitions for scientific studies and regulatory submissions. Stat Methods Med Res 2015;24(1):9–26. [DOI] [PubMed] [Google Scholar]
- 2.Summers RM. Progress in Fully automated abdominal CT interpretation. AJR Am J Roentgenol 2016;207(1):67–79. [DOI] [PMC free article] [PubMed] [Google Scholar]
- 3.Joo S, Yang YS, Moon WK, Kim HC. Computer-aided diagnosis of solid breast nodules: use of an artificial neural network based on multiple sonographic features. IEEE Trans Med Imaging 2004;23(10):1292–1300. [DOI] [PubMed] [Google Scholar]
- 4.Doi K. Computer-aided diagnosis in medical imaging: historical review, current status and future potential. Comput Med Imaging Graph 2007;31(4-5):198–211. [DOI] [PMC free article] [PubMed] [Google Scholar]
- 5.Farraher SW, Jara H, Chang KJ, Hou A, Soto JA. Liver and spleen volumetry with quantitative MR imaging and dual-space clustering segmentation. Radiology 2005;237(1):322–328. [DOI] [PubMed] [Google Scholar]
- 6.Suzuki K, Epstein ML, Kohlbrenner R, et al. Quantitative radiology: automated CT liver volumetry compared with interactive volumetry and manual volumetry. AJR Am J Roentgenol 2011;197(4):W706–W712. [DOI] [PMC free article] [PubMed] [Google Scholar]
- 7.Nakayama Y, Li Q, Katsuragawa S, et al. Automated hepatic volumetry for living related liver transplantation at multisection CT. Radiology 2006;240(3):743–748. [DOI] [PubMed] [Google Scholar]
- 8.Linguraru MG, Sandberg JK, Jones EC, Petrick N, Summers RM. Assessing hepatomegaly: automated volumetric analysis of the liver. Acad Radiol 2012;19(5):588–598. [DOI] [PMC free article] [PubMed] [Google Scholar]
- 9.Gloger O, Toennies K, Kuehn JP. Fully Automatic Liver Volumetry Using 3D Level Set Segmentation for Differentiated Liver Tissue Types in Multiple Contrast MR Datasets. In: Image Analysis [Internet]. Springer, Berlin, Heidelberg. p. 512-523. (Lecture Notes in Computer Science). https://link.springer.com/chapter/10.1007/978-3-642-21227-7_48. Published 2011. Accessed January 16, 2018. [Google Scholar]
- 10.Kallini JR, Gabr A, Salem R, Lewandowski RJ. Transarterial radioembolization with yttrium-90 for the treatment of hepatocellular carcinoma. Adv Ther 2016;33(5):699–714. [DOI] [PMC free article] [PubMed] [Google Scholar]
- 11.Berzigotti A, Abraldes JG, Tandon P, et al. Ultrasonographic evaluation of liver surface and transient elastography in clinically doubtful cirrhosis. J Hepatol 2010;52(6):846–853. [DOI] [PubMed] [Google Scholar]
- 12.Smith AD, Zand KA, Florez E, et al. Liver surface nodularity score allows prediction of cirrhosis decompensation and death. Radiology 2017;283(3):711–722. [DOI] [PubMed] [Google Scholar]
- 13.Yang D, Xu D, Zhou SK, et al. Automatic Liver Segmentation Using an Adversarial Image-to-Image Network. In: Medical Image Computing and Computer-Assisted Intervention − MICCAI 2017 [Internet]. Springer, Cham. p. 507-515. (Lecture Notes in Computer Science). https://link.springer.com/chapter/10.1007/978-3-319-66179-7_58. Published 2017. Accessed January 12, 2018. [Google Scholar]
- 14.Roth HR, Oda H, Hayashi Y, et al. Hierarchical 3D fully convolutional networks for multi-organ segmentation. arXiv:170406382 [cs] [preprint]. http://arxiv.org/abs/1704.06382. Posted April 20, 2017. Accessed January 6, 2018.
- 15.Chen X, Udupa JK, Bagci U, Zhuge Y, Yao J. Medical image segmentation by combining graph cuts and oriented active appearance models. IEEE Trans Image Process 2012;21(4):2035–2046. [DOI] [PMC free article] [PubMed] [Google Scholar]
- 16.Bereciartua A, Picon A, Galdran A, Iriondo P. 3D active surfaces for liver segmentation in multisequence MRI images. Comput Methods Programs Biomed 2016;132:149–160. [DOI] [PubMed] [Google Scholar]
- 17.Masoumi H, Behrad A, Pourmina MA, Roosta A. Automatic liver segmentation in MRI images using an iterative watershed algorithm and artificial neural network. Biomed Signal Process Control 2012;7(5):429–437. [Google Scholar]
- 18.Mohamed RG, Seada NA, Hamdy S, Mostafa MGM. Automatic liver segmentation from abdominal MRI images using active contours. Int J Comput Appl 2017;176(1):30–37. [Google Scholar]
- 19.Yan Z, Zhang S, Tan C, et al. Atlas-based liver segmentation and hepatic fat-fraction assessment for clinical trials. Comput Med Imaging Graph 2015;41:80–92. [DOI] [PubMed] [Google Scholar]
- 20.Gotra A, Sivakumaran L, Chartrand G, et al. Liver segmentation: indications, techniques and future directions. Insights Imaging 2017;8(4):377–392. [DOI] [PMC free article] [PubMed] [Google Scholar]
- 21.Heimann T, van Ginneken B, Styner MA, et al. Comparison and evaluation of methods for liver segmentation from CT datasets. IEEE Trans Med Imaging 2009;28(8):1251–1265. [DOI] [PubMed] [Google Scholar]
- 22.Yokoo T, Bydder M, Hamilton G, et al. Nonalcoholic fatty liver disease: diagnostic and fat-grading accuracy of low-flip-angle multiecho gradient-recalled-echo MR imaging at 1.5 T. Radiology 2009;251(1):67–76. [DOI] [PMC free article] [PubMed] [Google Scholar]
- 23.Kinner S, Reeder SB, Yokoo T. Quantitative imaging biomarkers of NAFLD. Dig Dis Sci 2016;61(5):1337–1347. [DOI] [PMC free article] [PubMed] [Google Scholar]
- 24.Elhawary H, Oguro S, Tuncali K, et al. Multimodality non-rigid image registration for planning, targeting and monitoring during CT-guided percutaneous liver tumor cryoablation. Acad Radiol 2010;17(11):1334–1344. [DOI] [PMC free article] [PubMed] [Google Scholar]
- 25.LeCun Y, Bengio Y, Hinton G. Deep learning. Nature 2015;521(7553):436–444. [DOI] [PubMed] [Google Scholar]
- 26.D’Onofrio M, De Robertis R, Demozzi E, Crosara S, Canestrini S, Pozzi Mucelli R. Liver volumetry: is imaging reliable? personal experience and review of the literature. World J Radiol 2014;6(4):62–71. [DOI] [PMC free article] [PubMed] [Google Scholar]
- 27.Lee J, Kim KW, Kim SY, et al. Feasibility of semiautomated MR volumetry using gadoxetic acid-enhanced MRI at hepatobiliary phase for living liver donors. Magn Reson Med 2014;72(3):640–645. [DOI] [PubMed] [Google Scholar]
- 28.Liu CY, McKenzie CA, Yu H, Brittain JH, Reeder SB. Fat quantification with IDEAL gradient echo imaging: correction of bias from T(1) and noise. Magn Reson Med 2007;58(2):354–364. [DOI] [PubMed] [Google Scholar]
- 29.Bydder M, Yokoo T, Hamilton G, et al. Relaxation effects in the quantification of fat using gradient echo imaging. Magn Reson Imaging 2008;26(3):347–359. [DOI] [PMC free article] [PubMed] [Google Scholar]
- 30.Reeder SB, McKenzie CA, Pineda AR, et al. Water-fat separation with IDEAL gradient-echo imaging. J Magn Reson Imaging 2007;25(3):644–652. [DOI] [PubMed] [Google Scholar]
- 31.Christ P, Ettlinger F, Schlecht S, et al. Liver Tumor Segmentation Challenge. http://www.lits-challenge.com/. Published 2017. Accessed August 2018. [Google Scholar]
- 32.Middleton MS, Heba ER, Hooker CA, et al. Agreement between magnetic resonance imaging proton density fat fraction measurements and pathologist-assigned steatosis grades of liver biopsies from adults with nonalcoholic steatohepatitis. Gastroenterology 2017;153(3):753–761. [DOI] [PMC free article] [PubMed] [Google Scholar]
- 33.Yushkevich PA, Piven J, Hazlett HC, et al. User-guided 3D active contour segmentation of anatomical structures: significantly improved efficiency and reliability. Neuroimage 2006;31(3):1116–1128. [DOI] [PubMed] [Google Scholar]
- 34.López-Mir F, Naranjo V, Angulo J, Alcañiz M, Luna L. Liver segmentation in MRI: a fully automatic method based on stochastic partitions. Comput Methods Programs Biomed 2014;114(1):11–28. [DOI] [PubMed] [Google Scholar]
- 35.Göçeri E. Fully automated liver segmentation using Sobolev gradient-based level set evolution. Int J Numer Methods Biomed Eng 2016;32(11):e02765. [DOI] [PubMed] [Google Scholar]
- 36.Campo CA, Hernando D, Schubert T, Bookwalter CA, Pay AJV, Reeder SB. Standardized approach for ROI-based measurements of proton density fat fraction and R2* in the liver. AJR Am J Roentgenol 2017;209(3):592–603. [DOI] [PMC free article] [PubMed] [Google Scholar]
- 37.Tang A, Chen J, Le TA, et al. Cross-sectional and longitudinal evaluation of liver volume and total liver fat burden in adults with nonalcoholic steatohepatitis. Abdom Imaging 2015;40(1):26–37. [DOI] [PMC free article] [PubMed] [Google Scholar]
- 38.Rohlfing T, Maurer CR Jr, O’Dell WG, Zhong J. Modeling liver motion and deformation during the respiratory cycle using intensity-based nonrigid registration of gated MR images. Med Phys 2004;31(3):427–432 . [DOI] [PubMed] [Google Scholar]
Associated Data
This section collects any data citations, data availability statements, or supplementary materials included in this article.


