Abstract
Background
Chronic otitis media (COM) is characterized by middle ear fluid predominantly containing cytokines, Nontypeable haemophilus influenzae (NTHi), the mucin MUC5B, and neutrophil extracellular traps (NETs). NETs consist of extracellular DNA coated with antibacterial proteins such as myeloperoxidase (MPO) and citrullinated histone 3 (CitH3). NETs can damage tissues and sustain inflammation. Our study aimed to develop an in vitro model of NETosis, testing COM inductors.
Methods
NETosis was evaluated in fresh blood human neutrophils attached to collagen‐coated plates and in suspension exposed to phorbol myristate acetate (PMA) as a control, and COM relevant mediators. Confocal microscopy, DNA fluorescence assay and flow cytometry were used to quantify NETosis.
Results
PMA exposure induced DNA, MPO, and CitH3 by immunofluorescence (IF) most significantly at 3 hours (3.8‐fold for DAPI, 7.6‐fold for MPO, and 6.9‐fold for CitH3, all P < .05). IL‐8 and TNF‐α cytokines showed milder increases of DAPI, MPO, and CitH3 positive cells. NTHi had no effect on these NETs markers. Purified salivary MUC5B (10 to 40 μg/mL) produced potent increases, comparable to PMA. A composite NET score summing the fold‐increases for DAPI, MPO, and CitH3 demonstrated PMA at 13.6 to 19 relative to control set at 1; and MUC5B at 8.6 to 16.3 (all P < .05). IL‐8 and TNF‐α showed scores of 5.4 and 3, respectively, but these were not statistically significant.
Conclusion
We developed a reliable in vitro assay for NETosis which demonstrated that salivary MUC5B is a potent inductor of NETs whereas IL‐8, TNF‐α, live and lyzed NTHi demonstrated minimal to no NETosis.
Level of evidence
NA.
Keywords: citrullinated histone, confocal microscopy, extracellular DNA, inflammation, innate immunity, middle ear infection, myeloperoxidase
1. INTRODUCTION
Otitis Media (OM) represents the leading cause of physician visits and antibiotic prescriptions in US children 1 with an estimated total US public health cost over two billion dollars per year. 2 At the age of 3, about 80% of children will have undergone at least one episode of acute OM. 3 Acute OM (AOM) is typically characterized by infected middle ear effusion (MEE) which can become either recurrent or chronic OM (COM). In most cases, COM MEEs are viscous and present a low bacterial count. This viscosity is mostly due to mucins secreted by remodeled middle ear epithelium.4, 5, 6
Previous studies from our group have shown that MUC5B is the predominant mucin in MEEs. 7 Neutrophil extracellular traps (NETs) have been shown to be a predominant innate immune component of MEEs from COM patients.8, 9, 10, 11 NETs are the result of an innate immune mechanism aiming at killing and immobilizing pathogens. 12 They are characterized by the partial decompaction of neutrophil DNA involving the citrullination of histones and the emission of filaments of DNA carrying antibacterial proteins (such as neutrophil elastase and myeloperoxidase) in the extracellular space. 13 NETs have been implicated in several inflammatory and autoimmune diseases such as cystic fibrosis, lupus, rheumatoid arthritis; and in cancer. 14 They are harmful to surrounding tissues if not cleared as they are a major source of proteases and other typically intracellular proteins such as histones implicated in endothelial cell death. 15
A recent study reported that salivary mucins are able to interact with neutrophils in the oral mucosa, 16 showing that saliva induces bactericidal and DNase resistant NETs. Given that MUC5B is highly abundant in saliva, this finding suggests MUC5B may influence NETosis directly. We have previously shown that NETs and MUC5B colocalize in MEEs. This led us to hypothesize that MUC5B may be a primary inductor of middle ear NETosis. In addition, it is unclear what other mediators present in MEEs could also influence NETosis in OM, such as IL‐8, at the high concentrations seen in patient samples, TNF‐α, and nontypeable Haemophilus influenzae (NTHi), the most prevalent AOM pathogen. In this study, we aimed at employing a reliable NET in vitro quantification assay, using multiple potential pathologically relevant COM mediators including mucin MUC5B, cytokines, and NTHi bacteria compared with phorbol myristate acetate (PMA), an organic pro‐inflammatory mediator of cellular oxidative stress, and a reliable positive control for NETosis in vitro. 17
2. MATERIAL AND METHODS
2.1. Isolation of peripheral blood neutrophils and treatments
Neutrophils from healthy adult donors were isolated from venous blood by gradient centrifugation using Lympholyte‐Poly (Cerdane) according to the manufacturer's protocol. Isolated neutrophils were reconstituted in RPMI medium (Thermo Fisher Scientific) and counted. Cells were incubated at 37°C and 5% CO2 and were exposed to different components for 30 minutes to 4 hours.
2.2. Live NTHi culture and NTHi lysates preparation
NTHi, clinical strain 12, was grown on chocolate agar at 37°C in 5% CO2 overnight and inoculated in brain heart infusion (BHI, BD Laboratories, Franklin Lakes, New York), broth supplemented with 10 mg of nicotinamide adenine dinucleotide per mL (Sigma‐Aldrich, Saint Louis, Michigan) as previously described. 18
2.3. Isolation of MUC5B from saliva by gel filtration chromatography
Saliva was collected from a single individual after three water rinses, and by chewing on parafilm, in a polypropylene test tube containing protease inhibitor cocktail (Sigma‐Aldrich) to reach 1X final concentration, and on ice. After collection of 15 mL, the tube was centrifuged for 10 minutes at 1000g at 4°C and the supernatant was stored at −20°C. A Sepharose CL‐4B column (245 or 241.5 cm3) was equilibrated and standardized before sample loading with a buffer containing ammonium acetate (NH4OAc) 0.15 M, beta‐mercaptoethanol 0.02 M and sodium dodecyl sulfate (SDS) 1%. The sample was carefully loaded onto the gel bed and chromatographed overnight with the same buffer and fractions of 3 mL were collected and tested for MUC5B protein presence. MUC5B positive fractions were pooled, dialyzed over 40 volumes of water for 4 days changing water twice a day. Samples were then lyophilized overnight, reconstituted in 0.15 M NH4OAc, 0.02 M beta‐mercaptoethanol and 1% SDS and further separated with on a pre‐equilibrated and pre‐standardized Sepharose CL‐2B column (261 cm3) with the buffer described before. MUC5B rich fractions were identified through western blot analysis. Mucin rich fractions from several batches were pooled and subjected to dialysis and lyophilization. A proteomic analysis was performed on the whole sample to confirm its purity.
2.4. Flow cytometry assay for neutrophil purity, NET and apoptosis detection
Neutrophils were isolated from whole blood of healthy adult donors, placed in 15 mL tubes at a concentration of 1 × 10⁵ cells per mL of RPMI1640 (Invitrogen, Carlsbad, California) to a total of 4 mL, treated 1 hour with PMA 20 nM‐40 nM (Sigma‐Aldrich, St. Louis, Missouri) at 37°C with gentle agitation or left untreated (negative control), then fixed with 4% paraformaldehyde (Sigma‐Aldrich). Cells were blocked for 15 minutes in 200 μL staining buffer containing 1% bovine serum albumin (Sigma‐Aldrich) in 1× Dulbecco's phosphate buffered saline (Life Technologies, Carlsbad, California) then incubated with anti‐myeloperoxidase antibody (ab25989; Abcam, Cambridge, Massachusetts) and anti‐Histone H3 antibody (citrulline R2 + R8 + R17, ab5103; Abcam) at 1:100 dilution for 30 minutes in the dark at 4°C, followed by a wash with staining buffer and centrifugation at 400g for 7 minutes. Samples were further incubated with 5 μL APC/Fire 750‐conjugated anti‐CD45 antibody (368 518; Biolegend, San Diego, California), 5 μL PE‐conjugated anti‐CD15 antibody (301 906; Biolegend), 1:200 Alexa Fluor488‐conjugated secondary antibody (A‐21202; Thermo Fisher Scientific, Waltham, Massachusetts) and 1:200 Alexa Fluor647‐conjugated secondary antibody (A‐31573; Thermo Fisher Scientific). Cells were washed and centrifuged at 400g for 7 minutes then resuspended in 0.5 mL staining buffer.
For apoptosis detection, neutrophils were exposed to staurosporine 1 μm (Sigma‐Aldrich) for 4 hours as a positive control, PMA 20 nM, or left untreated. Live cells were blocked with buffer containing 10 mM HEPES, 140 mM NaCl, 2.5 mM CaCl2 in dH2O, then incubated with Pacific Blue‐conjugated Annexin V (640 917; Biolegend). Cells were washed, centrifuged at 400 g for 7 minutes, and resuspended in 0.5 mL buffer containing 10 μL 7AAD (A1310; Thermo Fisher Scientific).
All samples were analyzed by flow‐cytometry with BD FACSCantoII (BD Biosciences, San Jose, California). Further analysis was performed using FlowJo (FlowJo LLC).
2.5. Quantification of coverslip attached NET markers
Neutrophils were incubated at 37°C and 5% CO2 for 1 hour on 12 well plates coated with rat collagen I over ice to prevent spontaneous activation (BD Bioscience; plates Corning; coverslips Thermo Fischer Scientific) and then exposed to potential NET mediators from 30 minutes to 4 hours. Automatic quantification of NETs was achieved using custom macros written for ImageJ (National Institutes of Health; macros available at http://sites.imagej.net/Ahussa44/macros/).
2.6. Quantification of NET extracellular DNA with Sytox green staining
Neutrophils were plated on a collagen coated 96 well plate, 100 000 cells per well, centrifuged 10 minutes at 400g at room temperature to enhance cell attachment. PMA, cytokines, NTHi lysates or live NTHi were used at the same concentrations described before to stimulate NET production for 3 hours, in RPMI medium (200 μL/well). After treatment, plates were centrifuged again 15 minutes at 500g to limit the loss of material, and the medium was carefully replaced with HBSS + Ca2+ + Mg2+. Micrococcal nuclease (ThermoScientific) was added at 50 U/well according to the manufacturer's recommendations, for 20 minutes at 37°C to separate extracellular DNA from nuclear DNA. The reaction was then stopped with 20 nM EGTA and the secretions (cleaved extracellular DNA) were transferred to a new plate. Sytox green (ThermoScientific) was added to the wells at the final concentration 150 nM for several minutes before reading the plate with a BioTek Synergy HT plate reader with excitation at 504 nm and emission at 523 nm (ThermoScientific).
2.7. Statistical analysis
Statistical comparisons between groups (control vs treatments) were performed with the GraphPad software using One‐way analysis of variance (ANOVA) followed by Dunnett tests, a P < .05 was considered statistically significant. All experiments shown were performed in biological triplicate.
3. RESULTS
3.1. Characterization of PMA induced NETosis by confocal microscopy
Fresh human neutrophils from adult donors were isolated with high purity (over 90% determined by flow cytometry as shown in Figure SS1), plated on collagen coated coverslips and treated as suggested in the literature to observe NETosis. 19
Neutrophils were first challenged with 10 to 40 nM PMA. DNA was visualized with 4′,6‐diamidino‐2‐phenylindole (DAPI) staining. MPO and CitH3 20 were stained with specific antibodies as described in Reference 21 and observed by confocal microscopy.
Figure 1 shows z‐stacks of imaged neutrophils (thickness of ~10 μm, 10 images) and the progressive apparition of the different markers analyzed with increasing PMA concentrations. Control neutrophils showed very small multilobed nuclei, positive for DAPI and MPO, but not CitH3. At the higher concentration of PMA, 40 nM, all neutrophils showed a bigger nucleus, with the presence of colocalized MPO and a higher proportion of nuclei positive for CitH3. Quantification of signal showed a dose response for DAPI pixels at 20 and 40 nM of PMA (2 to 2.5‐fold induction compared with control, all P < .05). Similarly, CitH3 pixel count increased from barely detectable in controls (17 px/HPF) up to 8200 px/HPF for PMA 40 nM (0.023) (Figure 2A). Similarly, MPO showed a statistically significant increase in signal at 40 nM (P = .0015).
FIGURE 1.
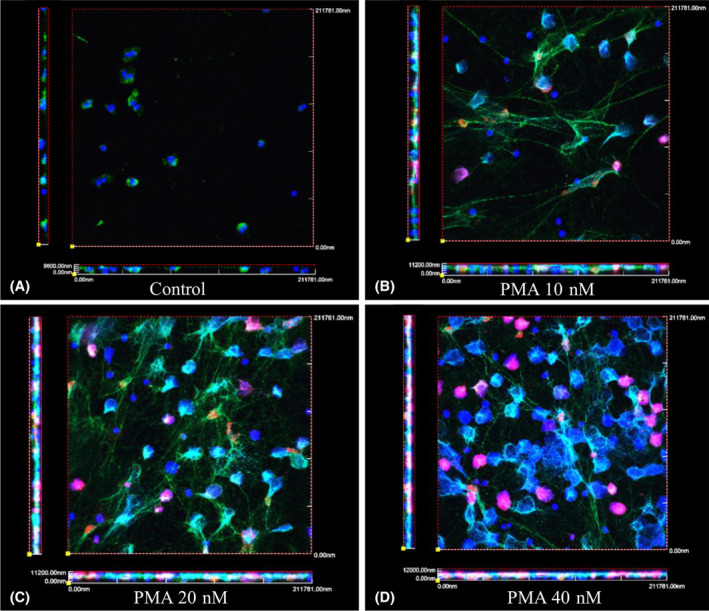
Characterization of PMA induced NETosis by DNA, MPO, CitH3 staining, and visualized by confocal microscopy. Purified neutrophils were incubated on collagen coated coverslips and untreated, A, treated with 10 nM, B, 20 nM, C, or 40 nM, D, of PMA for 3 hours. At the end of treatment, coverslips were fixed with PFA and stained for MPO and CitH3, and mounted with DAPI. Z‐stacks were taken (average of 10 sequential images of 1 μm each) and 3D views were generated with the FV1000 software. (DAPI‐blue, MPO‐green, and CiitH3‐red). Biologic triplicates were performed for each experiment
FIGURE 2.
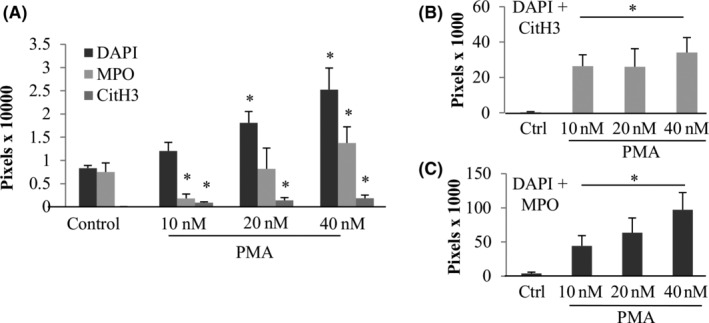
Quantification of markers of PMA induced NETosis. Z‐stacks mages were quantified using ImageJ and each marker was averaged, A. In addition, a colocalization macro was used to quantify colocalized pixels of DAPI+CitH3, B, and DAPI+MPO (C). *Statistically different from the untreated control P < .05. Error bars represent SD. Images include three separate experiments, each in triplicate
To further characterize NETosis we assayed for colocalization of markers (Figure 2B,C). DAPI and MPO colocalized pixels increased with higher concentrations of PMA from 4000 px for the control to 97100 px for PMA 40 nM (P = .0001). DAPI and CitH3 had a similar count of colocalized pixels among the different PMA concentrations whereas the control had none.
To confirm our model was specific for NETosis vs apoptosis (Figure SS2), we compared staurosporine 2 μm demonstrating apoptosis in 47.7% of cells by Annexin V+/7AAD‐flow cytometry results to PMA resulting in apoptosis only in 6.7% of cells, similar to untreated control neutrophils (7.8%).
3.2. Time and dose effect of PMA on NETosis
The time effect of PMA 20 nM (Figure 3) showed no increase of markers at 30 minutes but an induction of NETosis starting at 1 hour exposure. Statistically significant increases in normalized MPO pixel counts (expressed as fold induction of the untreated control) were observed at 2 hours (3.4‐fold, P = .0002) and 3 hours (7.6‐fold, P = .0046). Increases in DAPI signal (due to nuclear size and amount of extravasated DNA) was observed only at the 3‐hours time point (3.8‐fold, P = .0001). Given these results, experiments on coverslips assaying for NETosis after exposure to cytokines and MUC5B were focused on the 3 hour time point.
FIGURE 3.
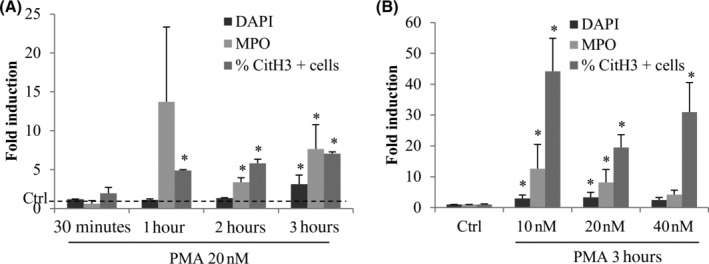
PMA induces NETosis depending on the time and concentration of exposure. Fresh purified neutrophils were exposed to PMA for different times (30 minutes, 1, 2, and 3 hours), A, at different concentrations (10, 20, and 40 nM), B. Six single images were taken on each slide and the three different markers were quantified with ImageJ. *Statistically different from the untreated control P < .05. Biological replicates (independent experiments): n = 3 for 30 minutes time point; n = 2 for 1 and 2 hours time points; n = 7 for 3 hours; n = 5 for the dose effect experiment. Error bars depict SD
In suspension, neutrophils were found to be more sensitive to PMA, and as such flow cytometry experiments were all performed with 1 hour exposure. A representative experiment is shown in Figure 4A for controls and 4B for PMA treatment as the scatter of cells (size and granularity, left panels) and MPO and CitH3 fluorescence intensity (with bars representing the threshold of positivity, right panels). The scatter showed a homogenous population of neutrophils for untreated controls, which changed with PMA treatment. Despite still having the presence of a similar population than controls, PMA increased the size and granularity of detected events, likely due to the changes in cell structure during NETosis. In addition, untreated controls showed a MPO + CitH3+ population of 8.4%, which increased to 18.4% with PMA treatment. Overall, PMA 20 nM was found to statistically induce the MPO + CitH3+ population 1.992‐fold compared to control (P = .006).
FIGURE 4.
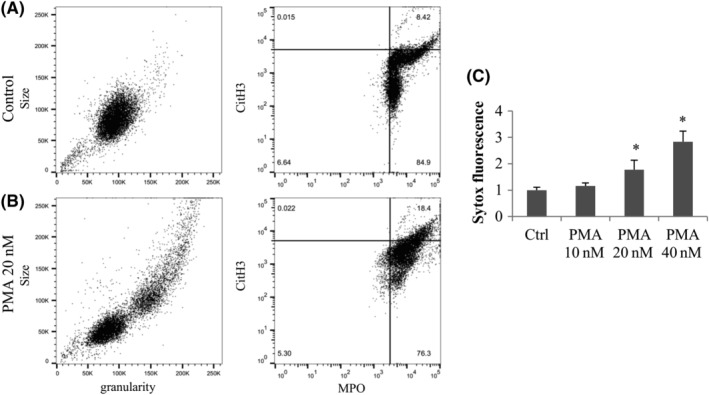
Characterization of PMA induced NETosis by flow cytometry and extracellular DNA assay. Fresh neutrophils were incubated 1 hour with or without PMA, and were fixed and stained with conjugated anti‐CD45 anti‐CD15 antibodies; and anti‐MPO and anti‐CitH3 antibodies followed by secondary antibodies. Cells were gated on the CD45 + CD15+ events and the scatter is shown (size and granularity graph left panel) and MPO in function of CitH3 fluorescence intensity (right panel). A, Untreated neutrophils. B, PMA 20 nM treated neutrophils. C, Attached neutrophils were exposed to 10 to 40 nM of PMA for 3 hours and the extracellular DNA was digested with Mnase, transferred to a new plate and stained with Sytox green. Results are expressed normalized to the control of each experiment and averaged (n = 3 independent experiments). *Statistically different from untreated control
Finally, we tested the effect of PMA on neutrophils with the Sytox green assay. Microccocal nuclease was added to distinguish extracellular from nuclear DNA (Figure 4C). An increase of Sytox green detection was observed for the PMA 20 and 40 nM concentrations (1.8‐fold and 2.8‐fold respectively, P = .04 and P = .002) compared with the controls. Notably, flow cytometry and extracellular Sytox DNA assays showed lower fold inductions than IF quantifications.
3.3. Effect of cytokines, NTHi, and MUC5B on NETosis
Concentrations of cytokines relevant to MEE amounts 9 of 10, 20, and 100 ng/mL for IL‐8 and 0.5, 1 and 5 ng/mL for TNF‐α (Figure 5A‐C) were used to assay for NETosis at 3 hours. These doses were extrapolated from what has been described as the average cytokine levels present in human middle ear effusions. 22 DAPI signal was increased only with IL‐8 20 ng/mL with a fold induction of 2.6 (P = .05) (Figure 5A) whereas MPO was induced at all concentrations of IL‐8 in an inversely dependent manner and with 1 ng/mL of TNF‐α (Figure 5B). CitH3 was statistically increased compared with untreated with all IL‐8 concentrations in a dose dependent manner (2.9‐fold for 10 ng/mL P = .001, 6.9‐fold for 20 ng/mL P = .03, and 8.9‐fold for 100 ng/mL P = .04, Figure 5C).
FIGURE 5.
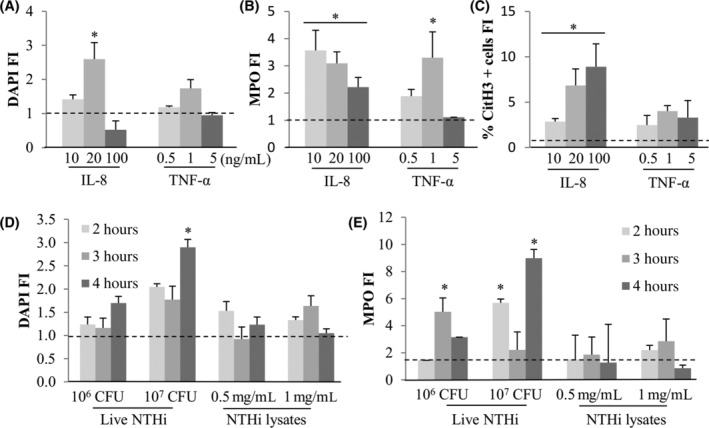
Cytokines (IL‐8 and TNF‐α) and NTHi (live or lysed) effect on NETosis. Fresh purified neutrophils were exposed to IL‐8 (10, 20, or 100 ng/mL) or TNF‐α (0.5, 1, or 5 ng/mL) for 3 hours. Six single images were taken on each slide and the three different markers were quantified with ImageJ for DAPI, A, MPO, B, and CitH3 positive cells, C. *Statistically different from the untreated control P < .05. Biological replicates (independent experiments): n = 4 for IL‐8 10 and 20 ng/mL; n = 2 for IL‐8100 ng/mL and TNF‐α 5 ng/mL; n = 3 for TNF‐α 0.5 ng/mL; n = 5 for TNF‐α 1 ng/mL. Purified neutrophils were also incubated 2 to 4 hours with or without live (106 and 107 CFU) or lysed (0.5 and 1 mg/mL) and DAPI, D, and MPO, E, markers were quantified as explained before. CitH3 fluorescence could not be quantified as NTHi treatments generated nonspecific fluorescence in this channel. *Statistically different from the untreated control P < .05
Neutrophils were also exposed for 1 to 4 hours to live NTHi at 106 or 107 CFU and NTHi lysates at 0.5 and 1 mg/mL (Figure 5D,E). A longer time of exposure (4 hours) was chosen as live NTHi proved to induce delayed effects in our lab (data not shown). No increase of cell death was observed in the control conditions for these experiments. While only live NTHi at 107 CFU increased DAPI signal at 4 hours with a fold induction of 2.9, NTHi 106 CFU showed a 5‐fold induction of MPO at 3 hours, and NTHi 107 CFU showed a significant increase in MPO signal at 2 and 4 hours of treatment (respectively 5.7‐fold P = .0001 and 9‐fold P = .0001). No effect was observed with NTHi lysates treatment on NETosis.
Using the Sytox green extracellular DNA staining, IL‐8100 ng/mL did not show any statistical difference compared to control whereas TNF‐α 5 ng/mL showed a statistical induction of 2.2 P = .001 (Figure 6A). Live NTHi similarly induced Sytox fluorescence (1.7‐fold and 1.6‐fold, respectively P = .03 and P = .02), but NTHi lysates had no effect. Flow cytometry showed no increase of MPO + CitH3+ population for any condition of cytokines and bacteria.
FIGURE 6.
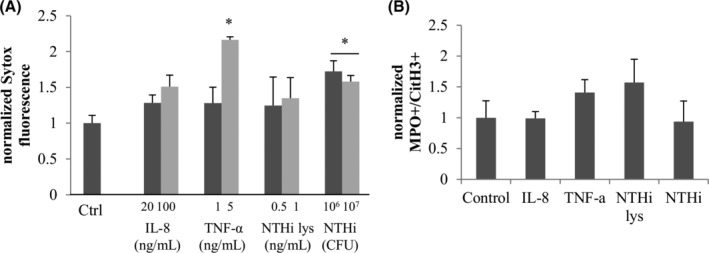
Extracellular DNA detection and flow cytometry analysis of cytokines and NTHi effect on NETosis. A, Treatments (PMA, IL‐8, TNF‐α, NTHi lysates, and live NTHi during 3 hours) were performed and the extracellular DNA was digested with Mnase and transferred to a new plate. Sytox green was then added to stain the DNA. B, Fresh neutrophils were incubated 1 hour in with or without inductor, fixed and stained with conjugated anti‐CD45 anti‐CD15 antibodies; and anti‐myeloperoxidase and anti‐Histone H3 citrullines antibody as well as secondary antibodies. Cells were gated on the CD45 + CD15+ events and results are showing the normalized MPO + CitH3+ population for each treatment. *Statistically different from the untreated control P < .05
Notably, due to amount of purified protein sample availability, MUC5B was used at concentrations lower than those described in airways (between 200 and 3000 μg/mL)23, 24, 25 and still showed a potent and statistically significant increase of all markers (DAPI and MPO, Figure 7A; CitH3 positive cells Figure 7B), at all concentrations tested 10, 20, and 40 μg/mL (P = .0001, P = .0001, and P = .0001, respectively) at 3 hours. The induction factors were similar or higher than PMA treatment, demonstrating a potent effect of MUC5B on NET induction. The higher effect observed with MUC5B 10 μg/mL was characterized by an induction of 5.9 for DAPI (P = .04), 17.9 for MPO (P = .04) and 25% for CitH3 positive cells (P = .02). Due to limited amount of purified MUC5B, we were unable to test its effect with Sytox green and flow cytometry.
FIGURE 7.
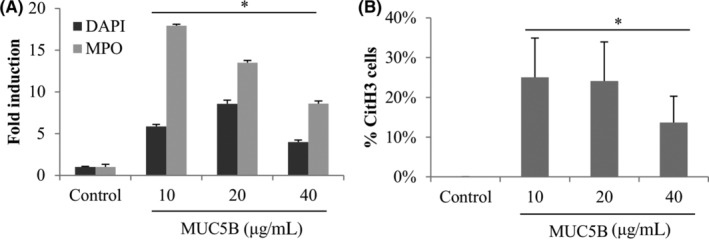
MUC5B effect on NETosis. Fresh purified neutrophils were exposed to purified salivary MUC5B at concentrations similar to airway secretions: 10, 20, or 40 μg/mL for 3 hours. Six single images were taken on each slide and the three different markers were quantified with ImageJ. *Statistically different from the untreated control P < .05
Finally, we used the IF data for DAPI, MPO, and CitH3 signal to calculate a NET score by summing induction of these factors for every sample (Table 1). As NTHi did not show CitH3 induction over background, it was excluded from this analysis. Setting the control as 1, 10 nM PMA showed the highest NET score of 19 (P = .001). PMA at 20 and 40 nM showed scores of 14.4 (P = .03) and 13.6 (P = .03), respectively. IL‐8 showed lower scores with 3.3 at 10 ng/mL (P = .02), and 5.4 (P = .03) at both 20 and 100 ng/mL. TNF‐α showed the lowest scores, between 2 and 3. Finally, MUC5B demonstrated scores close to PMA values: 16.3 for 10 μg/mL (P = .001), 15.4 with 20 μg/mL (P = .001) and 8.7 at 40 μg/mL (P = .001).
TABLE 1.
NETosis scores to compare the effect of different OM mediators
| Average | SE | n | P‐value | |
|---|---|---|---|---|
| Control | 1.00 | 0.00 | 11 | |
| PMA 10 nM | 19.00 | 3.73 | 5 | .001 |
| PMA 20 nM | 14.39 | 5.39 | 5 | .03 |
| PMA 40 nM | 13.56 | 4.04 | 5 | .03 |
| IL‐8 10 ng/mL | 3.27 | 0.89 | 4 | .02 |
| IL‐8 20 ng/mL | 5.44 | 2.63 | 4 | .03 |
| IL‐8100 ng/mL | 5.36 | 3.43 | 3 | .02 |
| TNF‐α 0.5 ng/mL | 2.31 | 1.17 | 3 | .21 |
| TNF‐α 1 ng/mL | 2.95 | 0.98 | 5 | .17 |
| TNF‐α 5 ng/mL | 2.20 | 1.23 | 3 | .56 |
| MUC5B 10 μg/mL | 16.27 | 1.52 | 6 | .001 |
| MUC5B 20 μg/mL | 15.39 | 1.59 | 6 | .001 |
| MUC5B 40 μg/mL | 8.75 | 1.24 | 6 | .001 |
Note: In order to compare conditions, a NETosis score was calculated as DAPI, MPO, and CitH3 IF staining intensity summed fold inductions for PMA, IL‐8, TNF‐α, and MUC5B treatments analyzed by confocal microscopy. Bold lines indicate P‐value <.05.
4. DISCUSSION
NETs are a predominant macromolecular component of COM fluids 9 but the mediators responsible for this neutrophilic response are mostly unknown. Our laboratory characterized the proteome of MEEs from COM patients and identified MUC5B as the predominant mucin as well as a panel of cytokines including IL‐8 and TNF‐α, and NTHi bacteria.7, 9, 26 In this article we present an assay for NETosis with the aim of testing the capability of individual MEE components of promoting in vitro NETosis. PMA was used as a positive chemical control to characterize the phenotype of NETs and to better understand the time of exposure necessary to observe detectable effects. Figures 1, 2, 3, 4 show the increase in cell nuclear size, the emission of extracellular DNA filaments, the binding of MPO on the DNA and the apparition of CitH3 with PMA treatment, being dependent on the time of exposure and the concentration used. Notably, using flow cytometry the effect on the markers studied was very mild (an induction of 1.992 of the population MPO+/CitH3+ with PMA). This is possibly because longer exposure times of neutrophils in suspension may have resulted in cell damage in untreated samples. In addition, the staining of neutrophils involves multiple washes and centrifugation steps that could cause the loss of NETs. Moreover, the flow cytometer detects single events, which could be challenging with a sample rich in extracellular DNA filaments. We chose to gate our analysis on CD45+ CD15+ events (neutrophils) to exclude any other cell type contaminating our samples, but it is likely that NETosis reduces the detection of these markers.
In this report, abundant middle ear mediators including IL‐8, TNF‐α, MUC5B, and NTHi (live or lysed) were used to challenge neutrophils and evaluate their ability to induce NETosis (Figures 5, 6, 7). In order to compare these conditions together, we used a NET score summing the normalized IF signal of DAPI, MPO, and CitH3 (Table 1). Interestingly, MUC5B was the most potent NETosis inductor with fold changes in comparable ranges to PMA, and both having decreasing scores with the increasing concentrations. In comparison, TNF‐α and IL‐8 showed minimal induction, however it should be noted that the lack of a dose response with the cytokines could indicate an issue regarding whether effects of cytokines could be better elicited within a narrower (and perhaps more representative of actual middle ear levels) dosing window. It should be noted that a limitation of our report is that for the experiments reported herein MUC5B was purified from a single donor's saliva. It is possible that variability in the MUC5B glycosylation pattern across individuals or disease states could alter its activity regarding induction of NETs. Live NTHi mildly induced NETosis whereas NTHi lysates did not have any effect (Figure 5). In contradiction with our results, Juneau et al 27 showed that NTHi was able to induce NETosis and evade their bactericidal effect. Although, they used a different strain than ours, also a relevant OM strain. The fact that we only used one clinical strain, different from the Juneau study, is a major limitation of this report in terms of measuring NTHi effects on NET formation. Notably, the last step of NTHi culture in our lab is performed without a supplemental iron source, despite the minimal presence of iron from colony transfer and the growth medium, in a relative low iron environment NTHi might express different proteins compared to iron rich conditions as suggested by Whitby et al in 2013, 28 and this may have potentially impacted NTHI effects. Another limitation is that our experiments were limited to short exposures because of neutrophil high reactivity when isolated, it is possible that a longer interaction between neutrophils and NTHi would lead to increasing NETosis. In terms of COME, the process may occur at a slower rate, where limitations related to sudden, spontaneous neutrophil activation due to in vitro neutrophil manipulation is not a factor. To this point, there is also some degree of variability in the NET assays, due to potential spontaneous NETosis (more likely to occur in early time points during plating) despite our best efforts to prevent this from occurring (collagen coating, plating on cooled plates over ice). Finally, our neutrophil isolation processes do not yield 100% purity, with flow cytometry demonstrating approximately 8% contamination from other white blood cell sources, as such this may have impacted variability in fixed neutrophil assays. In this report, we found the need to employ multiple experimental methods (fixed neutrophil assay and suspension assays) in order to validate findings—this was necessary due to the fickle and unstable nature of neutrophils once harvested; making in vitro experimentation challenging.
To our knowledge, this is the first report to show the potent effect of purified MUC5B on NETosis, similar to the chemical inductor PMA (Table 1). MUC5B was detected as the predominant mucin protein in COM fluids 7 and is postulated to not only have a role in the physical structure of the mucus but more recent studies demonstrate its biological effects. 29 Mohanty et al 16 showed saliva inducing NETosis in the oral cavity via the interaction between the glycan sialyl LewisX (potentially from MUC5B) and the neutrophil receptor L‐selectin. As such, it is possible that MUC5B glycosylation patterns could direct neutrophilic responses in the middle ear.
5. CONCLUSION
We created an in vitro model of NETosis evaluating several markers relevant to OM. MUC5B was found to be a potent NETosis inductor, similar to the PMA positive control, whereas IL‐8 and live NTHi were only mild inductors. TNF‐α and NTHi lysates showed very little to no effect on NETosis in our model. Further research evaluating treatment strategies to modulate this innate immune response may represent and attractive area for the development of novel COM therapies.
CONFLICT OF INTEREST
The authors declare that the research was conducted in the absence of any commercial or financial relationships that could be construed as a potential conflict of interest.
AUTHOR CONTRIBUTIONS
Stéphanie Val and Diego Preciado contributed to the conception and design of the study as well as writing the manuscript and performing the statistical analysis; Stéphanie Val, Anna Krueger, Arman Hussain, Amarel Tomney, Yajun Chen, and Christopher Lazarski performed experiments, interpreted data and wrote sections of the manuscript; all authors contributed to manuscript revision, read and approved the submitted version.
Supporting information
Figure S1. Neutrophil Isolation Purity for one Representative Experiment. Fresh neutrophils were incubated 1 hour with or without inductor, and were fixed and stained with APC/Fire 750‐conjugated anti‐CD45 antibody and PE‐conjugated anti‐CD15 antibody, and analyzed with a flow cytometer BD FACSCantoII and graphs were generated with the software FlowJo. A, shows the scatter SSC‐A (size) in function of FSC‐A (granularity); B, shows the CD45 and CD15 staining (CD45 immune cells marker, CD15 neutrophil marker).
Figure S2. Apoptosis assay for PMA treated neutrophils. Neutrophils were incubated 1 hour with or without PMA 20 nM (NETosis inductor) or Staurosporine 2 μm (apoptosis inductor). The cells were stained non‐fixed with 1AAD (extracellular DNA, negative during apoptosis) and Annexin V (showed extracellularly during apoptosis), and analyzed with a flow cytometer BD FACSCantoII and graphs were generated with the software FlowJo. Graphs show 7AAD in function of Annexin V staining. Apoptosis positive cells are considered 7AAD negative and Annexin V positive.
ACKNOWLEDGMENTS
We thank Dr Anamaris Colberg‐Poley and Dr Mary Rose for their advice all along this project.
Val S, Krueger A, Hussain A, et al. MUC5B induces in vitro neutrophil extracellular trap formation: Implication in otitis media. Laryngoscope Investigative Otolaryngology. 2020;5:536–545. 10.1002/lio2.396
Funding information District of Columbia Intellectual and Developmental Disabilities Research Center Award (DC‐IDDRC), Grant/Award Number: 1U54HD090257; National Institute on Deafness and Other Communication Disorders, Grant/Award Number: R01DC012377
REFERENCES
- 1. Klein JO. What's new in the diagnosis and management of otitis media? Pediatr Ann. 2002;31:777‐778. [DOI] [PubMed] [Google Scholar]
- 2. Ahmed S, Shapiro NL, Bhattacharyya N. Incremental health care utilization and costs for acute otitis media in children. Laryngoscope. 2013;124:301‐305. [DOI] [PubMed] [Google Scholar]
- 3. Vergison A, Dagan R, Arguedas A, et al. Otitis media and its consequences: beyond the earache. Lancet Infect Dis. 2010;10:195‐203. [DOI] [PubMed] [Google Scholar]
- 4. Lin J, Tsuboi Y, Rimell F, et al. Expression of mucins in mucoid otitis media. J Assoc Res Otolaryngol. 2003;4:384‐393. [DOI] [PMC free article] [PubMed] [Google Scholar]
- 5. Lin J, Tsuprun V, Kawano H, et al. Characterization of mucins in human middle ear and Eustachian tube. Am J Physiol Lung Cell Mol Physiol. 2001;280:L1157‐L1167. [DOI] [PubMed] [Google Scholar]
- 6. Tos M, Bak‐Pedersen K. Goblet cell population in the pathological middle ear and eustachian tube of children and adults. Ann Otol Rhinol Laryngol. 1977;86:209‐218. [DOI] [PubMed] [Google Scholar]
- 7. Preciado D, Goyal S, Rahimi M, et al. MUC5B is the predominant mucin glycoprotein in chronic otitis media fluid. Pediatr Res. 2010;68:231‐236. [DOI] [PMC free article] [PubMed] [Google Scholar]
- 8. Thornton RB, Wiertsema SP, Kirkham LA, et al. Neutrophil extracellular traps and bacterial biofilms in middle ear effusion of children with recurrent acute otitis media–a potential treatment target. PLoS ONE. 2013;8:e53837. [DOI] [PMC free article] [PubMed] [Google Scholar]
- 9. Val S, Poley M, Brown K, et al. Proteomic characterization of middle ear fluid confirms neutrophil extracellular traps as a predominant innate immune response in chronic otitis media. PLoS ONE. 2016;11:e0152865. [DOI] [PMC free article] [PubMed] [Google Scholar]
- 10. Juneau RA, Pang B, Weimer KE, Armbruster CE, Swords WE. Nontypeable haemophilus influenzae initiates formation of neutrophil extracellular traps. Infect Immun. 2010;79:431‐438. [DOI] [PMC free article] [PubMed] [Google Scholar]
- 11. Qureishi A, Lee Y, Belfield K, Birchall JP, Daniel M. Update on otitis media ‐ prevention and treatment. Infect Drug Resist. 2014;7:15‐24. [DOI] [PMC free article] [PubMed] [Google Scholar]
- 12. Farrera C, Fadeel B. Macrophage clearance of neutrophil extracellular traps is a silent process. J Immunol. 2013;191:2647‐2656. [DOI] [PubMed] [Google Scholar]
- 13. Brinkmann V, Reichard U, Goosmann C, et al. Neutrophil extracellular traps kill bacteria. Science. 2004;303:1532‐1535. [DOI] [PubMed] [Google Scholar]
- 14. Papayannopoulos V. Neutrophil extracellular traps in immunity and disease. Nat Rev Immunol. 2018;18:134‐147. [DOI] [PubMed] [Google Scholar]
- 15. Saffarzadeh M, Juenemann C, Queisser MA, et al. Neutrophil extracellular traps directly induce epithelial and endothelial cell death: a predominant role of histones. PLoS ONE. 2012;7:e32366. [DOI] [PMC free article] [PubMed] [Google Scholar]
- 16. Mohanty T, Sjogren J, Kahn F, et al. A novel mechanism for NETosis provides antimicrobial defense at the oral mucosa. Blood. 2015;126:2128‐2137. [DOI] [PubMed] [Google Scholar]
- 17. Hoppenbrouwers T, Autar ASA, Sultan AR, et al. In vitro induction of NETosis: comprehensive live imaging comparison and systematic review. PLoS ONE. 2017;12:e0176472. [DOI] [PMC free article] [PubMed] [Google Scholar]
- 18. Preciado D, Poley M, Tsai S, Tomney A, Brown K, Val S. A proteomic characterization of NTHi lysates. Int J Pediatr Otorhinolaryngol. 2016;80:8‐16. [DOI] [PMC free article] [PubMed] [Google Scholar]
- 19. de Buhr N, von Kockritz‐Blickwede M. How neutrophil extracellular traps become visible. J Immunol Res. 2016;2016:4604713. [DOI] [PMC free article] [PubMed] [Google Scholar]
- 20. Brinkmann V, Goosmann C, Kuhn LI, Zychlinsky A. Automatic quantification of in vitro NET formation. Front Immunol. 2012;3:413. [DOI] [PMC free article] [PubMed] [Google Scholar]
- 21. Brinkmann V, Laube B, Abu Abed U, Goosmann C, Zychlinsky A. Neutrophil extracellular traps: how to generate and visualize them. J Vis Exp. 2010;(36). pii: 1724. 10.3791/1724. [DOI] [PMC free article] [PubMed] [Google Scholar]
- 22. Zielnik‐Jurkiewicz B, Stankiewicz‐Szymczak W. Pro‐inflammatory interleukins in middle ear effusions from atopic and non‐atopic children with chronic otitis media with effusion. Eur Arch Otorhinolaryngol. 2015;273(6):1369‐1378. [DOI] [PubMed] [Google Scholar]
- 23. Rayment SA, Liu B, Offner GD, Oppenheim FG, Troxler RF. Salivary mucin: a factor in the lower prevalence of gastroesophageal reflux disease in African‐Americans? Am J Gastroenterol. 2000;95:3064‐3070. [DOI] [PubMed] [Google Scholar]
- 24. Fahy JV, Steiger DJ, Liu J, Basbaum CB, Finkbeiner WE, Boushey HA. Markers of mucus secretion and DNA levels in induced sputum from asthmatic and from healthy subjects. Am Rev Respir Dis. 1993;147:1132‐1137. [DOI] [PubMed] [Google Scholar]
- 25. Kesimer M, Ford AA, Ceppe A, et al. Airway mucin concentration as a marker of chronic bronchitis. N Engl J Med. 2017;377:911‐922. [DOI] [PMC free article] [PubMed] [Google Scholar]
- 26. Krueger A, Val S, Perez‐Losada M, et al. Relationship of the middle ear effusion microbiome to secretory mucin production in pediatric patients with chronic otitis media. Pediatr Infect Dis J. 2017;36:635‐640. [DOI] [PubMed] [Google Scholar]
- 27. Juneau RA, Pang B, Armbruster CE, Murrah KA, Perez AC, Swords WE. Peroxiredoxin‐glutaredoxin and catalase promote resistance of nontypeable Haemophilus influenzae 86‐028NP to oxidants and survival within neutrophil extracellular traps. Infect Immun. 2015;83:239‐246. [DOI] [PMC free article] [PubMed] [Google Scholar]
- 28. Whitby PW, VanWagoner TM, Seale TW, Morton DJ, Stull TL. Comparison of transcription of the Haemophilus influenzae iron/heme modulon genes in vitro and in vivo in the chinchilla middle ear. BMC Genomics. 2013;14:925. [DOI] [PMC free article] [PubMed] [Google Scholar]
- 29. Radicioni G, Cao R, Carpenter J, et al. The innate immune properties of airway mucosal surfaces are regulated by dynamic interactions between mucins and interacting proteins: the mucin interactome. Mucosal Immunol. 2016;9:1442‐1454. [DOI] [PMC free article] [PubMed] [Google Scholar]
Associated Data
This section collects any data citations, data availability statements, or supplementary materials included in this article.
Supplementary Materials
Figure S1. Neutrophil Isolation Purity for one Representative Experiment. Fresh neutrophils were incubated 1 hour with or without inductor, and were fixed and stained with APC/Fire 750‐conjugated anti‐CD45 antibody and PE‐conjugated anti‐CD15 antibody, and analyzed with a flow cytometer BD FACSCantoII and graphs were generated with the software FlowJo. A, shows the scatter SSC‐A (size) in function of FSC‐A (granularity); B, shows the CD45 and CD15 staining (CD45 immune cells marker, CD15 neutrophil marker).
Figure S2. Apoptosis assay for PMA treated neutrophils. Neutrophils were incubated 1 hour with or without PMA 20 nM (NETosis inductor) or Staurosporine 2 μm (apoptosis inductor). The cells were stained non‐fixed with 1AAD (extracellular DNA, negative during apoptosis) and Annexin V (showed extracellularly during apoptosis), and analyzed with a flow cytometer BD FACSCantoII and graphs were generated with the software FlowJo. Graphs show 7AAD in function of Annexin V staining. Apoptosis positive cells are considered 7AAD negative and Annexin V positive.


