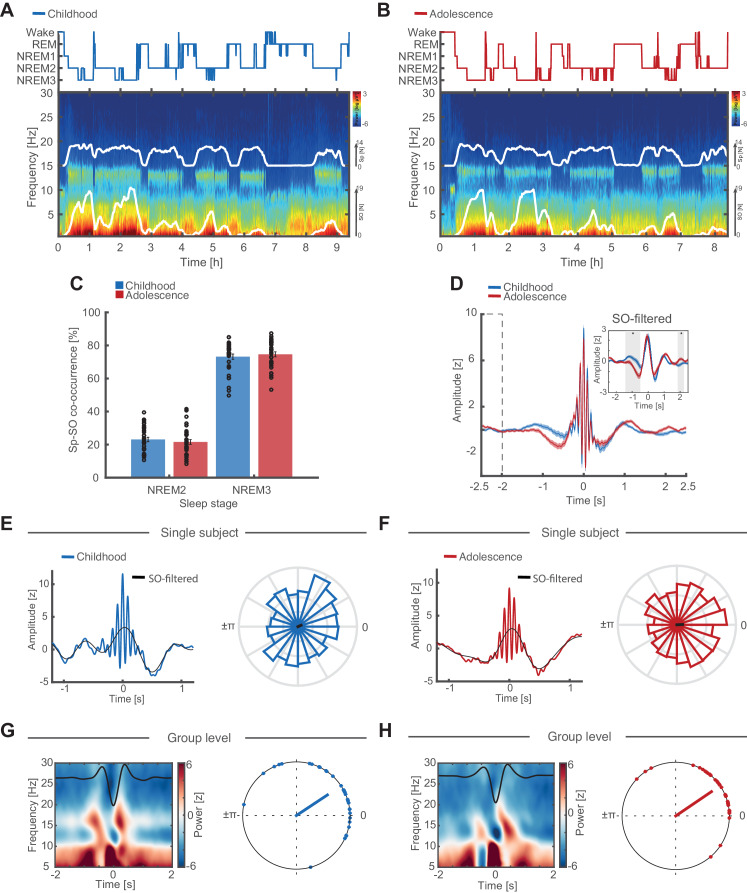
Figure 3. Individual features of discrete SO and sleep spindle events.
(A) Hypnogram (top) and full-night spectrogram (bottom) at electrode Cz of an exemplary subject during childhood. White lines in the spectrogram indicate the amount of events detected by the individually adjusted detection algorithms for sleep spindles (upper trace) and SO (lower trace). (B) Same conventions as in (A) but for the same individual during adolescence. (C) Spindle-SO co-occurrence expressed as the percentage of SO detections that coincide ±2.5 s with a sleep spindle detection at electrode Fz during NREM2 and NREM3 sleep during childhood (blue) and adolescence (red). Note the high co-occurrence of spindles and SOs during NREM3 at both recording time points. (D) Grand average of z-normalized sleep spindle events (mean ± SEM) during childhood (blue) and adolescence (red) at electrode Fz with the corresponding SO-low-pass filtered (<2 Hz) EEG-trace (inset). Note that there is no baseline difference between −2.5 s and −2 s (dashed box). The significant difference in the −1.5 to -0.5 s interval (grey shaded area, SO-filtered inset) indicates an increased amount of coupled SO-sleep spindle events during adolescence. Further note, no amplitude differences in the SO-filtered signal around the spindle peak at 0 s (i.e. time point of the phase readout). Grand average spindle frequency is distorted by the individually adjusted event detection criteria. (E) SO-spindle coupling features. Data are shown for electrode Fz during NREM3. Left: Exemplary spindle-locked average for a single subject during childhood with the corresponding SO-filtered signal in black. Note that the spindle amplitude peak coincides with the maximum peak in the SO-component. Right: Normalized phase histograms of spindle events relative to SO-phase of an exemplary subject during childhood. 0° denotes the positive peak whereas ±π denotes the negative peak of the SO. (F) Same conventions as in (E). Left: Exemplary spindle-locked average of the same single subject as in (E) during adolescence. Note the clearer outline of a SO-component compared to during childhood indicating a stronger SO-spindle coupling. Right: Normalized phase histograms of spindle events relative to SO-phase of same exemplary subject as in (E) during adolescence. Note the reduced spread in SO-phase. (G) Left: Grand average baseline-corrected (−2 to −1.5 s) SO-trough-locked time frequency representation (TFR). Schematic SO-component is superimposed in black. Note the alternating pattern within the spindle frequency range indicating a modulation of spindle activity by SO-phase. Right: Circular plot of preferred phase (SO phase at spindle amplitude maximum) per subject during childhood. Dots indicate the preferred phase per subject. The line direction shows the grand average preferred direction. The line length denotes the mean resultant vector (i.e. sample variance of preferred phase and therefore does not represent coupling strength). Note that most subjects show spindles coupled to or just after the positive SO-peak at 0°. Data are shown for electrode Fz during NREM3. (H) Same conventions as in (G). Left: SO-trough-locked TFR indicating a modulation in spindle activity depending on SO-phase. Right: Circular plot of preferred phase per subject during adolescence. Note that there are no preferred phase changes but an overall reduced spread in preferred phase on the group level during adolescence as indicated by a longer mean resultant vector (red line).
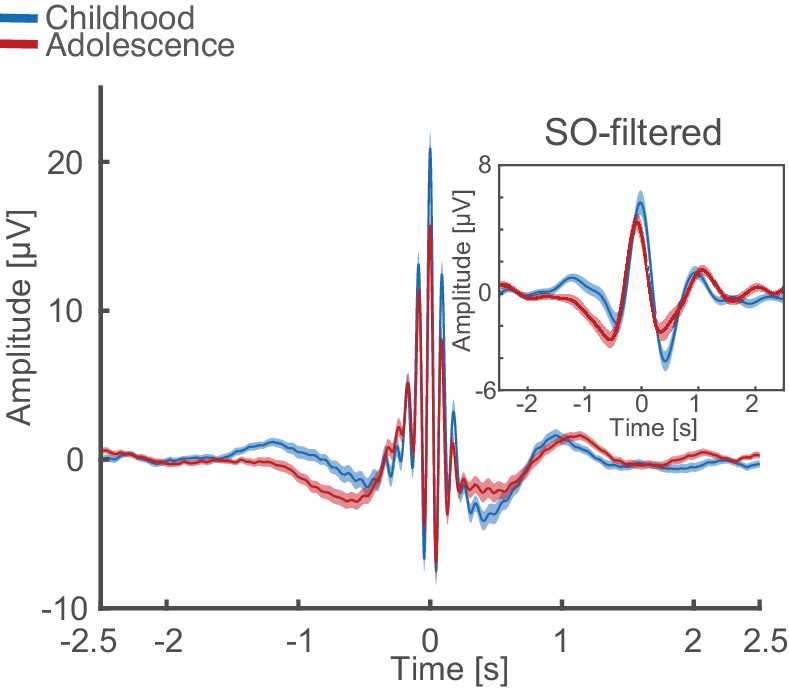
Figure 3—figure supplement 1. Uncorrected (non z-normalized) spindle-locked grand average during NREM3 at Cz for childhood (blue) and adolescence (red) with corresponding SO-filtered (<2 Hz) EEG-trace.


