eLife logoLink to eLife
. 2020 May 26;9:e52868. doi: 10.7554/eLife.52868

Nuclei determine the spatial origin of mitotic waves

Felix E Nolet 1,, Alexandra Vandervelde 1,, Arno Vanderbeke 1,2,, Liliana Piñeros 1,, Jeremy B Chang 3, Lendert Gelens 1,
Editors: Stefano Di Talia4, Naama Barkai5
PMCID: PMC7314552  PMID: 32452767

Abstract

Traveling waves play an essential role in coordinating mitosis over large distances, but what determines the spatial origin of mitotic waves remains unclear. Here, we show that such waves initiate at pacemakers, regions that oscillate faster than their surroundings. In cell-free extracts of Xenopus laevis eggs, we find that nuclei define such pacemakers by concentrating cell cycle regulators. In computational models of diffusively coupled oscillators that account for nuclear import, nuclear positioning determines the pacemaker location. Furthermore, we find that the spatial dimensions of the oscillatory medium change the nuclear positioning and strongly influence whether a pacemaker is more likely to be at a boundary or an internal region. Finally, we confirm experimentally that increasing the system width increases the proportion of pacemakers at the boundary. Our work provides insight into how nuclei and spatial system dimensions can control local concentrations of regulators and influence the emergent behavior of mitotic waves.

Research organism: Xenopus

Introduction

Traveling waves are often used in nature to transmit information quickly and reliably over large distances (Cross and Hohenberg, 1993; Tyson and Keener, 1988; Gelens et al., 2014; Beta and Kruse, 2017; Deneke and Di Talia, 2018). For example, action potentials are well known to propagate along the axon of a neuron (Hodgkin and Huxley, 1952), but a wealth of other biological processes have been shown to be coordinated via traveling waves (Winfree, 1987; Dawson et al., 1999; Loose et al., 2008; Chang and Ferrell, 2013; Deneke et al., 2016; Prindle et al., 2015; Bement et al., 2015; Fukujin et al., 2016). In particular, cell cycle oscillations also self-organize via mitotic waves in a spatially extended system (Chang and Ferrell, 2013; Deneke et al., 2016). Such waves that coordinate cell division in space are especially relevant in the large developing eggs (ranging from ≈100 µm to ≈1 mm in diameter) that are laid externally by insects, amphibians, and fish, because they are too large to be synchronized by diffusion alone (see Box 1). While several studies have addressed the potential biochemical mechanisms of mitotic waves (Chang and Ferrell, 2013; Deneke et al., 2016; Vergassola et al., 2018), what determines the spatial origin of mitotic waves remains unclear.

Box 1.

Spatial cell cycle coordination in early frog and fly embryos.

Box 1—figure 1. Spatial cell cycle coordination in early frog and fly embryos.

Box 1—figure 1.

Insects, amphibians, and fish lay their eggs externally. After fertilization, all of these organisms need to go from a single, large cell to several thousands of somatic-sized cells that then further develop into an adult animal. They do so by carrying out multiple rounds of rapid cleavages following fertilization (Foe and Alberts, 1983; Olivier et al., 2010; Farrell and O'Farrell, 2014; Anderson et al., 2017). While in the Xenopus laevis frog embryo a new cell membrane is formed around each nucleus (green dots in figure), this is not the case in the Drosophila fly embryo, leading to a multinucleated syncytium. Due to the large size of these embryos, diffusion is not fast enough to spatially coordinate the cell cycle (Gelens et al., 2014; Deneke and Di Talia, 2018). There is thus a need for an alternative mechanism to coordinate cell cycle processes over large distances. Mitotic waves have been observed in the shared cytoplasm of large Xenopus cells (Chang and Ferrell, 2013) and the syncytium of the Drosophila embryo (Deneke et al., 2016; Vergassola et al., 2018). Such wave-like propagation of the mitotic state is believed to help spatially coordinate cell cycle progression, yet the spatial origin of this mitotic wave remains unclear.

Here, we address this open question using cell-free extracts made from eggs of the frog Xenopus laevis, which exhibit biochemical cell cycle oscillations in vitro that are similar to those found in vivo (Murray, 1991). We find that mitotic waves originate at nuclei, which act as so-called pacemakers, regions that oscillate faster than their surroundings (Kuramoto, 1984). While previous studies have suggested centrosomes or nuclei to serve as pacemakers (Chang and Ferrell, 2013; Ishihara et al., 2014), their role in organizing mitotic waves has not been empirically demonstrated. We provide evidence that nuclei serve as pacemakers, both in the absence and presence of centrosomes. Having the nucleus setting the pace of the cell cycle may help ensure proper DNA replication prior to initiation of mitosis. If the pacemaker were elsewhere, the decision to divide might be decoupled from DNA replication, leading to division occurring before DNA replication completes. We postulate that nuclei can concentrate cell cycle regulators, leading to faster cell cycle oscillations at those nuclear locations. Nuclei and their spatial positioning, which is affected by the spatial dimensions of the system, determine how the cell cycle is coordinated in space and time.

By monitoring mitotic waves in Teflon tubes using time-lapse microscopy (see Box 2), we find that pacemakers are often located near nuclei that are brighter due to increased import of exogeneously added GFP-NLS. We show that the generation of such pacemakers does not require centrosomes and explore the influence of nuclear density and nuclear import strength on cell cycle period and pacemaker wave formation. Based on these observations, we then develop a theoretical model where nuclei play an active role in concentrating cell cycle regulators. This concentration decreases the period of oscillation around the nuclei. Our modeling shows that the distribution of regulators depends on the nuclear positioning and spatial dimensions of the system, with thicker tubes having a larger tendency to concentrate cell cycle regulators at the boundaries (i.e. outer edges of the tube). Using both numerical simulations and experiments, we go on to show that mitotic waves can originate from the system interior or from the system boundary, depending on the spatial dimensions of the system. These observed dynamics are the result of competition between waves originating from different pacemaker regions, where the relative strength of the pacemakers in the interior and at the boundary is determined by the system dimensions.

Box 2.

Reconstituting cell cycle oscillations using cell-free extracts.

Box 2—figure 1. Reconstituting cell cycle oscillations using cell-free extracts.

Box 2—figure 1.

Cell-free cycling extracts can be made from thousands of unfertilized Xenopus laevis frog eggs, following the protocol by Murray, 1991. Cycling extracts can be supplemented with green fluorescent protein with a nuclear localization signal (GFP-NLS) and demembranated sperm nuclei. We load them in Teflon tubes of varying diameters, and image them with a confocal microscope. Under these conditions biochemical oscillations persist and drive the spontaneous formation of nuclei in the extract. Such cell cycle oscillations can be observed by the fluorescent nuclei (importing GFP-NLS) that periodically appear (interphase) and disappear (mitotic phase). Similar oscillations can be observed in bright-field and/or by using fluorescently labeled microtubules (HiLyte Fluor 488).

Results

Nuclei serve as pacemakers to organize mitotic waves

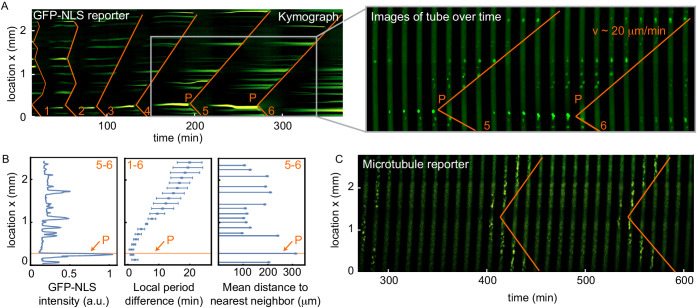
We reconstituted mitotic waves in vitro according to Chang and Ferrell (Chang and Ferrell, 2013; Chang and Ferrell, 2018). We loaded cycling extracts in a 100 µm wide Teflon tube and used green fluorescent protein with a nuclear localization signal (GFP-NLS) to image mitotic waves (see Box 2). This approach allows visualization of regular oscillations between interphase and mitotic phase. In interphase, nuclei form spontaneously in the extract supplemented with sperm chromatin. These nuclei then import GFP-NLS. In mitosis, the nuclear envelope breaks down and GFP is no longer localized to nuclei. Mitotic waves can be observed by the disappearance of nuclei in a wave-like fashion. Waves become apparent after a couple of cell cycles and they self-organize so that they emerge from more clearly defined foci (see Figure 1A, Figure 1—video 1). The origin of the wave (point P) was determined as the intersection of straight lines drawn through the points where the nuclei disappear (see orange curve and Figure 1—figure supplement 1). The wave at cell cycle 5–6 was found to propagate with a speed of ∼ 20 µm/min.

Figure 1. Nuclei serve as pacemakers to organize mitotic waves.

(A) Mitotic waves (orange) in a kymograph of cell-free extract experiment in a 100 µm Teflon tube. Wave dynamics are shown for cell cycle 1–6. For each time point we reduced the data from two to one spatial dimension by plotting the maximal GFP-NLS intensity along the transverse section of the tube. In the zoom, indicated by the gray box, we show snapshots of the whole 100 µm wide tube for different time points. The pacemaker location in cell cycle six is indicated by P. Approx. 250 nuclei/µl are added. (B) Analysis for the experiment in A. Left: GFP-NLS intensity profile, averaged over the times between the mitotic waves in cell cycle 5 and 6. The GFP-NLS intensity is highest close to the pacemaker region P. Middle: Difference in cell cycle period (with respect to the fastest period) at different locations along the tube, averaged over cell cycle 1–6, showing that the pacemaker region oscillates fastest. Right: Mean distance from the center of each nucleus to its two nearest neighboring nuclei. The nucleus close to the pacemaker region P is most separated from its neighbors. (C) Mitotic waves in a 200 µm Teflon tube shown by a fluorescent microtubule reporter (HiLyte Fluor 488).

Figure 1.

Figure 1—figure supplement 1. Methodology of image analysis of the experiments.

Figure 1—figure supplement 1.

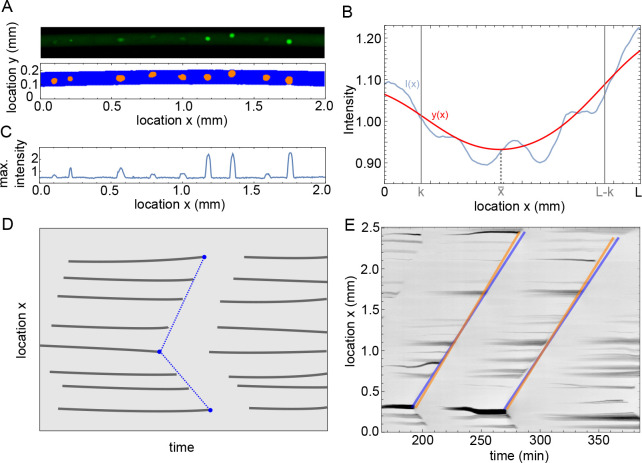
(A) Example of microscope image (top) and binarized image from ilastik (bottom), with in blue pixels recognized as background and orange the nuclei. (B) Intensity profile I(x) in blue and the filtered profile y(x) in red. The domain width is equal to L and the parameter k determines the boundary domain. (C) Maximum intensity over y as function of x, calculated for the microscope image in A. (D) Sketch of analysis of mitotic waves in a kymograph. At every time a profile is calculated as in C, when this is plotted over time the appearance and disappearance of nuclei is visible. The disappearance of nuclei is manually detected by visual inspection, as indictated by the blue points. Our program then automatically draws lines between these points, representing the mitotic waves, and calculates periods and wave speeds. (E) Example of the methodology sketched out in panel D for actual data, showing two (parts of) mitotic waves. The orange and blue lines illustrate errors that could be made visually, but they lead to relatively small differences in estimated period and wave speed (up to 1 min difference in estimated period and up to 2 µm/min difference in estimated wave speed).
Figure 1—figure supplement 2. Analysis of the experiment in panel A, quantifying the time evolution of the number of nuclei, the nuclear size, the internuclear distance, the oscillation period, the intensity of the nuclei, and the observed wave speed.

Figure 1—figure supplement 2.

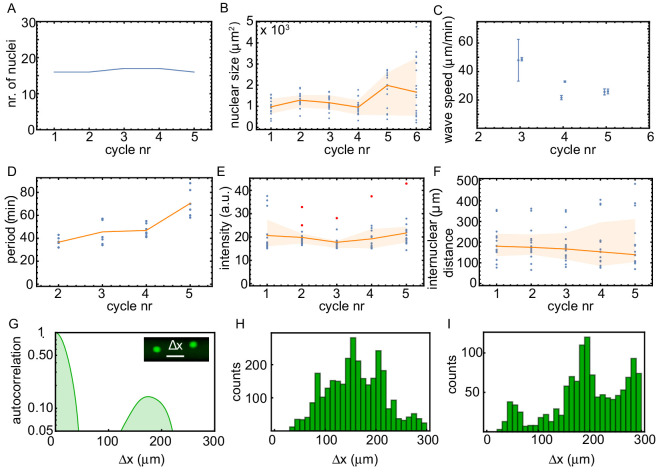
Analysis of the experiment shown in Figure 1. We plotted as function of the cycle number: the number of nuclei (A), the nuclear size (B), the observed wave speed (C), the period of the oscillation (D), the intensity of the nuclei (E), and the internuclear distance (F). Blue is individual data, orange lines give the median and the orange area is the 2/3 σ-interval. Red dots in (E) highlight the nuclei that are pacemakers. The internuclear distance is further analyzed in panels G and H, showing the averaged autocorrelation of projected binarized images (G) and a histogram of the distances between nuclei for all binarized images (H). Both analyses of the nuclear distribution show that the distance between neighboring nuclei is typically around 150 µm. (I) shows the same analysis as in (H), but now for an experiment in a 100 µm Teflon tube for ≈ 60 added sperm nuclei/µl.
Figure 1—figure supplement 3. Analysis of the spatial GFP-NLS intensity profile and the internuclear distances for multiple experiments.

Figure 1—figure supplement 3.

Kymographs of the GFP-NLS intensity for eight additional experiments in tubes of 100 and 200 µm, with a corresponding analysis of the spatial GFP-NLS intensity profile and the internuclear distances. The dots on the kymographs indicate the location of the pacemakers for two consecutive cell cycles indicated in blue and orange.
Figure 1—figure supplement 4. Analysis of the spatial GFP-NLS and Hoechst intensity profile and the internuclear distances.

Figure 1—figure supplement 4.

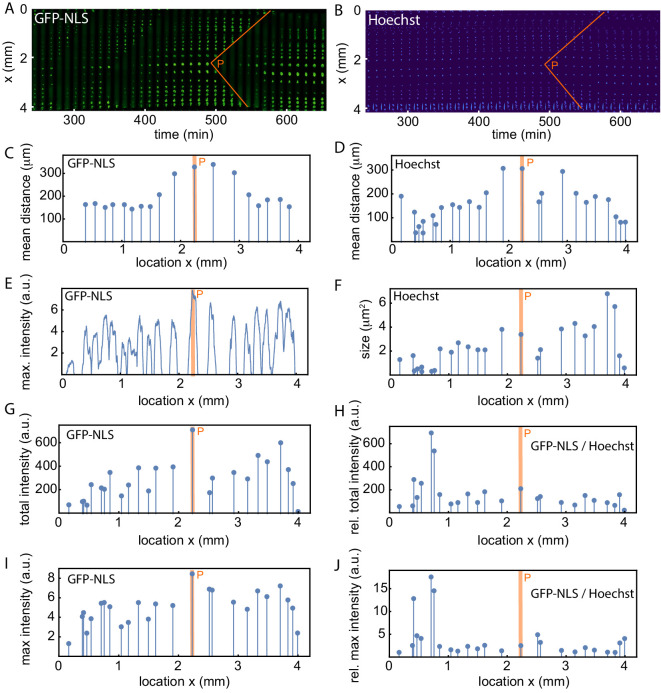
(A) Mitotic waves (orange) in a kymograph of cell-free extract experiment in a 200 µm Teflon tube, using the GFP-NLS reporter. (B) Same as A, but using DNA staining (Hoechst 33342). C-J show an analysis of the experiment in A-B. (C,D) Mean distance from the center of each nucleus to its two nearest neighboring nuclei using the GFP-NLS and the Hoechst signal, respectively. (E) GFP-NLS intensity profile, averaged over the times between two mitotic waves. (F) Nuclear size in a single cell cycle determined from the Hoechst signal. G. Total GFP-NLS intensity per nucleus in a single cell cycle. (I) Maximal GFP-NLS intensity per nucleus in a single cell cycle. (H, J) Total and maximal GFP-NLS intensity per nucleus normalized by the nuclear size in a single cell cycle.
Figure 1—video 1. Video of the cell-free extract experiment in panel A, B.
Download video file (691.6KB, mp4)
8.86 hr of experiment in 484 frames, scale bar is 200 µm.
Figure 1—video 2. Video of the cell-free extract experiment in panel C.
Download video file (918.3KB, mp4)
15.68 hr of experiment in 79 frames, scale bar is 200 µm.

We noticed that the mitotic wave originated close to a nucleus that is considerably brighter than the surrounding nuclei (Figure 1A). We hypothesized that a region with higher GFP-NLS intensity correlates with a higher local oscillation frequency, serving as a pacemaker that organizes the mitotic wave. We therefore analyzed the spatial GFP-NLS intensity profile, the spatial profile of cell cycle periods, and the internuclear distance (Figure 1B). As a brighter nucleus has taken up more GFP-NLS, we reasoned that it similarly concentrates cell cycle regulators that lead to a local increase in the cell cycle frequency. We directly correlated this with the local period, which indeed showed that this region oscillated faster (Figure 1B). To further understand why certain nuclei were brighter, we explored whether their environment had any particular characteristics. We characterized the distance between the different nuclei and found that they were typically separated by 150–200 µm (Figure 1—figure supplement 2). However, we found that the brightest nucleus is also most separated from its neighboring nuclei (Figure 1B). This finding is consistent with the idea that nuclei increase their oscillation frequency by concentrating cell cycle regulators, as they have a larger pool of regulators in their surroundings to import. We analyzed the spatial GFP-NLS intensity profile and the internuclear distance for nine other experiments where we could clearly identify nuclei and mitotic waves. Overall, in 90% of the analyzed experiments the pacemaker location was well predicted by the region with the highest GFP-NLS intensity and/or the region where nuclei were most separated from their neighboring nuclei (Figure 1A,B, Figure 1—figure supplement 3, Figure 1—figure supplement 4). The total nuclear GFP-NLS intensity was also found to be a better indicator of the pacemaker location than the nuclear size as indicated by Hoechst staining, or than the GFP-NLS intensity normalized to the Hoechst signal (Figure 1—figure supplement 4).

In order to further test the role of nuclei as pacemakers, we explored alternative markers of mitotic entry that do not rely on the nuclei themselves. We repeated the experiment with a microtubule reporter, using fluorescently labeled tubulin (HiLyte Fluor 488). Figure 1C and Figure 1—video 2 show that mitotic waves are also observed using such a microtubule reporter, as well as in bright-field. With these tools in hand, we set out to test how critical system parameters such as nuclear density and nuclear import strength influence the mitotic wave dynamics.

Nuclear density and nuclear import strength control cell cycle period and mitotic wave speed

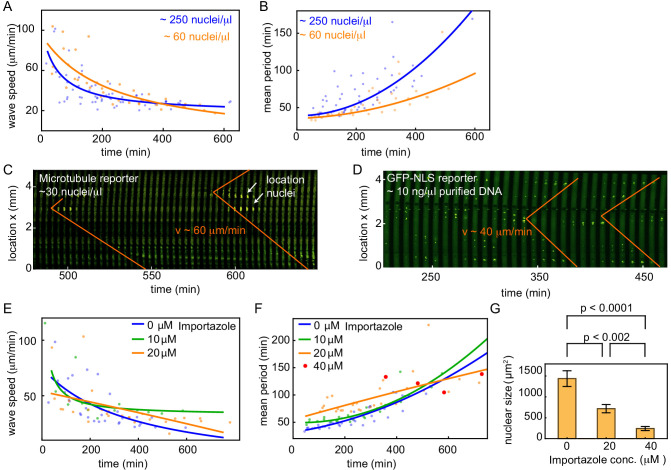
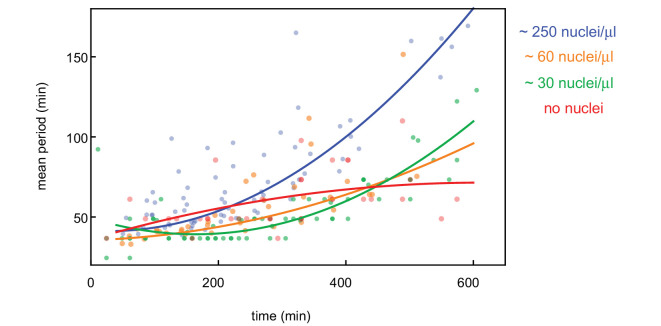
We repeated the experiment in tubes of 100 and 200 µm width for two different concentrations of added demembranated sperm nuclei (approx. 60 and 250 nuclei/µl) (Figure 2A,B). We found that extracts with less added sperm nuclei had a faster cell cycle (Figure 2B). Mitotic waves were similarly observed, but the wave speeds were initially faster than in tubes with a higher nuclear density (Figure 2A). The waves then slowed down to similar speeds as in the case with the higher concentration of sperm nuclei. For both nuclear densities we also found that the average cell cycle period increases over time (Figure 2B). Such a correlation of mitotic wave speed with cell cycle duration is consistent with a transition from sweep waves to trigger waves as the cell cycle slows down (Vergassola et al., 2018). An increase in cell cycle period has been linked to a decrease in ATP supply over time (Guan et al., 2018). An additional explanation could be that an increase in cell cycle period is related to increasing levels of DNA as it is replicated (Dasso and Newport, 1990). This would also explain the decreasing period when reducing the concentration of added sperm nuclei.

Figure 2. Nuclear density and nuclear import strength control cell cycle period and mitotic wave speed.

(A,B) Wave speed (A) and cell cycle period (B) over time obtained for N = 19 analyzed 100 and 200 µm Teflon tube experiments using the GFP-NLS reporter. Results are pooled from 11 different cell-free extracts for two different nuclear concentrations: ≈ 60, and ≈ 250 nuclei/µl. Each plotted point corresponds to the minimal wave speed or average cell cycle period in a single cell cycle of a single tube experiment. (C) Mitotic waves in a 200 µm Teflon tube using a GFP-MT reporter with few nuclei (≈ 30 nuclei/µl). Nuclear locations are identified in bright-field and indicated here. (D) Mitotic waves in a 200 µm Teflon tube using a GFP-NLS reporter with ≈ 10 ng/µl of added purified DNA. (E,F) Wave speed (E) and cell cycle period (F) over time obtained for N = 16 analyzed 200 µm Teflon tube experiments using the GFP-NLS reporter. Results are pooled from two different cell-free extracts for four different concentrations of the nuclear import inhibitor importazole: 0, 10, 20, 40 µM. Nuclear concentration: ≈ 250 nuclei/µl. Each plotted point corresponds to the minimal wave speed or average cell cycle period in a single cell cycle of a single tube experiment. (G) Mean nuclear size in the presence of varying concentrations of the nuclear import inhibitor importazole: 0, 20, 40 µM. Two tube experiments were analyzed per condition, which gave us nuclear sizes for 75, 62, and 25 nuclei, for 0, 20, 40 µM importazole, respectively. Error bars are one standard deviation of the mean.

Figure 2.

Figure 2—figure supplement 1. Influence of nuclear density on cell cycle period.

Figure 2—figure supplement 1.

Cell cycle period over time obtained for N = 27 analyzed 100 and 200 µm Teflon tube experiments using the GFP-NLS reporter. Results are pooled from 14 different cell-free extracts for four different nuclear concentrations: 0, ≈ 30, ≈ 60, and ≈ 250 nuclei/µl. Each plotted point corresponds to the minimal wave speed or average cell cycle period in a single cell cycle of a single tube experiment. Note that for 0, ≈ 30 nuclei/µl, cell cycle periods could not be calculated as explained in the Image Analysis section due to the lack of nuclei with a GFP-NLS signal. Instead, they have been determined manually by looking at periodic variations in the microtubule reporter at different locations in the tube.
Figure 2—figure supplement 2. Influence of Eg5 kinesin inhibitor on wave speed and cell cycle period.

Figure 2—figure supplement 2.

Wave speed (A) and cell cycle period (B) over time obtained for N = 17 analyzed 200 µm Teflon tube experiments using the GFP-NLS reporter. Results are pooled from three different cell-free extracts for three different concentrations of the Eg5 kinesin inhibitor STLC: 0, 10, 20 µM. Nuclear concentration: ≈ 250 nuclei/µl. Each plotted point corresponds to the minimal wave speed or average cell cycle period in a single cell cycle of a single tube experiment. .
Figure 2—video 1. Video of the cell-free extract experiment in panel D.
Download video file (2.4MB, mp4)
Mitotic waves in a 200 µm wide Teflon tube using a GFP-NLS reporter with ≈ 10 ng/µl of added purified DNA. 14.96 hr of experiment in 94 frames, scale bar is 200 µm.
Figure 2—video 2. Video of the cell-free extract experiment in panels E-G.
Download video file (850.4KB, mp4)
Mitotic waves in a 200 µm wide Teflon tube using a GFP-NLS reporter with 40 µM nuclear import inhibitor importazole. Nuclear concentration: ≈ 250 nuclei/µl. 19.49 hr of experiment in 189 frames, scale bar is 200 µm.

Interestingly, a decrease in nuclear density did not lead to a big change in the internuclear distance (Figure 1—figure supplement 2I). Instead, it created more and larger regions where nuclei were absent (Figure 1—figure supplement 3), and pacemakers were predominantly found close to these regions (Figure 1—figure supplement 3). Cheng and Ferrell observed a similar transition from a regular pattern of equidistantly spaced nuclei to a system with holes in Xenopus interphase egg extracts when decreasing the concentration of added sperm nuclei (Cheng and Ferrell, 2019). Next, we further decreased the nuclear density (approx. 30 nuclei/µl), such that only few nuclei remained in an entire tube. Here, we used the fluorescent microtubule reporter to visualize the spatial coordination of mitotic entry, while bright-field images were used to track the location of nuclei (Video 1). Mitotic waves were found to originate at the few nuclei present in the tube, and they traveled through the whole tube (several mm) at a speed of approx. 60 µm/min (Video 1, Figure 2C). In the absence of any nuclei in the tube (no added demembranated sperm nuclei), we still observed cell cycle oscillations with periods similar to extracts with low concentrations of demembranated sperm nuclei (Figure 2—figure supplement 1). However, no mitotic waves were observed (Video 1). These experiments underscore the critical role that nuclei play in changing the cell cycle period and organizing mitotic waves.

Video 1. Video of cell-free extract experiment in a 200 µm wide Teflon tube imaged in bright-field and using a fluorescent microtubule reporter (HiLyte Fluor 488). The experiment on the bottom (see also Figure 1C) has few nuclei (≈ 30 nuclei/µl), while no nuclei are added in the experiment on the top. In the presence of few nuclei, mitotic waves originate from those nuclei and propagate through the whole tube. In the absence of nuclei, no mitotic waves are observed to travel through the tube. Scale bar is 200 µm.

Download video file (1.7MB, mp4)

Centrosomes have also been suggested to serve as pacemakers (Chang and Ferrell, 2013; Ishihara et al., 2014), potentially by concentrating pro-mitotic factors such as Cdc25 and cyclin B (Bonnet et al., 2008; Jackman et al., 2003). Demembranated sperm nuclei are known to have associated centrioles, which give rise to centrosomes that can generate microtubule asters. In order to test whether such centrosomes are critical to generate pacemakers, we added purified DNA to the extracts, which assembled into nuclei (Newmeyer et al., 1986). Mitotic waves were still observed indicating that DNA alone is sufficient to create pacemaker-generated mitotic waves without a need for centrosomes (Figure 2D, Figure 2—video 1).

As we hypothesize that the import of cell cycle regulators into the nucleus locally changes the cell cycle period, we decided to manipulate the nuclear import strength. We used the nuclear import inhibitor importazole, which is an inhibitor of importin-β transport receptors. Increasing levels of importazole were found to increase the cell cycle period and slowed down the formation of nuclei (Figure 2E,F). Mitotic waves were still observed with similar speeds for lower concentrations of importazole, while concentrations higher than 60 µM abolished the formation of nuclei and mitotic waves. Increasing inhibition of nuclear import was also found to lead to smaller nuclei with dimmer levels of GFP-NLS (Figure 2G). When nuclei became very small (i.e. for 40 µM importazole), it took long for the extract to start cycling and mitotic waves were lost (Figure 2F, Figure 2—video 2). We also indirectly manipulated nuclear formation by inhibiting the kinesin Eg5 using S-Trityl-L-cysteine (STLC), which interferes with the proper formation of microtubule structures. We found that increasing concentrations of STLC gradually increased the average cell cycle period (Figure 2—figure supplement 2). Here too, nuclei no longer formed and mitotic waves were no longer observed when STLC was present in too high concentrations (approx. 40 µM STLC). Overall, these findings confirm that nuclear import processes are important in organizing mitotic waves. They ensure that nuclei are able to introduce sufficient spatial heterogeneity in cell cycle period to generate clear mitotic waves.

A computational model where nuclei spatially redistribute cell cycle regulators predicts the location of pacemaker regions

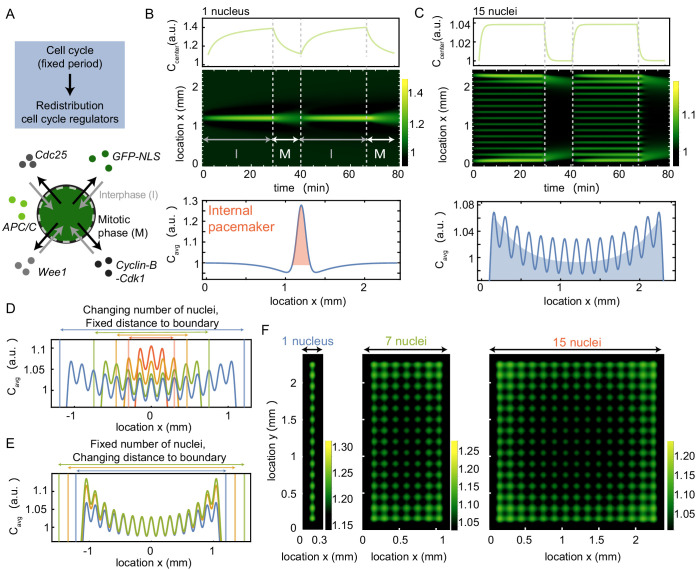
Based on our experimental observation showing that brighter nuclei serve as pacemakers, we set out to develop a theoretical model that describes how GFP-NLS and other proteins can be spatially redistributed by nuclei. A sketch illustrating such a model is shown in Figure 3A. The system toggles between interphase and mitosis with a fixed period. During interphase, nuclei form and nuclear proteins (such as GFP-NLS) are actively imported into the nucleus. During mitosis, the nuclear envelope breaks down and proteins are free to diffuse away. We implemented the competing import and diffusion processes using a generic partial differential equation (PDE) model that describes the evolution of the concentration C of nuclear protein, such as GFP-NLS (for details on this model, see Appendix 1). These competing processes are relevant for all proteins that localize to the nucleus. For example, it is known that APC/C is mostly localized in the nucleus, and Wee1 and Cdc25 are actively transported between cytoplasm and nucleus during the cell cycle (Baldin and Ducommun, 1995; Arnold et al., 2015). Such relocalization of cell cycle regulators can locally change the cell cycle oscillation frequency. Note that different different proteins can have opposing effects. For example, while increasing activity of Wee1 and APC/C tend to increase the cell cycle oscillation period, increasing Cdc25 activity leads to faster oscillations (Novak and Tyson, 1993; Tsai et al., 2014). Our experiments thus suggest that the overall effect of increasing nuclear import is to decrease the cell cycle period.

Figure 3. A model where nuclei spatially redistribute cell cycle regulators predicts the location of pacemaker regions.

(A) Schematic of the two phases of the model, interphase (import of regulators) and mitotic phase (diffusion). The cell cycle has a fixed period, which controls the periodic spatial redistribution of regulators. (B) Time evolution of Equation (8) in Appendix 1 in one spatial dimension for one nucleus, with the concentration C at the center of the domain shown in the top panel. The profile below is the time average of the intensity over one cell cycle period (Cavg), where the red area highlights the build-up of cell cycle regulators close to the nucleus. The intensity C is normalized such that 1Lx=0x=LC=1. Parameters: ϵ=4104μ µm3/min, σ=60μ µm, α=0.7, T=40 min, D=600μ µm2/min and constant initial condition C=1. Domain size L is 2400 µm. (C) Same as B, but now for 15 nuclei, where the time-averaged profile Cavg shows an overall build-up of regulators towards the boundary (see blue shaded area). (D) Same as C, but now varying the number of nuclei in the system, while keeping the distance of the outer nucleus to the system boundary constant. The total system size changes as a result of the changing number of nuclei. (E) Same as C, but now varying distances of the outer nucleus to the system boundary (db), while keeping the number of nuclei constant. The total system size changes as a result of the changing distance to the boundary db. (F) Same as B and C, but in a rectangular system of two spatial dimensions. The length of the system is fixed to 2400 µm, while the width of the system increases from 300 µm (with one nucleus) to 2400 µm (with 15 nuclei). The time-averaged profile Cavg is plotted, again illustrating the overall build-up of regulators towards the boundary.

Figure 3.

Figure 3—figure supplement 1. Influence of the distance of the outer nuclei to the system boundary on the build-up of regulators at the boundary.

Figure 3—figure supplement 1.

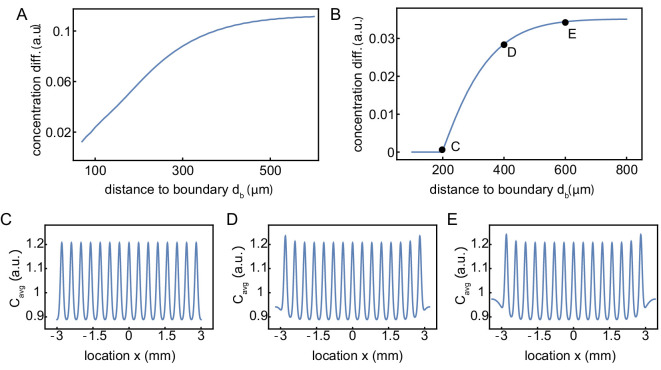
Influence of the distance of outer nuclei to the system boundary on the build-up of regulators at the boundary. (A) Same simulations as in Figure 3E, but continuously varying the distance db of the outer nuclei to the system boundary. The strength of the build-up of regulators at the boundary is found to saturate as db increases. This boundary strength is defined as the relative difference of the maximum (at the boundary) with respect to the background value in the middle, of the intensity profile averaged over time. The internuclear distance is 150 µm. (B) Same as A, but now for 15 nuclei with an increased internuclear distance of 400 µm. The distance db of the outer nuclei to the system boundary needs to be larger than 200 µm (half of the internuclear distance) to have a build-up of regulators at the boundary. (C-E) Examples of the concentration profiles at db = 200, 400, 600, respectively. The internuclear distance is 400 µm.
Figure 3—figure supplement 2. Influence of system parameters on the build-up of regulators at the boundary.

Figure 3—figure supplement 2.

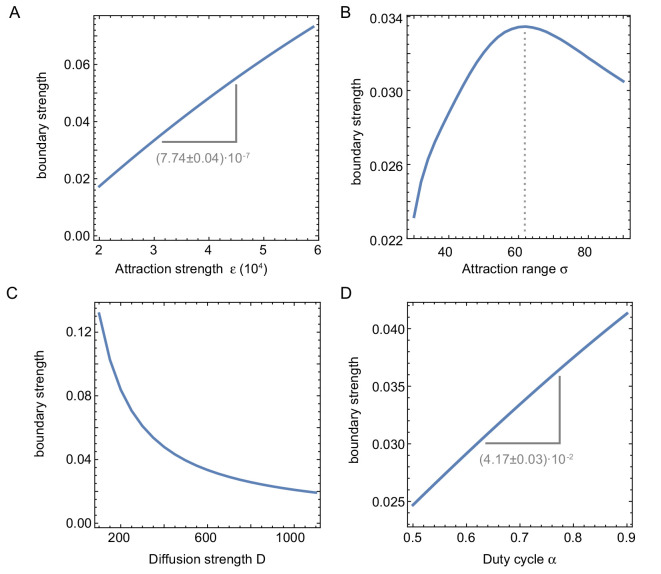
Influence of system parameters on the build-up of regulators at the boundary. We define the boundary strength as the relative difference of the maximum (at the boundary) with respect to the background value in the middle, of the intensity profile averaged over time. (A) The strength of the effect increases with the attraction strength ϵ (related to the nuclear import rate). (B) The boundary strength is found to be maximal for a certain attraction range σ. If σ is too small, the nuclei are too far apart to effectively compete for shared resources, leading to a small boundary strength. When σ is too large, however, the regions of attraction overlap so much that multiple nuclei are ‘competing’ for the same proteins, again leading to a smaller boundary strength. Interestingly, the optimal attraction range ≈ 150m ( corresponding to 2σ-3σ) corresponds to the size of the nuclear domain reported in Landing et al., 1974; Telley et al., 2012 and the experimentally measured internuclear distance (Figure 1—figure supplement 2G–I, Figure 3—figure supplement 5). (C) The build-up of protein regulators at the boundary also decreases with increasing diffusion strength, effectively washing out the effect during mitosis. (D) Similarly, the boundary effect is thus also more pronounced with increasing α, as this decreases the mitotic phase during which regulators are free to diffuse. Parameters (if not otherwise specified): (D,T,ϵ,σ,α)=(600,40,40000,60,0.7).
Figure 3—figure supplement 3. Influence of deviations to a perfect nuclear pattern in 1D on the build-up of regulators at the boundary.

Figure 3—figure supplement 3.

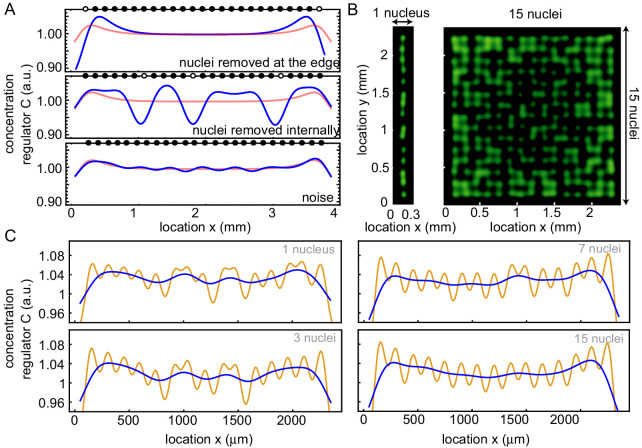
(A) Different nuclear positioning influences the concentration profile (blue). The average concentration profile of the control is shown in red for comparison. The black dots denote the positions of the nuclei, while they are white when nuclei are absent. Top: deleted nuclei at the boundary (1 and 25), middle: deleted three nuclei randomly, bottom: adding noise to nuclei positions. (B) Repetition of the simulations in Figure 3D with noise on the positions of the nuclei, for one row (left) and 15 rows (right) of nuclei in the x direction. (C) Averaged projection on the y direction (orange) and the filtered signal (blue) of that profile, for 1, 3, 7 and 15 rows of nuclei (similar as in Figure 3D,E) with noise on the nuclear positions.
Figure 3—figure supplement 4. Influence of internuclear distance on the build-up of regulators at the boundary.

Figure 3—figure supplement 4.

Influence of internuclear distance on the build-up of regulators at the boundary. Same simulations as in Figure 3C, but changing the internuclear distance from 150 µm (A) to 100 µm (B) to 80 µm. The number of nuclei is kept fixed to 15 nuclei.
Figure 3—figure supplement 5. Internuclear distance in tubes of varying width.

Figure 3—figure supplement 5.

Distance analysis of the tube experiments shown in Video 2 of the paper. Tube widths are 100 µm (A), 200 µm (B) and 560 µm (C). From the binarized kymographs, the centers of the nuclei are detected. For all nuclei, the (center-center) distances to the two nearest neighbors are calculated and after subtracting doubly counted distances shown in these histograms.
Figure 3—figure supplement 6. Influence of varying system widths in 2D on the build-up of regulators at the boundary.

Figure 3—figure supplement 6.

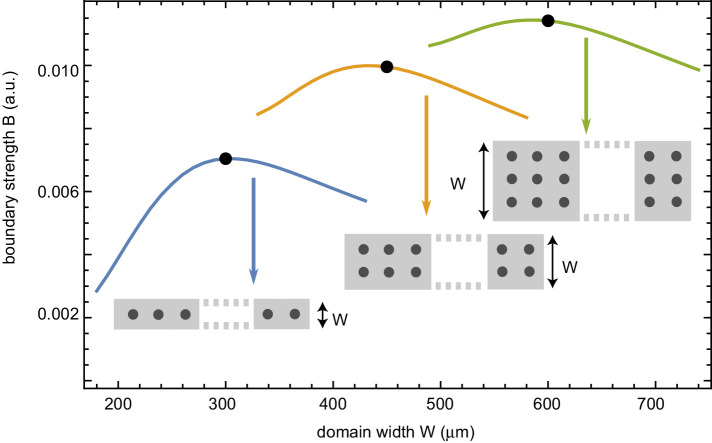
Strength of the build-up of regulators at the boundary in 2D with increasing system width and number of rows of nuclei. This boundary strength is defined as the relative difference of the maximum (at the boundary) with respect to the background value in the middle, of the intensity profile averaged over time.

We start by studying the simplest case of a single nucleus in the center of a one-dimensional domain (see Figure 3B). We defined the spatial range of attraction around the nucleus to be approx. 100 µm, such that it is consistent with the so-called nuclear domain, a subdomain of the cytoplasm in which spatial constraints show an effect on nuclear growth (Hara and Merten, 2015). In Xenopus cell-free extract, this nuclear domain has a diameter of approx. 170 µm (Hara and Merten, 2015). The term nuclear domain was originally introduced to describe the surroundings of evenly spaced nuclei in syncytial muscle fibers and Drosophila embryos (Landing et al., 1974; Telley et al., 2012). In Drosophila embryos, the nuclear domain (also called energid) is approx. 30 µm for nuclei which are approx. 5–10 µm in diameter (Chen et al., 2012; Telley et al., 2012). In our experiments we find an internuclear distance of approx. 150 µm for nuclei of approx. 40 µm in diameter (Figure 1—figure supplement 2G-I). Figure 3B shows that proteins quickly build up in the nuclear region in the early phase of the import period and then the proteins quickly disperse after nuclear envelope breakdown. As expected, when averaging the concentration profile over one cell cycle, we find that the time-averaged concentration Cavg peaks around the nucleus (see red area in Figure 3B), defining a pacemaker at the nucleus.

While a typical cell contains a single nucleus, the cell-free extract experiment shown in Figure 1 consists of many distributed nuclei. From the experimental data, we calculated how far different nuclei are separated from each other, finding that the distance between neighboring nuclei is typically around 150 µm (Figure 1—figure supplement 2G–I). Note that this distance is consistent with the typical size of a nuclear domain in Xenopus cell-free extract as mentioned before. Moreover, the internuclear distance is also consistent with the size of the recently characterized cell-like compartments that self-organize from homogenized interphase egg cytoplasm (Cheng and Ferrell, 2019). Using this information, we carried out simulations where many nuclei are equidistantly distributed over the whole domain. Such a simulation with 15 nuclei in a domain of 2.4 mm is shown in Figure 3C. Similarly as in the case of a single nucleus, the concentration C increases during interphase at each nuclear location, while it quickly decreases during mitosis. However, nuclei close to the boundary are found to have a higher average concentration Cavg (see blue shaded area in Figure 3C), which corresponds to a stronger pacemaker region at the boundary.

The build-up of regulators at the boundary is mainly attributed to the fact that nuclei in the interior of the domain compete with neighboring nuclei to attract the available proteins, while nuclei close to the boundary only have one such ‘competitor’. In Figure 3D we verify how the number of nuclei in the system affects the average distribution of regulators, keeping the distance between the outer nuclei and the system boundary constant. Starting from the situation with 15 nuclei in Figure 3C (blue), we gradually decreased the number of nuclei in the system. Figure 3D shows that for decreasing numbers of nuclei (nine in green, five in orange, and three in red), the build-up of regulators at the boundary gradually decreases. When only having three nuclei in the system (red), the central nucleus is found to be dominant and the boundary effect is completely lost. Apart from this competition for regulators between neighboring nuclei, the location of the boundary itself could play an important role. We quantified this boundary effect by changing the distance from the outer nuclei to the system boundary (db), while keeping the number of nuclei in the system fixed (15 nuclei). Figure 3E shows that initially an increase in the distance to the boundary db leads to a larger build-up of regulators at the boundary, but this increase saturates as db becomes larger (Figure 3—figure supplement 1). Although the extent to which regulators build up close to the boundary also depends on the model parameters and on the exact nuclear distribution (see Figure 3—figure supplement 2, Figure 3—figure supplement 3, Figure 3—figure supplement 4), it was found to be a robust phenomenon. Interestingly, however, randomly removing a few nuclei within the domain could abolish the build-up of regulators at the boundary. Instead, proteins build up close to the nuclei adjacent to the gaps (Figure 3—figure supplement 3).

Finally, we expanded our model to two spatial dimensions. We considered rectangular domains of varying aspect ratios, keeping one side fixed in length, while varying the other side in width. The long side was chosen the same as in Figure 3C in which we again define 15 nuclei. We then explored the effect of different widths with increasing rows of nuclei, see Figure 3F. The number of rows of nuclei was based on the experimental observation that wider systems support more nuclei and that those nuclei are separated by the same internuclear distance as in the thin tubes (Figure 3—figure supplement 5). Similarly as in the one-dimensional case, we observe that nuclear cell cycle regulators build up at the edges of the domain. This effect was particularly strong along the longest side of the rectangle, and strikingly, it became more pronounced as the width of the domain increased (see Figure 3F, Figure 3—figure supplement 6).

Multiple pacemakers compete to define the direction of mitotic waves

Based on the model in the previous section, we were able to make predictions of how different nuclear patterns can lead to well-defined spatial distributions of cell cycle regulators. However, transitions between interphase (nuclear import) and mitotic phase (nuclear envelope breakdown and diffusion) occurred with a fixed period. Here, we expand the model by introducing a dependence of the cell cycle period on the local concentration of cell cycle regulators (see details in Appendix 1). In this way a spatial heterogeneity in the concentration of cell cycle regulators leads to a corresponding spatial frequency profile. In general, one expects that such spatial heterogeneities in the cell cycle period create multiple waves. These waves typically propagate into the surrounding medium and compete with each other until the pacemaker with the highest frequency ultimately entrains the whole system (Kuramoto, 1984).

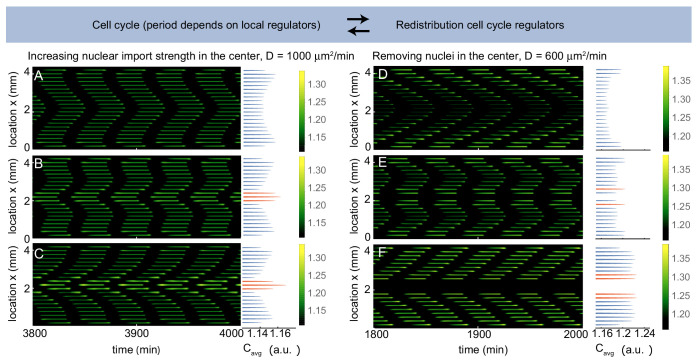
We used this model to explore the dynamics of a pattern of 20 equidistantly distributed nuclei in a domain of 4.2 mm. Figure 4A,D shows that on average cell cycle regulators build up close to the boundary, similarly as in Figure 3C. In the current model, however, this build-up of regulators also leads to a decreased cell cycle period at the boundary. Such a pacemaker region close to the boundary then sends out waves that gradually control the whole domain and they travel more quickly for larger diffusion strengths D. We then gradually increased the strength of nuclear import of the three most central nuclei, which on average led to an increased concentration of cell cycle regulators here. For moderate increases in nuclear import strength, two waves compete with one another. A boundary-driven wave and a wave coming from the interior of the domain coexist (Figure 4B). Further increasing the nuclear import strength, waves no longer emerged from the boundary and were entirely controlled by the central region of ”bright" nuclei (Figure 4C).

Figure 4. Multiple pacemakers compete to define the direction of mitotic waves.

Time evolution of Equation (21) in Appendix 1 in one spatial dimension. The profile on the right is the time average of the intensity over one cell cycle period (Cavg). The intensity C is normalized such that 1Lx=0x=LC=1. Parameters: ϵ=6104μ µm3/min, σ=60μ µm, α=0.7 and initial condition C=1. (A-C) D=1000μ µm2/min, domain size L is 4400 µm including 21 nuclei separated by 200 µm. β is defined as a factor by which the nuclear import strength ϵ is increased in the middle nucleus (see Appendix 1). β is 1 (A), 1.04 (B) and 1.08 (C). Upon increasing the nuclear import strength of the middle nucleus, a transition is observed from boundary-driven waves (A) to waves coming from an internal pacemaker (C). The internal pacemaker region has a higher average concentration of the regulator C, as indicated in orange. For intermediate values of β both types of waves coexist (B). (D-E) D=600μ µm2/min, β=1, domain size L is 4400 µm. When 21 nuclei are regularly separated by 200 µm, a boundary-driven wave is observed (D). While removing the middle nucleus leads to the coexistence of boundary-driven waves and a waves coming from an internal pacemaker region close to the introduced gap (E), removing three of the middle nuclei abolishes the boundary-driven wave and only the wave coming from the internal pacemaker region persists.

Figure 4.

Figure 4—figure supplement 1. Competing pacemakers in known PDE models for cell cycle oscillations reproduce similar mitotic wave dynamics.

Figure 4—figure supplement 1.

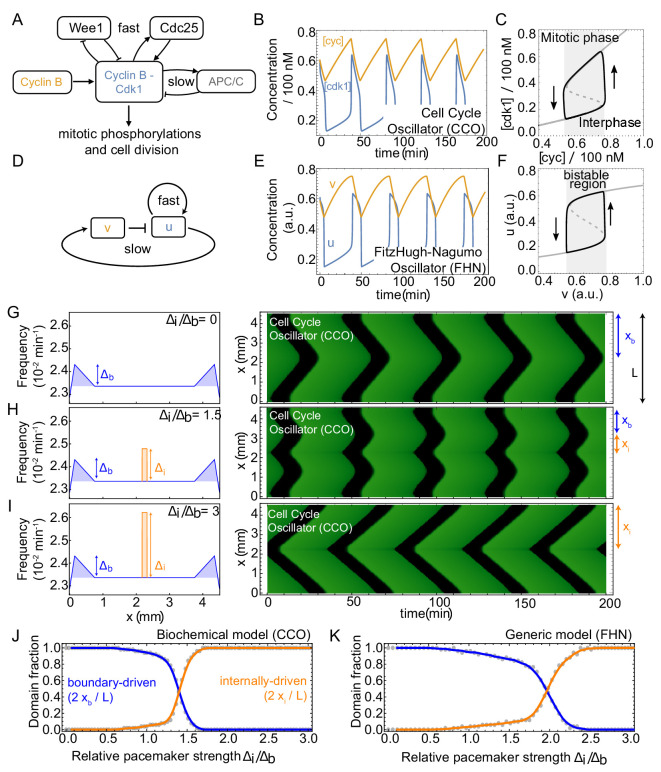
(A-F) show that models of different complexity are able to capture cell cycle oscillations. (A,D) Core components and interactions of the cell cycle oscillator model (CCO) and the FitzHugh-Nagumo oscillator model (FHN), respectively. (B,E) Time series of relaxation oscillations in the CCO and the FHN, respectively. CCO parameters are set on (a1,a2,a3)=(0.8,0.4,0.01) min-1, (b1,b2,b3)=(4,2,0.06) min-1, (E1,E2,E3)=(35,30,32) nM, (n1,n2,n3)=(11,3.5,17) and k=1.5 nM/min. For the biological meaning of the parameters, see Appendix 1. FHN parameters are set on (a,b,c,d,ϵ)=(-0.85,0.05,1.2,0.5,0.01) and we applied the linear mapping (u,v,t)(-0.19u+0.5,0.32v+0.52,5.75t) such that the output of both CCO and FHN models are similar. C,F. Phase space projection of the time series of the limit cycle solutions corresponding to (B,E), including nullclines of resp. [cdk1] and u. (G) Numerical simulation of the cell cycle oscillator (CCO) model where the Cdc25-related parameters (a1 and b1) are changed in space to define a spatially heterogeneous frequency profile. The left panel shows that the frequency is increased by Δb at the boundary with respect to the cell cycle frequency elsewhere in the domain (see blue shaded region). The right panel illustrates the time series after a transient of ∼ 80 cycles in a domain of size L=4.5 mm. Boundary-driven waves are found to coordinate the whole domain (2xbL). (H) Same as A, but now a second internal pacemaker region is introduced (frequency increased by Δi as indicated by orange region). Waves originating at the boundary and at the internal pacemaker region coexist (Δi/Δb=1.5). (I) Same as B, but with Δi/Δb=3. Mitotic waves are now dominated by the internal pacemaker (2xiL). (J) Domain fractions controlled by waves starting from the boundary (2xb/L) and from the internal pacemaker (2xi/L). Δb is kept constant, while Δi is changed for each simulation using the CCO model. K. Same as J, but for the FitzHugh-Nagumo (FHN) model.
Figure 4—figure supplement 2. Boundary-driven waves can exist in spatially-extended systems based on different types of oscillators.

Figure 4—figure supplement 2.

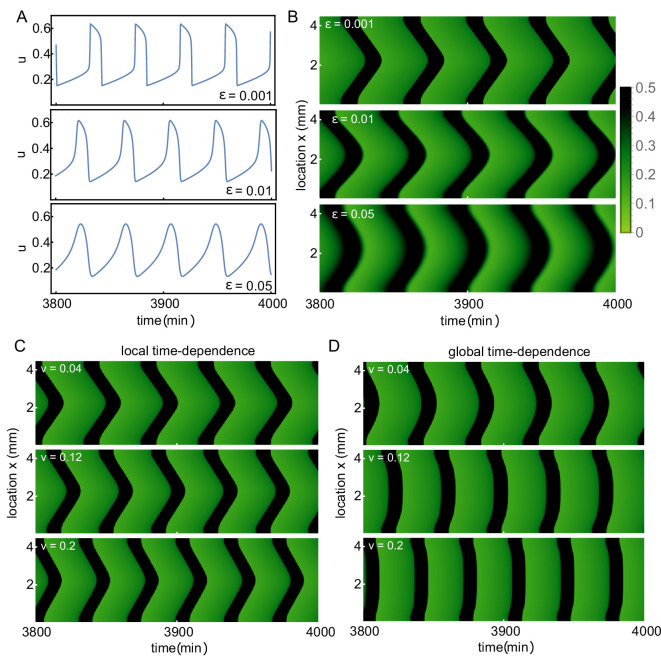
Boundary-driven waves can exist in spatially-extended systems based on different types of oscillators. We study the dynamics of mitotic waves using the same numerical setup as in Figure 4—figure supplement 1. (A) Time traces for the FitzHugh-Nagumo (FHN) model are shown for changing values of ϵ, a measure for the timescale separation in the system. When increasing ϵ oscillations become more sinusoidal and less relaxation-like. (B) Kymographs, corresponding to the oscillations shown in A, show that boundary-driven waves persist when varying ϵ. (C,D) The effect of using time-dependent parameters in the FHN system on the existence and properties of boundary-driven waves. Parameters are changed with different velocities, either locally (C) or globally (D) (for more details, see Appendix 2). The kymographs are shown for three different velocities. Whereas boundary-driven waves persist, their wave speed increases with this velocity. In the global case (D), mitotic waves in the presence of such time-dependent changes have been dubbed 'sweep waves’ (Vergassola et al., 2018).

Next, we removed a nucleus from the center of the domain. Previously, for fixed cell cycle periods, we found that removing nuclei abolished the build-up of regulators at the boundary and proteins localized close to the nuclei adjacent to the gaps (Figure 3—figure supplement 3). Figure 4E indeed illustrates that there is an increased concentration of regulators close to the central gap, but a build-up of regulators close to the boundary also persisted, such that two competing waves were found. We then removed two more nuclei from the center (Figure 4F), which caused the central pacemaker region to send out a wave that controlled the whole domain. The fact that increasing nuclear import strengths and the absence of nuclei within a nuclear pattern both lead to the creation of waves from a nearby location is consistent with the experimental observations reported in Figure 1, Figure 1—figure supplement 3).

We wondered whether these dynamics of competing pacemakers are specific to this particular computational model that includes nuclear import and diffusion processes. Therefore, we also implemented known PDE models of cell cycle oscillations (Appendix 2), where we define two pacemaker regions (see Figure 4—figure supplement 1G–I): an internal pacemaker and a boundary pacemaker region. We carried out simulations continuously changing the relative strength of both pacemaker regions by increasing the difference in cell cycle period. We found a gradual transition from boundary-driven dynamics to internal pacemaker-driven dynamics (Figure 4—figure supplement 1). Similar results were found by using the FitzHugh-Nagumo oscillator model, a general model for relaxation-type oscillatory systems (Figure 4—figure supplement 1K, Figure 4—figure supplement 2). Moreover, we found that even more sinusoidal oscillations preserved boundary-driven waves (Figure 4—figure supplement 2). This suggests that the generation of boundary-driven waves is largely independent of the type of oscillations, as long as the oscillation period is decreased close to the boundary.

Our findings underscore the generic character of the dynamics of multiple competing pacemakers. Pacemaker-driven traveling waves, also often referred to as target patterns, have been widely studied and they form thanks to spatial heterogeneities that locally increase the oscillation frequency. The majority of such pacemaker waves were initially observed in chemical reaction-diffusion systems where heterogeneities were introduced as dust particles that locally modified the properties of the medium (Zaikin and Zhabotinsky, 1970; Zhabotinsky and Zaikin, 1973; Tyson and Fife, 1980). These experimental observations triggered many other studies on both traveling waves (Tyson and Fife, 1980; Kopell, 1981; Hagan, 1981; Kuramoto, 1984; Jakubith et al., 1990; Bugrim et al., 1996; Bub et al., 2005; Stich and Mikhailov, 2006) and spiral waves (Jakubith et al., 1990; Bub et al., 2002; Bub et al., 2005) triggered by a pacemaker. The interaction of multiple pacemaker waves has also been analyzed (Kuramoto, 1984; Walgraef et al., 1983; Mikhailov and Engel, 1986; Lee et al., 1996; Kheowan et al., 2007). In general, they propagate into the surrounding medium and compete with each other until the pacemaker with the highest frequency ultimately entrains the whole system (Kuramoto, 1984). The existence of the transition region is therefore somewhat surprising. However, simulating the system for increasingly longer transient times, we find that the transition region where boundary-driven waves and internal pacemaker-driven waves coexist shrinks, suggesting that after infinitely long transients one pacemaker indeed controls the whole domain. Such infinite transient times are, however, less biologically relevant as the early embryonic cell cycle oscillations only persist for about 13 cycles (Box 2). Therefore, one would expect to observe the full range of transient pacemaker dynamics in actual biological systems.

Wider systems lead to boundary-driven mitotic waves

Our modeling leads to several predictions. First, wider systems lead to higher concentrations of cell cycle regulators at the boundary. Such a local decrease of the cell cycle period leads to boundary-driven mitotic waves. Second, systems with intermediate width allow both internally- and boundary-driven pacemakers. Third, sparsely distributed nuclei favor internal pacemakers. Based on these three predictions, we set out to verify them experimentally.

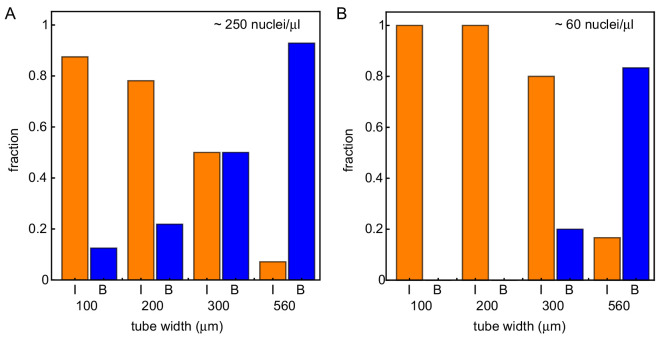
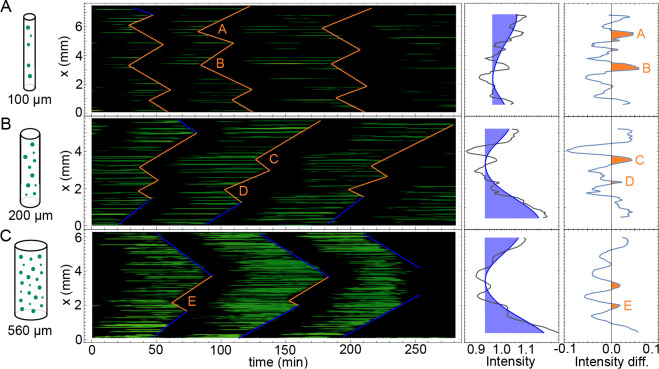
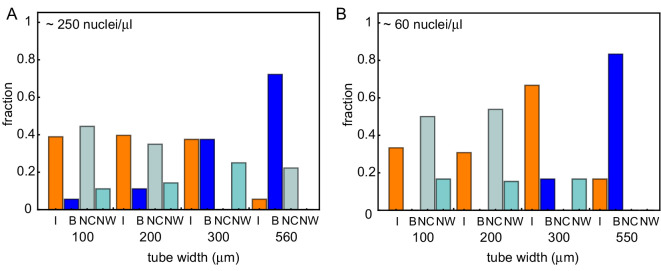
We repeated the experiment in Figure 1 for varying diameters of the Teflon tubes (approximately 100, 200, 300 and 560 µm) for a nuclear concentration of ≈ 250 nuclei/µl. A representative selection of videos corresponding to this set of experiments is shown in Video 2 (for corresponding kymographs, see Figure 5—figure supplement 1). While the thinnest tube shows mitotic waves coordinated by internal pacemakers, mitotic waves are boundary-driven over the whole domain in the thickest tube. This is consistent with the first theoretical prediction that wider systems lead to boundary-driven mitotic waves. Furthermore, Video 2 illustrates that in tubes of intermediate width (200 and 300 µm), boundary-driven waves coexist with mitotic waves that are driven by internal pacemakers. This is consistent with the second theoretical prediction. By analyzing experiments of 49 tubes of varying widths, we found these findings to be consistent (see Figure 5A). While the thinnest tubes have the lowest probability of finding boundary-driven mitotic waves, all of the experiments with the thickest 560 µm tubes showed boundary-driven waves (Figure 5—figure supplement 2). The fraction of experiments with boundary-driven wave dynamics increased smoothly with the tube width. For a more detailed analysis, see Figure 5—figure supplement 3.

Figure 5. Wider systems lead to boundary-driven mitotic waves.

Fraction of experiments dominated by internally-driven waves (‘I’) and by boundary driven waves (‘B’), evaluated at the end of each of the N=66 imaged tubes of varying width and varying concentration of demembranated sperm nuclei. Cases where both wave types coexist (‘IB’) are counted half in each category. This is done for two different concentration of demembranated sperm nuclei: ≈ 250 nuclei/µL extract (A) or ≈ 60 nuclei/µL extract (B). For panel A (B), results are obtained for N = 49 (17) analyzed Teflon tube experiments using the GFP-NLS reporter, and they are pooled from 23 (7) different cell-free extracts.

Figure 5.

Figure 5—figure supplement 1. Kymographs of mitotic waves in tubes of varying width.

Figure 5—figure supplement 1.

Kymographs corresponding to the experiments shown in Video 2 for the tubes of 100 µm (A), 200 µm (B), and 560 µm (C) in diameter. Boundary-driven waves are indicated by blue lines, while mitotic waves driven by internal pacemakers are highlighted by orange lines. On the right hand side, the corresponding averaged GFP-NLS intensity profiles are shown in black. Slow spatial changes are highlighted in blue. The resulting profiles after removing these slower changes are then shown in orange, highlighting internal pacemakers regions with a higher GFP-NLS intensity (A–E). Approx. 250 nuclei/µl are added.
Figure 5—figure supplement 2. Kymographs of mitotic waves in thick tubes (560 µm diameter).
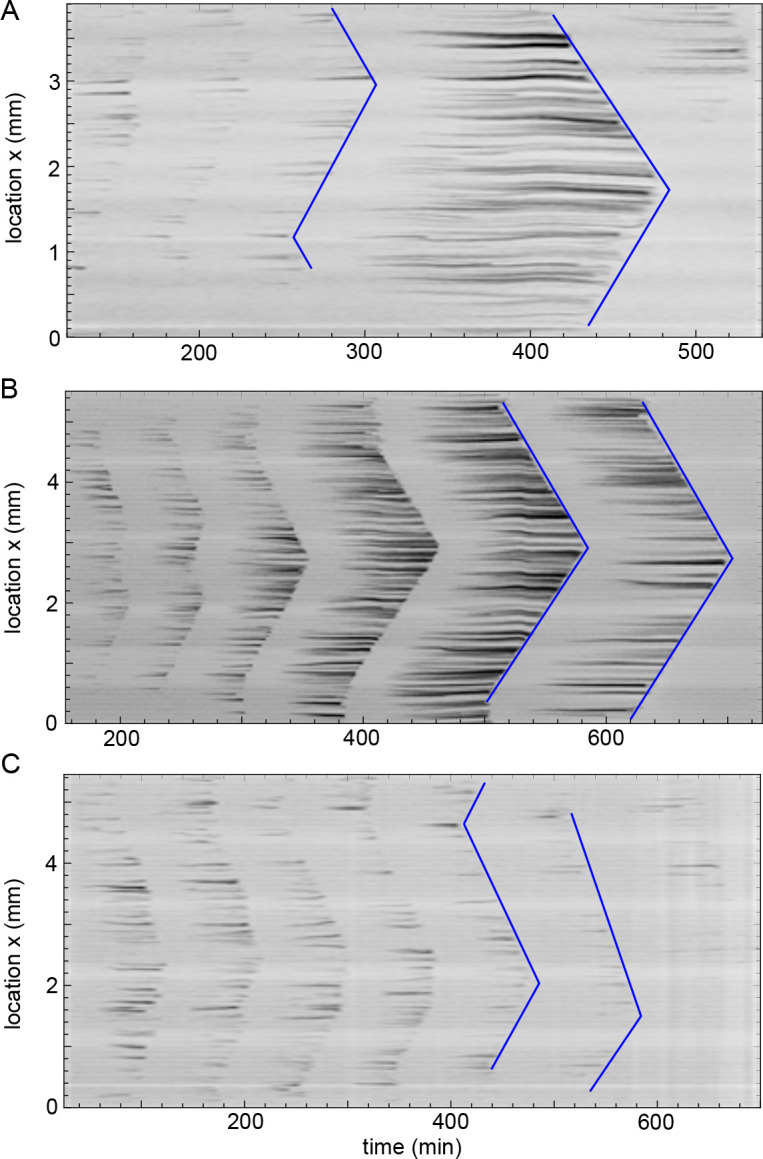
Figure 5—figure supplement 2.

Three representative experiments in the thickest tubes with a diameter of 560 µm (corresponding to the situation in Figure 5—figure supplement 1C). Kymographs of mitotic waves (see blue lines) are shown which all converge to boundary-driven waves. Approx. 250 nuclei/µl are added.
Figure 5—figure supplement 3. Analysis of all experiments, including those that did not cycle or did not show any wave dynamics.

Figure 5—figure supplement 3.

We carried out 120 experiments in total, 89 with a concentration of ∼ 250 nuclei/µL extract and 31 with a concentration of ∼ 60 nuclei/µL extract. These data also included experiments that showed few cell cycle oscillations, where we discarded all experiments that cycled less than five times (labeled as NC - No Cycling). We also discarded experiments which did not show clear mitotic wave behavior (labeled as NW - No Waves). For all experiments that showed wave behavior and has sufficient cycles, we then characterized its behavior towards the end of the experiment in three ways: (i) waves emerge from an internal pacemaker (labeled as I), (ii) waves emerge from the boundary (labeled as B), (iii) or waves emerge both internally and from the boundary (in which case we considered this experiment as 50% I and 50% B). All data including NC/NW for full tubes and concentrations of ∼ 250 nuclei/µL extract (left) and ∼ 60 nuclei/µL extract (right).
Figure 5—figure supplement 4. Robustness of image analysis of experiments.

Figure 5—figure supplement 4.

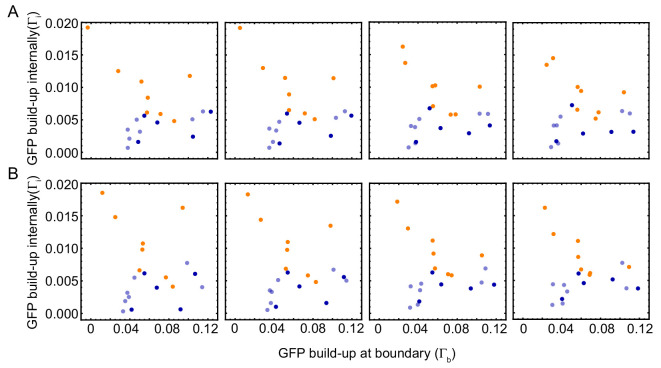
GFP-NLS strength of internal peaks (Γi) vs. the GFP-NLS boundary strength (Γb) for s=7.5/L, k{0.16L,0.18L,0.22L,0.24L} (A) and for k=0.2L, s{5/L,6.5/L,8.5/L,10/L} (B). Colors denote the type of observed mitotic waves: orange for boundary-driven waves, and blue for waves driven by internal pacemakers. Wave speed and cell cycle period for varying tube width. Wave speed (A,C) and cell cycle period (B,D) over time obtained for N = 27 analyzed Teflon tube experiments using the GFP-NLS reporter. Results are pooled from 15 different cell-free extracts for ≈ 250 nuclei/µl. Tube width is 100, 200, 300, and 560 µm.
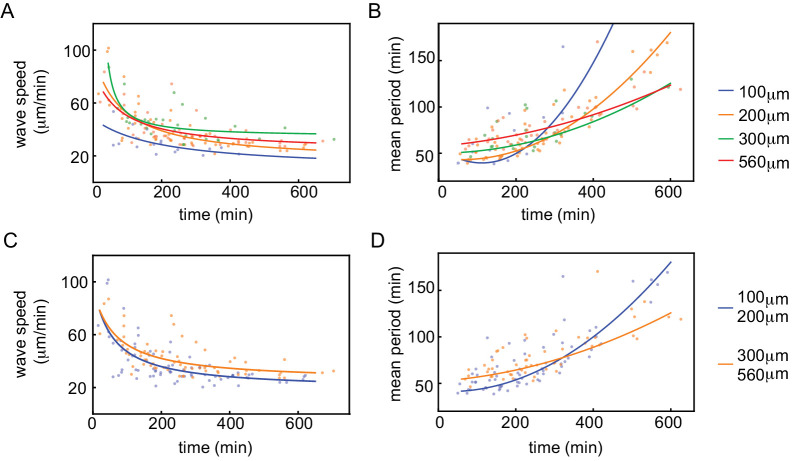
Figure 5—figure supplement 5. Wave speed and cell cycle period for varying tube width.

Figure 5—figure supplement 5.

Wave speed (A,C) and cell cycle period (B,D) over time obtained for N=27 analyzed Teflon tube experiments using the GFP-NLS reporter. Results are pooled from 15 different cell-free extracts for ≈250 nuclei/µl. Tube width is 100, 200, 300, and 560 µm.

Video 2. Video of cell-free extract experiments in Teflon tubes of varying diameters (≈ 100, 200, 300 and 560 µm wide) and a thin droplet of ≈ 1 mm wide.

Download video file (3MB, mp4)

Imaging is done with the GFP-NLS reporter. Mitotic waves are found to originate from the boundary as the system becomes wider. Scale bar is 200 µm.

Next, we repeated the experiments using a lower concentration of added sperm nuclei (≈ 60 nuclei/µl). This strongly decreased the probability for mitotic waves to originate from the boundary (see Figure 5B). We noticed that the regularity of the nuclear pattern was disrupted due to the decreased amount of nuclei. Consistent with our third theoretical prediction, the absence of neighboring nuclei was found to strengthen nearby pacemaker regions and decreased the likelihood of having pacemaker regions at the boundary (see Figure 1—figure supplement 3).

As boundary-driven waves were especially clear in the thickest Teflon tubes (560 µm), we wondered whether it was important for the system to be wide enough in all three spatial dimensions. In principle, the theory we developed predicts boundary-driven waves to be present in one-dimensional (Figure 3Figure 4) and two-dimensional (Figure 3F) spatial systems. Therefore, we carried out experiments with droplets of cycling cell-free extracts on Teflon-coated glass slides, providing a thin structure, yet wide in diameter (≈ 1 mm). All such experiments showed that mitosis was coordinated via mitotic waves that originate at the boundary, consistent with the theoretical predictions (see Video 2).

Finally, we analyzed each individual experiment in more detail with the goal to directly link the presence of pacemaker regions (be it at the boundary or internally) to a local increase in GFP-NLS intensity. This analysis confirmed that there is a higher build-up of GFP-NLS intensity towards the boundaries in wider tubes (see Figure 5—figure supplement 4).

Our findings illustrate that the spatial environment has a strong influence on how biological processes self-organize. In particular, increasing the spatial dimensions of the system leads to a higher probability of observing mitotic waves that originate at the boundary of the system. Other studies have also stressed the importance of system size, boundaries, and geometry on self-organization processes. For example, using cell-free frog extracts, cytoplasmic volume was demonstrated to determine the spindle size (Good et al., 2013; Hazel et al., 2013) and the size of the nucleus (Hara and Merten, 2015).

System boundaries (Kopell et al., 1991; Haim et al., 1996; Rabinovitch et al., 2001; McNamara et al., 2016; Bernitt et al., 2017) and system geometry (Wettmann et al., 2018) have been shown to affect the dynamics of traveling waves. In the widely studied amoeba Dictyostelium discoideum, the origin of cAMP waves have been studied in inhomogeneous systems. Waves appear spontaneously in areas of higher cell density with the oscillation frequency of these centers depending on their density (Vidal-Henriquez and Gholami, 2019). In the presence of advection, a boundary-induced instability was found to periodically excite a cAMP wave near the boundary (Vidal-Henriquez et al., 2017). Another well-characterized model organism is the bacterium Escherichia coli, where Min-protein wave patterns help select the site of cell division (Hu and Lutkenhaus, 1999; Raskin and de Boer, 1999). Wave patterns and the location of cell division have been shown to strongly depend on the system size and geometry, both in vivo by deforming cell shape (Männik et al., 2012; Wu et al., 2015; Wettmann et al., 2018) and in vitro by reconstituting Min oscillations in open and enclosed compartments (Zieske and Schwille, 2014; Zieske et al., 2016; Caspi and Dekker, 2016; Wettmann et al., 2018). As thin compartments were gradually increased in length, multiple regions of oscillations were observed (Zieske and Schwille, 2014; Zieske et al., 2016; Caspi and Dekker, 2016; Wettmann et al., 2018). For more complex geometries, many more wave patterns have been observed, such as standing waves, traveling planar and spiral waves, and coexisting stable stationary distributions (Zieske and Schwille, 2014; Zieske et al., 2016; Caspi and Dekker, 2016; Wettmann et al., 2018). While there are similarities with our findings in the Xenopus cell-free extracts, one important difference is that the wave patterns in the Min system are mainly controlled by the spatial dimensions and geometry. In contrast, in our findings the influence of the spatial dimensions are, at least partially, mediated by the nuclei within the oscillatory medium that serve as pacemakers.

Discussion

A crucial task that a developing cell needs to accomplish is the replication of its DNA and, subsequently, cell division. In large cells, which demand spatial coordination in order to accomplish this task, mitotic waves can organize the process. We have demonstrated that nuclei act as pacemakers generating the mitotic waves in Xenopus cell-free extracts. Pacemakers are regions that oscillate faster than their environment, and, as such, initiate traveling waves (Kuramoto, 1984). A nucleus becomes a pacemaker by its ability to import factors into the nucleus and, presumably, concentrate cell cycle regulators. Indeed, we found that pacemakers are often located near nuclei that are brighter due to increased import of exogeneously added GFP-NLS. We built a generic computational model, which showed that the distribution of cell cycle regulators also depends on the nuclear positioning and spatial dimensions of the system. We tested this idea by experimentally exploring the mitotic wave dynamics in cell-free extracts in which we changed the nuclear density and nuclear import strength. In cell-free extracts with only few nuclei, we found that mitotic waves originated at those nuclei and spread through the parts of the extract devoid of nuclei. In the absence of any nuclei in the system, no mitotic waves were observed. Decreasing the nuclear import strength similarly avoided the formation of mitotic waves. Finally, we changed the spatial dimensions of the system, and found that thicker tubes have a larger tendency to concentrate cell cycle regulators at the boundaries, leading to mitotic waves originating at the outer edges of the tubes. Thus, nuclei are central hubs that organize this complex cellular process.

One advantage to having the nucleus control the timing of mitosis is that it allows the cell to ensure that DNA replication has completed before initiating mitosis. While DNA checkpoints are largely silenced in the early Xenopus embryo (Newport and Dasso, 1989), in Drosophila DNA content is known to activate the DNA-replication checkpoint and alter the cell cycle period (Farrell and O'Farrell, 2014; Deneke et al., 2016). A failure in the correct regulation of mitosis is associated with polyploidy, which plays a key role in nonmalignant physiological and pathological processes (Fox and Duronio, 2013). In the absence of a proper pacemaker, or if the pacemaker were to be located elsewhere, linking DNA replication to mitosis would be more complicated and, perhaps, more prone to error.

Previous studies have pointed to the critical role of the nucleus in spatial redistributing cell cycle regulators (Gavet and Pines, 2010; Santos et al., 2012). In particular, the nuclear import of Cyclin B has been shown to lead to spatial positive feedback, ensuring a robust and irreversible mitotic entry (Santos et al., 2012). Nuclei have also been found to be crucial in ensuring cell cycle oscillations in the Drosophila embryo (Huang and Raff, 1999; Deneke et al., 2019). Interestingly, although previous reports have suggested that centrosomes serve as pacemakers (Chang and Ferrell, 2013; Ishihara et al., 2014), we found that they are dispensable. After treating extracts with purified DNA, which lacks centrosomes, we still observed mitotic waves.

We also found that the interaction of multiple nuclei in a shared cytoplasm can lead to unexpected behavior. Nuclei self-organize in regular spatial patterns within a tube of Xenopus cell-free extract. The measured regular spacing between neighboring nuclei was found to be approximately 150 µm, which coincides with the nuclear subdomain of the cytoplasm in which spatial constraints show an effect on nuclear growth as studied in syncytial muscle fibers (Landing et al., 1974), Drosophila embryos (Telley et al., 2012), and cell-free frog extracts (Hara and Merten, 2015). It is also consistent with the size of cell-like compartments that spontaneously form in homogenized interphase cell-free frog extracts (Cheng and Ferrell, 2019). We found that such regularity in the nuclear distribution led to a build-up of cell cycle regulators towards the boundary of the system, such that the collective behavior of many nuclei creates a pacemaker region at the boundary of the oscillatory medium. This boundary effect was stronger with increasing widths of the tubes, in the presence of more extended regular nuclear patterns. We consistently observed more boundary-driven waves in such wider tubes.

Mitotic waves in the early Drosophila embryo also often originate at the boundary (Foe and Alberts, 1983). During nuclear cycles 10–13 in the syncytial blastoderm of these early embryos, nuclei enter (and exit) mitosis in waves that originate from the opposite anterior and posterior poles of the embryo and terminate in its mid-region. While mitotic waves are associated to so-called trigger waves in the Xenopus embryo (Chang and Ferrell, 2013; Gelens et al., 2014), they have been shown to be so-called sweep waves in the Drosophila embryo (Vergassola et al., 2018). We find, by computational modeling, that sweep waves are also able to generate boundary-driven waves in a syncytium, and that they propagate faster than trigger waves as predicted by Vergassola et al. (2018)Figure 4—figure supplement 2. However, the internuclear distance of our simulations is significantly larger than the one observed in the more crowded Drosophila embryo, so it remains unclear whether our results can directly extend to that system. Despite the limitations of the model, our work is expected to be relevant for all coenocytes (Ondracka et al., 2018), where waves of mitosis have also been observed (Sears, 1967; Brown et al., 2003).

Nuclei are a natural choice of pacemaker for mitotic waves because they allow for a natural way to link one biological process, DNA replication, with another, mitosis. We hope that our work will further trigger new studies into the origin of pacemakers as the initiation of biological decisions mediated by traveling waves seem to be key in the proper coordination of a biological process. Traveling waves have, for example, also been found to propagate apoptosis (Cheng and Ferrell, 2018), action potentials (Hodgkin and Huxley, 1952), and calcium signals (Stricker, 1999) over large distances. In these systems, defective mitochondria, signals from neighboring neurons, or fertilization serve as the initial trigger to locally activate a wave.

Materials and methods

Key resources table.

Reagent type
(species) or resource
Designation Source or reference Identifiers Additional information
Strain, strain background (Xenopus laevis, male and female) Xenopus laevis Centre de Res- sources Biolo- giques Xénopes RRID:XEP_Xla
Recombinant DNA reagent GFP-NLS DOI: 10.1038/nature12321 Construct provided by James Ferrell (Stanford Univ., USA)
Peptide, recombinant protein (fluorescent) microtubule reporter Cytoskeleton, Inc Cat. #: TL488M-B
Commercial assay or kit GenElute Mammalian Genomic DNA kit Sigma-Aldrich Cat. #: G1N70
Chemical compound, drug Human chorionic gonadotropin MSD Animal Health CHORULON
Chemical compound, drug Pregnant mare’s serumgonadotropin MSD Animal Health FOLLIGON
Chemical compound, drug Calcium ionophore A23187 Sigma-Aldrich PubChem CID: 11957499; Cat. #: C7522
Chemical compound, drug Leupeptin Sigma-Aldrich PubChem CID: 72429; Cat. #: L8511
Chemical compound, drug Pepstatin Sigma-Aldrich PubChem CID: 5478883; Cat. #: P5318
Chemical compound, drug Chymostatin Sigma-Aldrich PubChem CID: 443119; Cat. #: C7268
Chemical compound, drug Cytochalasin B Sigma-Aldrich PubChem CID: 5311281; Cat. #: C6762
Chemical compound, drug Proteinase K Sigma-Aldrich Cat. #: P2308
Chemical compound, drug Importazole Sigma-Aldrich PubChem CID: 2949965; Cat. #: SML0341
Chemical compound, drug S-Trityl-L-cysteine Acros Organics PubChem CID: 76044; Cat. #: 173010050
Software, algorithm Fiji http://fiji.sc/ RRID:SCR_002285
Software, algorithm Wolfram Mathematica www.wolfram.com/mathematical RRID:SCR_014448
Software, algorithm Ilastik www.ilastik.org RRID:SCR_015246
Software, algorithm Model for nuclear
import
This paper, used for Figure 3 Code on GitHub (Nolet, 2020)
Software, algorithm Model for nuclear import, frequency dependent This paper, used for Figure 4 Code on GitHub
(Nolet, 2020)
Other Teflon tube Cole-Parmer Cat. #: 06417–11
Other Hoechst 33342 ImmunoChemistry technologies RRID:AB_265113; Cat. #: 639 (5 µg/mL)
Other Leica TCS SPE confocal microscope Leica Microsystems RRID:SCR_002140
Other Ultracentrifuge OPTIMA XPN - 90 Beckman Coulter RRID:SCR_018238; Cat. #: A94468

Numerical integration

All PDE models are solved by numerical integration using custom-made Fortran scripts. Discretization in time is done with a forward Euler method, while discretization in space is carried out with a central difference method. Data is written to .txt files which are then analyzed in Mathematica. The ODE models (CCO and FHN for Figure 4—figure supplement 1) are directly solved in Mathematica, since computational time is limited to seconds. The numerical codes that were used are available through GitHub (Nolet, 2020).

Experimental setup

We reconstitute cell cycle oscillations in vitro in cell-free cycling extracts made from unfertilized Xenopus laevis frog eggs, following the protocol by Murray, 1991; Box 2). Female Xenopus laevis frogs are injected subcutaneously with 500 injection units (IU) human chorionic gonadotropin (MSD Animal Health) to induce ovulation, after prior priming with 100 IU pregnant mare’s serum gonadotropin (MSD Animal Health). The obtained eggs are rinsed with deionized water and subsequently their jelly coat is removed by incubation in a 2% w/v cysteine in 1 × XB salts solution. Dejellied eggs are now susceptible to activation with the calcium ionophore A23187 (0.5 µg/mL in 0.2 × Marc’s Modified Ringer’s buffer, Sigma-Aldrich) for 2 min to start the biochemical processes of the cell cycle. After a packing step, the activated eggs are crushed in an ultracentrifuge (XPN90, Optima) at 16,000 × g at 2°C for 10 min. This allows the collection of the cytoplasmic fraction to which the protease inhibitors leupeptin, pepstatin and chymostatin (Sigma-Aldrich) are added to a final concentration of 10 µg/mL. Cytochalasin B (10 µg/mL, Sigma-Aldrich) is also added to inhibit actin assembly and thus gelation-contraction, keeping the extract fluid at room temperature (Field et al., 2011).

Finally, the extract is supplemented with GFP-NLS (∼ 25 µM), green fluorescent protein with a nuclear localization signal, and sperm chromatin (using two different concentrations: ∼ 63 or 250 nuclei/µL extract). The construct for GFP-NLS was kindly provided by James Ferrell (Stanford Univ., USA). Sperm chromatin was prepared according the protocol by Murray, 1991. The supplemented extracts are then loaded in Teflon tubes (Cole-Parmer PTFE, 06417–11), through aspiration, and imaged at 24°C on a Leica TCS SPE confocal fluorescence microscope. This approach allows to visualize regular oscillations between interphase and mitotic phase. In interphase, nuclei form spontaneously in the extract supplemented with sperm chromatin. These nuclei then import GFP-NLS (see Box 2). In mitosis, the nuclear envelope breaks down and GFP is no longer localized to nuclei. Here, we use this experimental system to explore the influence of system size by varying the width of the Teflon tubes. The tubes were approximately 100, 200, 300, and 560 µm in width (the actual inner diameters are 102, 203, 305, and 559 µm). Furthermore, we change the amount of nuclear material and its distribution by considering two different concentrations of added sperm chromatin.

In addition, DNA was purified from the sperm chromatin. This was done using a GenElute Mammalian Genomic DNA kit (Sigma-Aldrich), with the use of proteinase K (Sigma-Aldrich) to release the DNA from the histones and give a higher yield. After purification, the concentration of DNA was determined using a NanoDrop spectrophotometer. Purified DNA was added to the extract at final concentrations of 5, 10, 15, 20, 25, 45 and 60 ng/µL.

Nuclear import was inhibited by adding importazole (Sigma-Aldrich), an inhibitor of importin-β transport receptors. Final concentrations of 5, 10, 20, 40, and 60 µM were tested.

Microtubule dynamics was disrupted by adding S-Trityl-L-cysteine (STLC, Acros Organics), a kinesin Eg5 inhibitor. Final concentrations of 10, 20, 30, 40, and 50 µM were tested.

In some of the experiments fluorescent reporters other than GFP-NLS were used. These included a green microtubule reporter (Tubulin porcine HiLyte 488; Cytoskeleton, Inc) at 1 µM final concentration and DNA staining (Hoechst 33342) at 5 µg/mL final concentration.

Image analysis

Microscope data

We used a Leica TCS SPE confocal fluorescence microscope (5x objective) in confocal mode to excite the GFP-NLS with a 488 nm solid state laser, and capture the emission from 493 to 600 nm. In the non-confocal experiments we used the Leica EL6000 metal halide external fluorescence light source for excitation of the fluorophores. The different filter cubes used were the L5 (excitation 480/40 nm bandpass, emission 527/30 nm bandpass) for GFP-NLS and HiLyte Fluor 488; and the A4 (excitation 360/40 nm bandpass, emission 470/40 nm bandpass) for the Hoechst 33342 staining. First, we fixed imaging positions at different (x,y) locations of the Teflon tubes, ensuring overlap between subsequent positions to capture the whole tubes. Within a tube, the z-position was fixed, but could differ between tubes to be able to image the central plane of the tubes. We then captured time-lapse images of these different positions during 18 hr, creating image stacks for each position in a .lif (Leica Image File) format. The .lif files belonging to one tube were then imported in Fiji (Schindelin et al., 2012). The maximum intensity of the different image stacks was put at the same level. Then, using the overlap between subsequent image positions, the image stacks were stitched pairwise (Preibisch et al., 2009). Subsequently, the images were cropped and saved as separate .tiff files per timepoint, an .avi file and a kymograph were made.

Data analysis from images

The .tiff files are imported in Mathematica and for all x the maximum intensity over the width is calculated. This allows us to have a one-dimensional intensity profile for each time, see Figure 1—figure supplement 1C. Kymographs as in Figure 1A and Figure 1—figure supplement 3 were made from these profiles over time. Lines are drawn through the points of mitotic entry (disappearance of nuclei), for every visible cycle. This is done by manually detecting the start- and endpoints of the wave, as depicted in the sketch of Figure 1—figure supplement 1D. The lines are drawn through those points automatically and periods and wave speeds are then calculated based on these lines. The period is calculated by taking 20 points on these lines and determining the time to the next line. This gives an average period (and standard deviation) for each cycle. The wave speed is calculated by taking the derivative of the lines. For the full cycle, the wave speed is only reported if the wave travels a large enough (> 600 µm) distance (to only include well-formed waves and to reduce noise), and if multiple waves are present, the minimum speed is reported. The locations of the nuclei (one-dimensional) are extracted from the kymographs at the last one or two lines (if nuclei are well-separated). For each nucleus the average distance to their neighbors (left and right) is calculated which is also plotted in Figure 1C and Figure 1—figure supplement 3. For the last two cycles, the maximum intensity over the cycle is calculated at every x, yielding an intensity profile at each cycle.

Processing for specific analyses

When calculating properties of individual nuclei (e.g. size, location, intensity), the Ilastik software was used to automatically recognize nuclei in a series of .tiff files. This program relies on machine learning software which makes recognition a lot faster than manual tracking. The files are imported in Ilastik, where we provided three labels (’nucleus’, ’background’ or ’outside of the tube’) to train the implemented random forest classifier to recognize the labels in the images (Sommer et al., 2011). After the training phase, we exported the results as a .hdf5 file, which contains the probability of each pixel to be ’nucleus’, ’background’ and ’outside of the tube’ for each timepoint. The .hdf5 files were imported in Mathematica for further analysis. The data of these files was binarized by defining all pixels with a high probability (≥ 75%) as nuclei (1) and others as background (0). Adjacent pixels were grouped together and the separate groups were recognized as the nuclei. Noise was reduced by ignoring nuclei consisting only of a few pixels. This resulted in a binarized picture, such as in Figure 1—figure supplement 1A. Of all recognized nuclei (orange), information as location (center) and size is extracted with Mathematica. In order to obtain continuous-time kymographs (such as in Figure 1A and Figure 5—figure supplement 1, we overlayed the binarized matrix with the original .tiff and integrated over the width. In this way intensity differences were still visible.

Analysis of the pacemaker strength of internal regions and the boundary regions

The GFP-NLS intensity profile of the experiments is analyzed in order to calculate the strength of the boundary and of internal pacemakers (Figure 5—figure supplement 1 and Figure 5—figure supplement 4). An example of such an intensity profile I(x) is shown in Figure 1—figure supplement 1B. The averaged intensity profile is filtered using a low-pass filter, to obtain a ‘background’ signal y(x). This is the red line in Figure 1—figure supplement 1B. All frequencies higher than a threshold s>0 are filtered out. The obtained background profile y(x) does of course depend on the parameter s. The position of the minimum of y(x) is denoted by x¯, that is

y(x¯)=minx[0,L]y(x). (1)

From the background profile, we calculate two measures L1,R1 for the GFP build-up at the boundary, by

L1=1x¯0x¯(y(x)-y(x¯))𝑑x (2)

and

R1=1L-x¯x¯L(y(x)-y(x¯))𝑑x. (3)

These correspond to the GFP build-up in the blue areas in Figure 5—figure supplement 1.

A second parameter, k>0, is introduced and defines the boundary width. In other words, the intervals [0,k] and [L-k,L] are the boundary domains and [k,L-k] is the internal domain. The background profile y(x) might over- or underestimate GFP build-up in the boundary domains. This is compensated by calculating the second type of measures, L2 and R2. These are defined by

L2=1k0k(I(x)-y(x))𝑑x (4)

and

R2=1kL-kL(I(x)-y(x))𝑑x. (5)

The GFP build-up at the boundary, denoted by Γb, of this intensity profile is now defined as

Γb=max{L1+L2,R1+R2}. (6)

The internal GFP build-up (i.e. by nuclei located internally) is defined by those areas where the intensity I(x) is higher than the background profile y(x). This internal GFP build-up Γi is calculated by

Γi=1L-2kkL-kmax{0,I(x)-y(x)}𝑑x, (7)

which correspond to the orange areas in Figure 5—figure supplement 1.

Figure 5—figure supplement 4 shows the GFP build-up at the boundary and internally, Γi vs. Γb, for 20 experiments. This is done for various values of k and s. Since Γi and Γb depend on these parameters, the figure will change with those parameters. However, we see that qualitatively differences are small.

Data availability

All the data generated during the study are summarized and provided in the manuscript and supporting files. Source files have been provided for Figure 1, Figure 1—figure supplement 4, Figure 2, Figure 5—figure supplement 1, Box 2, Video 1 and Video 2 in the format of microscopy videos. Additionally, representative microscopy videos of all different conditions are provided as a Zenodo dataset (http://doi.org/10.5281/zenodo.3736728). The numerical codes that were used, together with an overview table of the performed experiments, are available through GitHub (Nolet, 2020; copy archived at https://github.com/elifesciences-publications/eLife_paper).

Acknowledgements

We thank Jim Ferrell, Sophie De Buyl, and Jan Rombouts for valuable feedback on the manuscript. We also thank Jonás Noguera López, Ine Vlaeminck and Virginia Tsiouri for their help in the lab and stitching movies. This work was supported by the Research Foundation - Flanders (grant GOA5317N) and the KU Leuven Research Fund (C14/18/084).

Appendix 1

Modeling import and diffusion processes

We have discussed two models of import and diffusion of cell cycle regulators and have shown their results in Figure 3 and Figure 4. Here we elaborate on the model specifics.

A model of import and diffusion of cell cycle regulators with a fixed cell cycle period

We implemented the competing import and diffusion processes through a simple PDE equation that describes the evolution of the concentration C of a nuclear protein:

Ct=D2C+F(t)[(CV)] (8)

with D a diffusion constant, F(t) a periodic function that periodically switches between 0 (in mitosis) and 1 (in interphase),

F(t)={1iftmodT<αT0iftmodTαT (9)

with T the cell cycle period, α the ratio of interphase to the cell cycle period and V=V(x) a potential function to define nuclear attraction at different locations. For simplicity, we use a sum of Gaussian potential wells throughout this work,

V(x)=-ϵi=1N1σ2πe-12σ2(x-ξi)(x-ξi) (10)

with N attracting positions at ξi (the ‘nuclei’), and ϵ,σ>0 parameters that define the amplitude and the width of the potential wells, respectively. The analysis is also repeated with a different potential function, giving qualitatively similar results.

Rewriting the one-dimensional model equation as

Ct=D2Cx2+F(t)(CxVx+C2Vx2) (11)

we decrease numerical errors by explicitly implementing the first and second derivative of V. With basic calculus we find for a Gaussian potential function,

Vx=ϵi=1Nx-ξiσ32πe-12σ2(x-ξi)2 (12)

and

2Vx2=ϵi=1N(1σ32πe-12σ2(x-ξi)2-(x-ξi)2σ52πe-12σ2(x-ξi)2). (13)

For the appropriate boundary conditions we need to calculate the flux. Let J be the flux of C, then we have

Ct+J=0 (14)

and when rewriting the model equation as

Ct=(DC+F(t)CV) (15)

we find the flux to be

J=-(DC+F(t)CV) (16)

and the zero-flux boundary condition is then Jn^=0, with n^ the normal vector at the boundary. In one dimension we will have a boundary condition at x=0 given by

DCx|x=0+F(t)C(0,t)Vx|x=0=0 (17)

for all t and for the numerical derivative of C this becomes

DC(Δx,t)-C(0,t)Δx+F(t)C(0,t)Vx|x=0=0 (18)

where Δx denotes the numerical grid distance. This yields

C(0,t)=DC(Δx,t)D-ΔxF(t)Vx|x=0 (19)

for which we use the explicit formula for Vx. Similarly, one can find at x=L,

C(L,t)=DC(L-Δx,t)D+ΔxF(t)Vx|x=L. (20)

A model of import and diffusion of cell cycle regulators with a concentration-dependent cell cycle period

The previous model is uniform in time, that is the cell cycle is regulated by the function F(t) with a given length of S phase and M phase. Here we let the period of each nucleus depend on the local concentration of cell cycle regulators. This is done by including a separate function F in the potential for every nucleus and letting the period depend on C. This means the period T is not a fixed constant anymore, every nucleus has its own T that depends on C (and therefore on time).

The model equation becomes

Ct=D2C+(CV) (21)

and recall that every nucleus defines a potential Vi(x,t) and together they form the full potential function

V(x,t)=i=1NVi(x,t) (22)

via superposition. The single-nucleus potential can now be written as

Vi(x,t)=Fi(t)Gi(x), (23)

i.e. it can be separated in a time-dependent and a space-dependent function. The function Gi is the same Gaussian well as before, that is

Gi(x)=-βiϵσ2πe-12σ2(x-ξi)(x-ξi) (24)

where σ>0 is a parameter that defines the width of the potential function (i.e. the attraction range of the nucleus) and ϵ>0 is the amplitude of the potential (i.e. the attraction strength). The parameter βi is nucleus-dependent and can be used to give different strengths to different nuclei. Normally, when all nuclei have the same attraction strength, βi=1 for all i. The function Fi regulates the potential over time, essentially by turning it on and off. The definition is

Fi(t)={1iftt0<αTi(t)andtt1(1α)Ti(t)0iftt0αTi(t)andtt1<(1α)Ti(t) (25)

where t0 and t1 are time-dependent via

tk=max{s[0,t]|Fi(s)=k} (26)

for k{0,1}, that is t0 denotes the last t for which Fi(t)=0 and t1 the last t for which Fi(t)=1. Therefore the function depends on its history and we define Fi(0)=1. The parameter 0<α<1 determines the fraction of the cycle where nuclei are in attracting phase. The length of the cycle, denoted by the period function Ti, is not constant but changes in time. This is because it is linked to the concentration at the position ξi of the nucleus via

Ti(t)=T1+γ(C(ξi,t)-C0) (27)

where T is a reference period (chosen the same as in the previous model), C0 a reference concentration and γ is a parameter that determines how strong the period is coupled to the concentration at ξi. This time-dependent period Ti is concentration-dependent (which on itself is time-dependent) and has as a consequence that nuclei with a higher concentration have a shorter period (for γ>0). The underlying biological assumption is that nuclei that import (attract) more cell cycle regulators have a shorter cell cycle length than other nuclei.

Boundary conditions are the same as before. The standard values of the model parameters are given in the table below.

Par. Value Unit
D 600 µm2/min
T 40 min
α 0.7
βi 1
γ 1
C0 1.1
ϵ 4 · 104 µm3/min
σ 60 µm

Appendix 2

Cell cycle models

Biochemical cell cycle oscillator

Mathematically, the cell cycle oscillator (CCO) based on the regulatory network in Figure 4—figure supplement 1A–C can be described using the following ODEs for cyclin B concentrations ([cyc]) and concentrations of the cyclin B-Cdk1 complex in its active state ([cdk1]),

{d[cyc]dt=(a3+b3[cdk1]n3E3n3+[cdk1]n3)[cyc]+kd[cdk1]dt=(a1+b1[cdk1]n1E1n1+[cdk1]n1)([cyc][cdk1])(a2+b2E2n2E2n2+[cdk1]n2) [cdk1](a3+b3[cdk1]n3E3n3+[cdk1]n3)[cdk1]+k (28)

with k the synthesis rate of cyclin B, and ai,bi,Ei,ni parameters corresponding to the influence of Cdc25 (i=1), Wee1 (i=2) and degradation via APC/C (i=3). For a more detailed discussion of this model, including an experimental motivation and/or measurement of the different parameter values, we refer to Chang and Ferrell, 2013 and references therein.

Generic FitzHugh-Nagumo oscillator

Although the CCO model (Equation (28)) includes known biochemical interactions, much of the mitotic wave dynamics solely results from the fact that the cell cycle is driven by a relaxation-type oscillator, such as the generic FHN oscillator (Fitzhugh, 1961). The FHN system was originally constructed as a simplified version of the Hodgkin-Huxley model, describing the activation and deactivation dynamics of a spiking neuron (Hodgkin and Huxley, 1952). Similarly, the FHN model has later been used to describe pulse dynamics in the heart (Aliev and Panfilov, 1996) and cell cycle oscillations (Gelens et al., 2014; Gelens et al., 2015). Using such a simple model to describe complex biological processes has the advantage of being numerically more effective, allowing for analytical estimations, and having fewer parameters.

We use a generalized form of the classical FHN oscillator, including two ODEs for variables u and v,

{dudt=u3+cu2+duvdvdt=ϵ(ubv+a) (29)

with parameters a,b,c,d and ϵ>0. When taking a=c=0, the original FHN equations are recovered. Figure 4—figure supplement 1E,F show that the relaxation oscillations in the FHN are indeed very similar to the cell cycle oscillations, after applying a linear mapping (u,v,t)(-0.19u+0.5,0.32v+0.52,5.75t) (chosen by trial-and-error to obtain visual correspondence).

Spatially extended models

In order to capture spatial dynamics, we extended the CCO model (Equation (28)) and FHN model (Equation (29)) by including free diffusion of proteins (with diffusion constants D10-1000μ µm2/min), leading to the following coupled partial differential equations (PDEs) for the CCO and FHN system, respectively:

{[cyc]t=D2[cyc](a3+b3[cdk1]n3E3n3+[cdk1]n3)[cyc]+k,[cdk1]t=D2[cdk1]+(a1+b1[cdk1]n1E1n1+[cdk1]n1)([cyc][cdk1])(a2+b2E2n2E2n2+[cdk1]n2) [cdk1](a3+b3[cdk1]n3E3n3+[cdk1]n3)[cdk1]+k, (30)

and

{ut=D2uu3+cu2+duv,vt=D2v+ϵ(ubv+a). (31)

Parameter values

Standard parameters of both the CCO (top) and FHN (bottom) models are given in the table below. When other values are used for certain figures, this is stated in the corresponding caption. Note that since the FHN is a dimensionless model, no units are reported.

Parameter Value Unit Parameter Value Unit
a1 0.8 min−1 b1 4 min−1
a2 0.4 min−1 b2 2 min−1
a3 0.01 min−1 b3 0.06 min−1
E1 35 nM n1 11
E2 30 nM n2 3.5
E3 32 nM n3 17
k 1.5 nM/min D 600 µm2/min
a −0.85 b 0.05
c 1.2 d 0.5
ϵ 0.01 D 600

Modeling sweep waves in the FHN model

Sweep waves are caused by moving the nullcline in time, which increases the frequency and can also increase the wave speed in an already oscillating model. In the FHN model, this is implemented by adding an extra term, β, as follows:

{ut=D2uu3+cu2+duvβ,vt=D2v+ϵ(ubv+a). (32)

This term in the u-equation moves the nullcline (Figure 4—figure supplement 1F) to the left for positive β. The term depends on time: it is zero in M phase and increases in S phase. We distinguish two types of sweep waves, local and global. In the local case, β is altered at every x, that is β=β(x,t). In the global case, β only depends on time but is uniform in space. The increase in S phase is with a certain speed, vsweep and β then takes the form β=130vsweept. The fraction 1/30 is for convenience (since the duration of S phase is around 30 min one can easily check how far the nullcline is sweeped).

Funding Statement

The funders had no role in study design, data collection and interpretation, or the decision to submit the work for publication.

Contributor Information

Lendert Gelens, Email: lendert.gelens@kuleuven.be.

Stefano Di Talia, Duke University, United States.

Naama Barkai, Weizmann Institute of Science, Israel.

Funding Information

This paper was supported by the following grants:

  • Research Foundation - Flanders GOA5317N to Lendert Gelens.

  • KU Leuven Research Fund C14/18/084 to Lendert Gelens.

Additional information

Competing interests

No competing interests declared.

Author contributions

Data curation, Software, Formal analysis, Validation, Investigation, Visualization, Methodology, Writing - review and editing, Carried out the modeling and simulation work, and the analysis of the experimental data.

Validation, Investigation, Methodology, Writing - review and editing, Set up and carried out most of the experiments for the first submission.

Data curation, Validation, Investigation, Methodology, Writing - review and editing, Carried out part of the experiments, in particular for the revisions.

Data curation, Investigation, Methodology, Writing - review and editing, Carried out part of the experiments, in particular for the revisions.

Conceptualization, Validation, Investigation, Methodology, Writing - review and editing, Initial experimental work with droplets of cell-free extracts, which helped trigger this project.

Conceptualization, Resources, Supervision, Funding acquisition, Visualization, Methodology, Writing - original draft, Project administration, Writing - review and editing.

Ethics

Animal experimentation: This study was performed in strict accordance with the recommendations in the Guide for the Care and Use of Laboratory Animals of the KU Leuven. All of the animals were handled according to approved institutional animal care and use committee (IACUC) protocols of the KU Leuven. The protocol was approved by the Committee on the Ethics of Animal Experiments of the KU Leuven (ECD permit Number: P165/2016/).

Additional files

Transparent reporting form

Data availability

All the data generated during the study are summarized and provided in the manuscript and supporting files. Source files have been provided for Figure 1, Figure 1-figure supplement 3, Figure 2, Figure 5-figure supplement 1, Box 2, Video 1 and Video 2 in the format of microscopy videos. Additionally, representative microscopy videos of all different conditions are provided as a Zenodo dataset (http://doi.org/10.5281/zenodo.3736728). The numerical codes that were used, together with an overview table of the performed experiments, are available through GitHub (https://github.com/felixnolet/eLife_paper; copy archived at https://github.com/elifesciences-publications/eLife_paper).

The following dataset was generated:

Nolet FE, Vandervelde A, Vanderbeke A, Pineros L, Chang JB, Gelens L. 2020. Nuclei determine the spatial origin of mitotic waves. Zenodo.

References

  1. Aliev RR, Panfilov AV. A simple two-variable model of cardiac excitation. Chaos, Solitons & Fractals. 1996;7:293–301. doi: 10.1016/0960-0779(95)00089-5. [DOI] [Google Scholar]
  2. Anderson GA, Gelens L, Baker JC, Ferrell JE. Desynchronizing embryonic cell division waves reveals the robustness of Xenopus laevis development. Cell Reports. 2017;21:37–46. doi: 10.1016/j.celrep.2017.09.017. [DOI] [PMC free article] [PubMed] [Google Scholar]
  3. Arnold L, Höckner S, Seufert W. Insights into the cellular mechanism of the yeast ubiquitin ligase APC/C-Cdh1 from the analysis of in vivo degrons. Molecular Biology of the Cell. 2015;26:843–858. doi: 10.1091/mbc.E14-09-1342. [DOI] [PMC free article] [PubMed] [Google Scholar]
  4. Baldin V, Ducommun B. Subcellular localisation of human wee1 kinase is regulated during the cell cycle. Journal of Cell Science. 1995;108 ( Pt 6:2425–2432. doi: 10.1242/jcs.108.6.2425. [DOI] [PubMed] [Google Scholar]
  5. Bement WM, Leda M, Moe AM, Kita AM, Larson ME, Golding AE, Pfeuti C, Su KC, Miller AL, Goryachev AB, von Dassow G. Activator-inhibitor coupling between rho signalling and actin assembly makes the cell cortex an excitable medium. Nature Cell Biology. 2015;17:1471–1483. doi: 10.1038/ncb3251. [DOI] [PMC free article] [PubMed] [Google Scholar]
  6. Bernitt E, Döbereiner HG, Gov NS, Yochelis A. Fronts and waves of actin polymerization in a bistability-based mechanism of circular dorsal ruffles. Nature Communications. 2017;8:15863. doi: 10.1038/ncomms15863. [DOI] [PMC free article] [PubMed] [Google Scholar]
  7. Beta C, Kruse K. Intracellular oscillations and waves. Annual Review of Condensed Matter Physics. 2017;8:239–264. doi: 10.1146/annurev-conmatphys-031016-025210. [DOI] [Google Scholar]
  8. Bonnet J, Coopman P, Morris MC. Characterization of centrosomal localization and dynamics of Cdc25C phosphatase in mitosis. Cell Cycle. 2008;7:1991–1998. doi: 10.4161/cc.7.13.6095. [DOI] [PubMed] [Google Scholar]
  9. Brown RC, Lemmon BE, Nguyen H. Events during the first four rounds of mitosis establish three developmental domains in the syncytial endosperm of Arabidopsis thaliana. Protoplasma. 2003;222:167–174. doi: 10.1007/s00709-003-0010-x. [DOI] [PubMed] [Google Scholar]
  10. Bub G, Shrier A, Glass L. Spiral wave generation in heterogeneous excitable media. Physical Review Letters. 2002;88:058101. doi: 10.1103/PhysRevLett.88.058101. [DOI] [PubMed] [Google Scholar]
  11. Bub G, Shrier A, Glass L. Global organization of dynamics in oscillatory heterogeneous excitable media. Physical Review Letters. 2005;94:028105. doi: 10.1103/PhysRevLett.94.028105. [DOI] [PubMed] [Google Scholar]
  12. Bugrim AE, Dolnik M, Zhabotinsky AM, Epstein IR. Heterogeneous sources of target patterns in reaction−diffusion systems. The Journal of Physical Chemistry. 1996;100:19017–19022. doi: 10.1021/jp961603t. [DOI] [Google Scholar]
  13. Caspi Y, Dekker C. Mapping out min protein patterns in fully confined fluidic chambers. eLife. 2016;5:e19271. doi: 10.7554/eLife.19271. [DOI] [PMC free article] [PubMed] [Google Scholar]
  14. Chang JB, Ferrell JE. Mitotic trigger waves and the spatial coordination of the Xenopus cell cycle. Nature. 2013;500:603–607. doi: 10.1038/nature12321. [DOI] [PMC free article] [PubMed] [Google Scholar]
  15. Chang JB, Ferrell JE. Robustly cycling Xenopus laevis Cell-Free Extracts in Teflon Chambers. Cold Spring Harbor Protocols. 2018;2018:pdb.prot097212. doi: 10.1101/pdb.prot097212. [DOI] [PubMed] [Google Scholar]
  16. Chen J, Lippincott-Schwartz J, Liu J. Intracellular spatial localization regulated by the microtubule network. PLOS ONE. 2012;7:e34919. doi: 10.1371/journal.pone.0034919. [DOI] [PMC free article] [PubMed] [Google Scholar]
  17. Cheng X, Ferrell JE. Apoptosis propagates through the cytoplasm as trigger waves. Science. 2018;361:607–612. doi: 10.1126/science.aah4065. [DOI] [PMC free article] [PubMed] [Google Scholar]
  18. Cheng X, Ferrell JE. Spontaneous emergence of cell-like organization in Xenopus egg extracts. Science. 2019;366:631–637. doi: 10.1126/science.aav7793. [DOI] [PMC free article] [PubMed] [Google Scholar]
  19. Cross MC, Hohenberg PC. Pattern formation outside of equilibrium. Reviews of Modern Physics. 1993;65:851–1112. doi: 10.1103/RevModPhys.65.851. [DOI] [Google Scholar]
  20. Dasso M, Newport JW. Completion of DNA replication is monitored by a feedback system that controls the initiation of mitosis in vitro: studies in Xenopus. Cell. 1990;61:811–823. doi: 10.1016/0092-8674(90)90191-G. [DOI] [PubMed] [Google Scholar]
  21. Dawson SP, Keizer J, Pearson JE. Fire-diffuse-fire model of dynamics of intracellular calcium waves. PNAS. 1999;96:6060–6063. doi: 10.1073/pnas.96.11.6060. [DOI] [PMC free article] [PubMed] [Google Scholar]
  22. Deneke VE, Melbinger A, Vergassola M, Di Talia S. Waves of Cdk1 activity in S phase synchronize the cell cycle in Drosophila Embryos. Developmental Cell. 2016;38:399–412. doi: 10.1016/j.devcel.2016.07.023. [DOI] [PMC free article] [PubMed] [Google Scholar]
  23. Deneke VE, Puliafito A, Krueger D, Narla AV, De Simone A, Primo L, Vergassola M, De Renzis S, Di Talia S. Self-Organized nuclear positioning synchronizes the cell cycle in Drosophila embryos. Cell. 2019;177:925–941. doi: 10.1016/j.cell.2019.03.007. [DOI] [PMC free article] [PubMed] [Google Scholar]
  24. Deneke VE, Di Talia S. Chemical waves in cell and developmental biology. Journal of Cell Biology. 2018;217:1193–1204. doi: 10.1083/jcb.201701158. [DOI] [PMC free article] [PubMed] [Google Scholar]
  25. Farrell JA, O'Farrell PH. From egg to gastrula: how the cell cycle is remodeled during the Drosophila mid-blastula transition. Annual Review of Genetics. 2014;48:269–294. doi: 10.1146/annurev-genet-111212-133531. [DOI] [PMC free article] [PubMed] [Google Scholar]
  26. Field CM, Wühr M, Anderson GA, Kueh HY, Strickland D, Mitchison TJ. Actin behavior in bulk cytoplasm is cell cycle regulated in early vertebrate embryos. Journal of Cell Science. 2011;124:2086–2095. doi: 10.1242/jcs.082263. [DOI] [PMC free article] [PubMed] [Google Scholar]
  27. Fitzhugh R. Impulses and physiological states in theoretical models of nerve membrane. Biophysical Journal. 1961;1:445–466. doi: 10.1016/S0006-3495(61)86902-6. [DOI] [PMC free article] [PubMed] [Google Scholar]
  28. Foe VE, Alberts BM. Studies of nuclear and cytoplasmic behaviour during the five mitotic cycles that precede gastrulation in Drosophila embryogenesis. Journal of Cell Science. 1983;61:31–70. doi: 10.1242/jcs.61.1.31. [DOI] [PubMed] [Google Scholar]
  29. Fox DT, Duronio RJ. Endoreplication and polyploidy: insights into development and disease. Development. 2013;140:3–12. doi: 10.1242/dev.080531. [DOI] [PMC free article] [PubMed] [Google Scholar]
  30. Fukujin F, Nakajima A, Shimada N, Sawai S. Self-organization of chemoattractant waves in Dictyostelium depends on F-actin and cell–substrate adhesion. Journal of the Royal Society Interface. 2016;13:20160233. doi: 10.1098/rsif.2016.0233. [DOI] [PMC free article] [PubMed] [Google Scholar]
  31. Gavet O, Pines J. Activation of cyclin B1-Cdk1 synchronizes events in the nucleus and the cytoplasm at mitosis. The Journal of Cell Biology. 2010;189:247–259. doi: 10.1083/jcb.200909144. [DOI] [PMC free article] [PubMed] [Google Scholar]
  32. Gelens L, Anderson GA, Ferrell JE. Spatial trigger waves: positive feedback gets you a long way. Molecular Biology of the Cell. 2014;25:3486–3493. doi: 10.1091/mbc.e14-08-1306. [DOI] [PMC free article] [PubMed] [Google Scholar]
  33. Gelens L, Huang KC, Ferrell JE. How does the Xenopus laevis embryonic cell cycle avoid spatial Chaos? Cell Reports. 2015;12:892–900. doi: 10.1016/j.celrep.2015.06.070. [DOI] [PMC free article] [PubMed] [Google Scholar]
  34. Good MC, Vahey MD, Skandarajah A, Fletcher DA, Heald R. Cytoplasmic volume modulates spindle size during embryogenesis. Science. 2013;342:856–860. doi: 10.1126/science.1243147. [DOI] [PMC free article] [PubMed] [Google Scholar]
  35. Guan Y, Li Z, Wang S, Barnes PM, Liu X, Xu H, Jin M, Liu AP, Yang Q. A robust and tunable mitotic oscillator in artificial cells. eLife. 2018;7:e33549. doi: 10.7554/eLife.33549. [DOI] [PMC free article] [PubMed] [Google Scholar]
  36. Hagan PS. Target patterns in reaction-diffusion systems. Advances in Applied Mathematics. 1981;2:400–416. doi: 10.1016/0196-8858(81)90042-7. [DOI] [Google Scholar]
  37. Haim D, Li G, Ouyang Q, McCormick WD, Swinney HL, Hagberg A, Meron E. Breathing spots in a Reaction-Diffusion system. Physical Review Letters. 1996;77:190–193. doi: 10.1103/PhysRevLett.77.190. [DOI] [PubMed] [Google Scholar]
  38. Hara Y, Merten CA. Dynein-Based accumulation of membranes regulates nuclear expansion in Xenopus laevis egg extracts. Developmental Cell. 2015;33:562–575. doi: 10.1016/j.devcel.2015.04.016. [DOI] [PubMed] [Google Scholar]
  39. Hazel J, Krutkramelis K, Mooney P, Tomschik M, Gerow K, Oakey J, Gatlin JC. Changes in cytoplasmic volume are sufficient to drive spindle scaling. Science. 2013;342:853–856. doi: 10.1126/science.1243110. [DOI] [PMC free article] [PubMed] [Google Scholar]
  40. Hodgkin AL, Huxley AF. A quantitative description of membrane current and its application to conduction and excitation in nerve. The Journal of Physiology. 1952;117:500–544. doi: 10.1113/jphysiol.1952.sp004764. [DOI] [PMC free article] [PubMed] [Google Scholar]
  41. Hu Z, Lutkenhaus J. Topological regulation of cell division in Escherichia coli involves rapid pole to pole oscillation of the division inhibitor MinC under the control of MinD and MinE. Molecular Microbiology. 1999;34:82–90. doi: 10.1046/j.1365-2958.1999.01575.x. [DOI] [PubMed] [Google Scholar]
  42. Huang J, Raff JW. The disappearance of cyclin B at the end of mitosis is regulated spatially in Drosophila cells. The EMBO Journal. 1999;18:2184–2195. doi: 10.1093/emboj/18.8.2184. [DOI] [PMC free article] [PubMed] [Google Scholar]
  43. Ishihara K, Nguyen PA, Wühr M, Groen AC, Field CM, Mitchison TJ. Organization of early frog embryos by chemical waves emanating from centrosomes. Philosophical Transactions of the Royal Society B: Biological Sciences. 2014;369:20130454. doi: 10.1098/rstb.2013.0454. [DOI] [PMC free article] [PubMed] [Google Scholar]
  44. Jackman M, Lindon C, Nigg EA, Pines J. Active cyclin B1-Cdk1 first appears on centrosomes in prophase. Nature Cell Biology. 2003;5:143–148. doi: 10.1038/ncb918. [DOI] [PubMed] [Google Scholar]
  45. Jakubith S, Rotermund HH, Engel W, von Oertzen A, Ertl G. Spatiotemporal concentration patterns in a surface reaction: propagating and standing waves, rotating spirals, and turbulence. Physical Review Letters. 1990;65:3013–3016. doi: 10.1103/PhysRevLett.65.3013. [DOI] [PubMed] [Google Scholar]
  46. Kheowan OU, Mihaliuk E, Blasius B, Sendiña-Nadal I, Showalter K. Wave mediated synchronization of nonuniform oscillatory media. Physical Review Letters. 2007;98:074101. doi: 10.1103/PhysRevLett.98.074101. [DOI] [PubMed] [Google Scholar]
  47. Kopell N. Target pattern solutions to reaction-diffusion equations in the presence of impurities. Advances in Applied Mathematics. 1981;2:389–399. doi: 10.1016/0196-8858(81)90041-5. [DOI] [Google Scholar]
  48. Kopell N, Ermentrout GB, Williams TL. On chains of oscillators forced at one end. SIAM Journal on Applied Mathematics. 1991;51:1397–1417. doi: 10.1137/0151070. [DOI] [Google Scholar]
  49. Kuramoto Y. Chemical Oscillations, Waves, and Turbulence. Berlin: Springer-Verlag; 1984. [DOI] [Google Scholar]
  50. Landing BH, Dixon LG, Wells TR. Studies on isolated human skeletal muscle fibers, including a proposed pattern of nuclear distribution and a concept of nuclear territories. Human Pathology. 1974;5:441–461. doi: 10.1016/S0046-8177(74)80023-7. [DOI] [PubMed] [Google Scholar]
  51. Lee KJ, Cox EC, Goldstein RE. Competing patterns of signaling activity in Dictyostelium discoideum. Physical Review Letters. 1996;76:1174–1177. doi: 10.1103/PhysRevLett.76.1174. [DOI] [PubMed] [Google Scholar]
  52. Loose M, Fischer-Friedrich E, Ries J, Kruse K, Schwille P. Spatial regulators for bacterial cell division self-organize into surface waves in vitro. Science. 2008;320:789–792. doi: 10.1126/science.1154413. [DOI] [PubMed] [Google Scholar]
  53. Männik J, Wu F, Hol FJ, Bisicchia P, Sherratt DJ, Keymer JE, Dekker C. Robustness and accuracy of cell division in Escherichia coli in diverse cell shapes. PNAS. 2012;109:6957–6962. doi: 10.1073/pnas.1120854109. [DOI] [PMC free article] [PubMed] [Google Scholar]
  54. McNamara HM, Zhang H, Werley CA, Cohen AE. Optically controlled oscillators in an engineered bioelectric tissue. Physical Review X. 2016;6:031001. doi: 10.1103/PhysRevX.6.031001. [DOI] [Google Scholar]
  55. Mikhailov AS, Engel A. Multiple target pattern creation and synchronization phenomena. Physics Letters A. 1986;117:257–260. doi: 10.1016/0375-9601(86)90088-5. [DOI] [Google Scholar]
  56. Murray AW. In: Methods in Cell Biology. Kay B. K, Peng H. B, editors. Vol. 36. Academic Press; 1991. Cell Cycle Extracts; pp. 581–605. [DOI] [PubMed] [Google Scholar]
  57. Newmeyer DD, Lucocq JM, Bürglin TR, De Robertis EM. Assembly in vitro of nuclei active in nuclear protein transport: atp is required for nucleoplasmin accumulation. The EMBO Journal. 1986;5:501–510. doi: 10.1002/j.1460-2075.1986.tb04239.x. [DOI] [PMC free article] [PubMed] [Google Scholar]
  58. Newport J, Dasso M. On the coupling between DNA replication and mitosis. Journal of Cell Science. 1989;1989:149–160. doi: 10.1242/jcs.1989.Supplement_12.13. [DOI] [PubMed] [Google Scholar]
  59. Nolet FE. Github repository for elife paper. b9678faGithub. 2020 https://github.com/felixnolet/eLife_paper
  60. Novak B, Tyson JJ. Modeling the cell division cycle: m-phase trigger, oscillations, and size control. Journal of Theoretical Biology. 1993;165:101–134. doi: 10.1006/jtbi.1993.1179. [DOI] [Google Scholar]
  61. Olivier N, Luengo-Oroz MA, Duloquin L, Faure E, Savy T, Veilleux I, Solinas X, Débarre D, Bourgine P, Santos A, Peyriéras N, Beaurepaire E. Cell lineage reconstruction of early zebrafish embryos using label-free nonlinear microscopy. Science. 2010;329:967–971. doi: 10.1126/science.1189428. [DOI] [PubMed] [Google Scholar]
  62. Ondracka A, Dudin O, Ruiz-Trillo I. Decoupling of nuclear division cycles and cell size during the coenocytic growth of the ichthyosporean Sphaeroforma arctica. Current Biology. 2018;28:1964–1969. doi: 10.1016/j.cub.2018.04.074. [DOI] [PMC free article] [PubMed] [Google Scholar]
  63. Preibisch S, Saalfeld S, Tomancak P. Globally optimal stitching of tiled 3D microscopic image acquisitions. Bioinformatics. 2009;25:1463–1465. doi: 10.1093/bioinformatics/btp184. [DOI] [PMC free article] [PubMed] [Google Scholar]
  64. Prindle A, Liu J, Asally M, Ly S, Garcia-Ojalvo J, Süel GM. Ion channels enable electrical communication in bacterial communities. Nature. 2015;527:59–63. doi: 10.1038/nature15709. [DOI] [PMC free article] [PubMed] [Google Scholar]
  65. Rabinovitch A, Gutman M, Aviram I. Inwards propagating waves in a limit cycle medium. Physical Review Letters. 2001;87:084101. doi: 10.1103/PhysRevLett.87.084101. [DOI] [PubMed] [Google Scholar]
  66. Raskin DM, de Boer PA. Rapid pole-to-pole oscillation of a protein required for directing division to the middle of Escherichia coli. PNAS. 1999;96:4971–4976. doi: 10.1073/pnas.96.9.4971. [DOI] [PMC free article] [PubMed] [Google Scholar]
  67. Santos SD, Wollman R, Meyer T, Ferrell JE. Spatial positive feedback at the onset of mitosis. Cell. 2012;149:1500–1513. doi: 10.1016/j.cell.2012.05.028. [DOI] [PMC free article] [PubMed] [Google Scholar]
  68. Schindelin J, Arganda-Carreras I, Frise E, Kaynig V, Longair M, Pietzsch T, Preibisch S, Rueden C, Saalfeld S, Schmid B, Tinevez JY, White DJ, Hartenstein V, Eliceiri K, Tomancak P, Cardona A. Fiji: an open-source platform for biological-image analysis. Nature Methods. 2012;9:676–682. doi: 10.1038/nmeth.2019. [DOI] [PMC free article] [PubMed] [Google Scholar]
  69. Sears JR. Mitotic waves in the green alga Blastophysa rhizopus as related to coenocyte form(1) Journal of Phycology. 1967;3:136–139. doi: 10.1111/j.1529-8817.1967.tb04647.x. [DOI] [PubMed] [Google Scholar]
  70. Sommer C, Strähle C, Köthe U, Hamprecht FA. Ilastik: interactive learning and segmentation toolkit. in:biomedical imaging: from nano to macro, 2011. IEEE International Symposium on IEEE; 2011. [DOI] [Google Scholar]
  71. Stich M, Mikhailov AS. Target patterns in two-dimensional heterogeneous oscillatory reaction–diffusion systems. Physica D: Nonlinear Phenomena. 2006;215:38–45. doi: 10.1016/j.physd.2006.01.011. [DOI] [Google Scholar]
  72. Stricker SA. Comparative biology of calcium signaling during fertilization and egg activation in animals. Developmental Biology. 1999;211:157–176. doi: 10.1006/dbio.1999.9340. [DOI] [PubMed] [Google Scholar]
  73. Telley IA, Gáspár I, Ephrussi A, Surrey T. Aster migration determines the length scale of nuclear separation in the Drosophila syncytial embryo. The Journal of Cell Biology. 2012;197:887–895. doi: 10.1083/jcb.201204019. [DOI] [PMC free article] [PubMed] [Google Scholar]
  74. Tsai TY, Theriot JA, Ferrell JE. Changes in Oscillatory dynamics in the cell cycle of early Xenopus laevis embryos. PLOS Biology. 2014;12:e1001788. doi: 10.1371/journal.pbio.1001788. [DOI] [PMC free article] [PubMed] [Google Scholar]
  75. Tyson JJ, Fife PC. Target patterns in a realistic model of the Belousov–Zhabotinskii reaction. The Journal of Chemical Physics. 1980;73:2224–2237. doi: 10.1063/1.440418. [DOI] [Google Scholar]
  76. Tyson JJ, Keener JP. Singular perturbation theory of traveling waves in excitable media (a review) Physica D: Nonlinear Phenomena. 1988;32:327–361. doi: 10.1016/0167-2789(88)90062-0. [DOI] [Google Scholar]
  77. Vergassola M, Deneke VE, Di Talia S. Mitotic waves in the early embryogenesis of Drosophila : Bistability traded for speed. PNAS. 2018;115:E2165–E2174. doi: 10.1073/pnas.1714873115. [DOI] [PMC free article] [PubMed] [Google Scholar]
  78. Vidal-Henriquez E, Zykov V, Bodenschatz E, Gholami A. Convective instability and boundary driven oscillations in a reaction-diffusion-advection model. Chaos: An Interdisciplinary Journal of Nonlinear Science. 2017;27:103110. doi: 10.1063/1.4986153. [DOI] [PubMed] [Google Scholar]
  79. Vidal-Henriquez E, Gholami A. Spontaneous center formation in Dictyostelium discoideum. Scientific Reports. 2019;9:3935. doi: 10.1038/s41598-019-40373-4. [DOI] [PMC free article] [PubMed] [Google Scholar]
  80. Walgraef D, Dewel G, Borckmans P. Chemical waves in a two‐dimensional oscillating system. The Journal of Chemical Physics. 1983;78:3043–3051. doi: 10.1063/1.445266. [DOI] [Google Scholar]
  81. Wettmann L, Bonny M, Kruse K. Effects of geometry and topography on Min-protein dynamics. PLOS ONE. 2018;13:e0203050. doi: 10.1371/journal.pone.0203050. [DOI] [PMC free article] [PubMed] [Google Scholar]
  82. Winfree A. When Time Breaks Down: The Three-Dimensional Dynamics of Chemical Waves and Cardiac Arrhythmias. Princeton, NJ: Princeton University Press; 1987. [DOI] [Google Scholar]
  83. Wu F, van Schie BG, Keymer JE, Dekker C. Symmetry and scale orient min protein patterns in shaped bacterial sculptures. Nature Nanotechnology. 2015;10:719–726. doi: 10.1038/nnano.2015.126. [DOI] [PMC free article] [PubMed] [Google Scholar]
  84. Zaikin AN, Zhabotinsky AM. Concentration wave propagation in two-dimensional liquid-phase self-oscillating system. Nature. 1970;225:535–537. doi: 10.1038/225535b0. [DOI] [PubMed] [Google Scholar]
  85. Zhabotinsky AM, Zaikin AN. Autowave processes in a distributed chemical system. Journal of Theoretical Biology. 1973;40:45–61. doi: 10.1016/0022-5193(73)90164-1. [DOI] [PubMed] [Google Scholar]
  86. Zieske K, Chwastek G, Schwille P. Protein Patterns and Oscillations on Lipid Monolayers and in Microdroplets. Angewandte Chemie International Edition. 2016;55:13455–13459. doi: 10.1002/anie.201606069. [DOI] [PMC free article] [PubMed] [Google Scholar]
  87. Zieske K, Schwille P. Reconstitution of self-organizing protein gradients as spatial cues in cell-free systems. eLife. 2014;3:e03949. doi: 10.7554/eLife.03949. [DOI] [PMC free article] [PubMed] [Google Scholar]

Decision letter

Editor: Stefano Di Talia1
Reviewed by: William M Bement2

In the interests of transparency, eLife publishes the most substantive revision requests and the accompanying author responses.

Thank you for submitting your article "Nuclei and spatial dimensions determine pacemaker location in mitotic waves" for consideration by eLife. Your article has been reviewed by three peer reviewers, one of whom is a member of our Board of Reviewing Editors, and the evaluation has been overseen by Naama Barkai as the Senior Editor. The following individual involved in review of your submission has agreed to reveal their identity: William M Bement (Reviewer #2).

The reviewers have discussed the reviews with one another and the Reviewing Editor has drafted this decision to help you prepare a revised submission.

Summary:

The manuscript by Nolet et al. addresses an interesting scientific question, i.e. what sets the location where Cdk1 signaling waves start. Using Xenopus extracts, the authors propose that the efficiency of nuclear import and the geometry of the system are major parameters controlling the position where waves start. These insights are in principle interesting. However, there are significant concerns that must be addressed before the paper can be re-evaluated.

Essential revisions:

1) Biological Significance. It is unclear what the biological significance of the presented results is. The proposal that the experiments will apply to Drosophila embryos is complicated by several observations in that system that argue for significant differences from your results: a) Cdk1 waves are not trigger waves in fly embryos (Vergassola et al., 2018); b) the correlation length of the field of Cdk1 activity (~100 microns) is significantly larger than internuclear distance (<10 micron) suggesting that nuclei are unlikely to act in isolation in that system; c) the local nuclear-to-cytoplasmic ratio is important for timing the cell cycle. Thus, we recommend that you propose other possible in vivo applications of your insights from in vitro experiments.

2) Evidence for nuclei acting as pacemakers. The evidence that nuclei act as a pacemaker should be strengthened. There are several suggestions from the reviewers. While answering all the criticism might not be necessary, we would like you to address the main concerns of reviewer 2, as well as provide evidence that nuclear brightness is a better predictor of wave initiation than a measurement of the nuclear-to-cytoplasmic ratio (for example you could divide the extract in cell-like domains by some geometric tessellation and check whether nuclear brightness is a better predictor of wave initiation than the size of the cell-like domain). While FRAP experiments would be a great quantitative test of nuclear import/export parameters, they are not necessary if you lack the setup for performing them.

3) Theoretical analysis. Reviewer 3 raises several theoretical questions that should be dealt with.

Reviewer #1:

Signaling waves are emerging as a general mechanism of regulation of biological processes. Among them, mitotic waves in early embryos are particularly interesting as they are both functionally important and a great system for quantitative dissection of the mechanisms of the waves. The paper by Nolet and collaborators addresses the mechanisms by which certain regions can emerge as pacemakers in large spatial systems. The authors use the Xenopus extract system which is able to undergo repeated cell cycles which organize in mitotic waves. The authors argue for two major conclusions: waves tend to start at nuclei that are more efficient at nuclear import; spatial dimensions influence whether waves tend to start near the boundary or in the middle of the domain. These are in principle interesting observations, but this paper suffers from significant limitations that need to be addressed. Specifically the significance of their in vitro findings for in vivo systems is unclear and the experimental analysis could be strengthen by more quantifications and additional experiments.

1) While the experiments presented in this paper are well-executed, their relevance to in vivo systems remain unclear. The authors speculate that their results could explain the origin of waves in Drosophila embryos. However, this proposal is problematic and it is important that the authors address the fact that mitotic waves in Drosophila are not trigger waves (Vergassola et al., 2018). The authors need to study wave origin in the context of the mechanism proposed by Vergassola et al. if they wanted to make claims about the Drosophila embryo. Also notice that the inter-nuclear distances in these two systems are significantly different. Overall, I am very skeptical that one can generalize the findings of this paper to the fly embryo.

2) The authors make the claim on more efficient nuclear import based on nuclear fluorescent intensity. However, it is my impression that many of the nuclei in the system do not separate following mitosis suggesting that these nuclei might ultimately become polyploid. So, I find nuclear fluorescence and intensity difficult to interpret. A better test of the nuclear import efficiency would be to use FRAP to measure the kinetic parameters of nuclear import and export. It would also be important to test how large the difference in nuclear import need to be to impact cell cycle durations. It is unclear how physiological nuclear dynamics is in the egg extract. Finally, it is in principle possible that the cell cycle influences nuclear import and vice versa. This would leave a bit of chicken/egg problem. Is nuclear import causing faster cell cycles or is higher nuclear import a consequence of the faster cell cycles? This paper presents no attempt at manipulating nuclear inputs or cell cycle duration. It should be possible to gain some insights with pharmacological perturbations.

3) An interesting observation of this paper is that as the size of the tube is increased the number of waves starting at the boundary also increases. The authors propose that this corresponds to nuclei of higher intensity preferentially localizing close to the boundary, due to a geometrical effect causing higher competition among internal nuclei for import. The authors should present a clear analysis of the effects of nuclear density on the observed waves, as the nuclear-to-cytoplasmic ratio can influence cell cycle duration. Also, they do not report cell cycle durations and wave speeds in all the experiments with tubes of different geometry (I only found such data in the supplement for tubes of 100 micron). In the example shown in Figure 5, the cell cycle seems to lengthen in the small tube (as shown in the supplement) while it seems of constant duration in the large tube. Is that true? The authors should do more quantification of their data to provide arguments against alternative hypotheses. At this point, I remain a bit worried that there could be other explanations for the observed phenomena.

Reviewer #2:

Cyclin dependent kinase 1 (Cdk1) controls the entry into and exit from mitosis in eukaryotes. Previous studies from the Ferrell lab using frog egg extracts seeded with demembranated sperm (to serve as sources of DNA for nucleus assembly) demonstrated that Cdk1 activation proceeds as a bistable trigger wave through the extracts, providing an explanation for how the mitotic state is spatially coordinated. In the current study, Nolet et al. have used a similar approach to probe the relationship between nuclei, space and the organization of the Cdk1 trigger waves. They report that Cdk1 trigger waves often arise near particularly bright nuclei. From this they conclude that a) nuclei serve as pacemakers for trigger wave formation and b) that nuclei that are especially efficient at import are likely to serve as pacemakers. Both of these ideas are plausible, in that the nucleus is well-known to concentrate a variety of essential Cdk1 regulators. By a combination of modeling and experimental manipulation the authors further show that the spatial organization of the extract matters, with increased volume altering the distribution of pacemakers.

The findings of this study are important for at least two reasons. First, while nuclei are good candidates for pacemakers, their role in this capacity has yet to be empirically demonstrated (although the analysis of surface contraction waves in activated Xenopus eggs by Chang and Ferrell, 2013, makes a pretty strong case for nuclei as sites of Cdk1 wave initiation). Second, the relationship between pacemaker distribution and extract volume is a fascinating demonstration of the kind of nonintuitive but important emergent behaviors that can arise when dealing with bistable dynamics.

However, several points need to be addressed before the conclusions reached can be accepted. These are listed below:

The authors report "We noticed that the mitotic waves often originate close to nuclei that are considerably brighter than the surrounding nuclei (Figure 2A-C). We therefore hypothesized that a region with higher GFP-NLS intensity correlates with a higher local oscillation frequency, serving as a pacemaker that organizes the mitotic wave (Figure 2C). As a brighter nucleus is more efficient in the uptake of GFP-NLS, we reasoned that it similarly concentrates cell cycle regulators that lead to a local increase in the cell cycle frequency".

The study hinges upon the assumptions and conclusions implicit and explicit in these three sentences. It therefore follows that those assumptions and conclusions need to be well supported. The following suggestions are intended to help the authors provide such support.

"Often" and "brighter" are subjective terms. The definition of bright needs to be quantitatively established, as does the definition often, particularly as inspection of the data in Figure 2—figure supplement 5 provides as many clear examples of dim nuclei apparently acting as pacemakers (using the author's criteria) as bright nuclei acting as pacemakers, as well as examples of bright nuclei that do not apparently act as pacemakers. Ideally, the authors would provide a plot of nuclear GFP signal (normalized against a DNA marker such as DAPI) versus the number or frequency of trigger wave initiation associated with the nuclei.

Increased nuclear brightness may imply more efficient nuclear import but it may also imply greater age (and indeed, some of bright nuclei appear to have been around longer than their neighbors). It may also imply greater volume. That is, the kind of fluorescence imaging employed in these experiments is inherently nonlinear, and as a result, smaller nuclei may appear less bright simply because they have less GFP-NLS rather than less concentrated GFP-NLS. While one might imagine that all of the nuclei should be the same size, the standard preparation of demembranated sperm for egg extract studies often results in a population of samples that contains both intact and fragmented sperm. The authors could address their proposal that import efficiency is important by the application of pharmacological import inhibitors (along with a direct marker for DNA such as DAPI) which would, if their model is right, perturb the normal pattern or number of pacemakers. This would require a different marker for cell cycle progression, a point addressed below.

Ideally, testing the role of nuclei as pacemakers would entail a marker of mitotic entry that does not rely on the nuclei themselves. Three possibilities present themselves: The first is the FRET-based Cdk1 activity probe developed by the Pines lab. However, it may have insufficient spatial resolution for these studies. The second would be a microtubule probe, such as fluorescent tubulin or one of the commercially-available, fluorescent taxol derivatives (e.g. SiR-tubulin). Microtubule growth in M-phase extracts is limited but quite robust in interphase extracts. The third would be a probe for F-actin as it has been shown that M-phase extracts differ in their organization of F-actin than Interphase-arrested extracts (Field et al., 2011). This isn't to imply that the authors would need to repeat all of their experiments with a nucleus-independent cell cycle marker, but rather that they could simply run the basic assay in the presence of such a marker and determine if Cdk1 activation is more often correlated with the presence of a nucleus than would be predicted by chance. This point could be determined by comparing the number of trigger waves associated with nuclei in the original videos and then doing so again after rotating the channel showing the nuclei by 180 degrees. Additionally, the authors could compare the abundance and distribution of pacemakers in extracts with and without nuclei.

The authors note that others have proposed that the centriole/centrosome may serve as a pacemaker. A large fraction of demembranated Xenopus sperm usually have associated centrioles. The centrioles give rise to centrosomes in extracts and the centrosomes, in turn, generate microtubule asters. Because cyclin B binds to microtubules (via interactions with MAPs; see for example J. Cell Biol. 1995. 128:849-862) it is a distinct possibility that the microtubule organizing center generated by the demembranated sperm that account for the pacemaking activity. This point could be addressed by adding purified DNA to the extracts which will still assemble into nuclei (Newmeyer et al., 1986).

Reviewer #3:

The paper studies mitotic waves in cell-free Xenopus extracts, using a combination of experiments and modeling, analyzed primarily via numerical simulations. The main result is the finding that mitotic wave can be initiated either from the boundary or from "stronger" internal nuclei (within the model, having a higher frequency), and that which of the two wins is determined in part by the system's geometry. Some of the qualitative conclusions (e.g., that wider systems support wave initiation from the boundaries) are then verified experimentally.

The contents of the paper are carefully prepared and well-written, and the supporting information detailed and considerate. In particular, the modeling is explained well and implemented carefully. Nonetheless, the paper has some issues that should be addressed:

1) What is the biological significance – if any – whether the waves are boundary-driven or internally driven? The significance is given more strongly in the conclusion (starting in the third paragraph of the Discussion) than in the Introduction, and even then the results are discussed in the context of a different organism (Drosophila) than the one studied by the authors.

2) It would be good if the authors could put their results in the broader context of diffusion-reaction systems and, in particular, other biological systems such as the Min oscillations briefly mentioned in the Discussion – e.g., are the results expected to hold for other systems? This seems to be the implicit claim, since the features they note are conserved across two different models (the detailed biochemical model and the generic FHN model).

3) At times, it is hard to follow the logical flow of the paper – e.g., why do higher frequencies dominate? (This is mentioned only in the Discussion, without providing intuition). The choice of a higher frequency nuclei was given early in the paper without adequate explanation. Could the authors have instead used nuclei with deeper Gaussian wells? Or varying other parameters?

4) In the presentation of Figure 2, the authors show what appears to be transient experimental data (in panel B), then support this data with non-transient numerical simulation (in panels D and E) that shows the same spatiotemporal structure as the experiments. However, it is not clear to me why this comparison is valid, or why they assume only one prominent pacemaker region in panels D/E when there are multiple nuclei present and their assumption is that nuclear import drives pacemaking.

5) "While this simulation with a single nucleus closely relates to the in vivo situation of a typical cell" – where is this shown/discussed?

6) Figure 3 has several issues that require attention, most notably the presentation of the enhancement of Cavg. Firstly, The observed enhancement of Cavg near the boundary is much smaller than the values of 20-40% cited in Figure 2. Secondly, it is not clear whether the enhancement at the boundary is due to sequestration competition as the authors propose and model in this figure or the enhanced concentration resulting from the nearby boundary. When the nucleus is deconstructed after interphase, the proteins diffuse away; with a boundary nearby, the local concentration can be enhanced as it provides a barrier to diffusion. Is there a way to tease apart the two effects and identify which is dominant in the experiments? Lastly, the color scale in Figure 3D is misleading without a colorbar.

7) "Figure 3B shows that proteins quickly build up in the nuclear region in the early phase of the import period and then the proteins quickly disperse after nuclear envelope breakdown." This is unclear to me. The authors should maybe show a time trace of the concentration at x = 1.2mm, or some other, more interpretable plot.

8) Also, in the first paragraph of the subsection “Wider systems lead to boundary-driven mitotic waves”, results from the model are quoted, but it seems to me that they were not clearly presented beforehand? In particular, the authors show that nuclei near the boundary are more efficient at nuclear import, but never explicitly show that this results in boundary-driven waves. (This result is implied when Figure 3 is combined with Figure 2, but the paper lacks detailed end-to-end modeling.)

9) How are the kymograph lines determined in e.g. Figure 5? It is not clear if they are fit by hand, by computer, etc. and as a result, one is led to wonder how solid the conclusions from Figure 5 are. Additionally, the subtraction procedure in the blue-colored sub-panel of Figure 5A, B, C seems arbitrary.

10) There are several issues regarding the discussion of the boundary and/or dimensionality. First, the authors explore the effect of the boundaries at the ends of the tubes, but there is also a boundary azimuthally. Is there any way to determine whether this boundary plays a role in the initiation of the waves? Secondly, it is not clear what sets the length scale of the boundary-driven waves. Why is there a transition around 300 micron thick tubes? (This latter point may not be easy to answer from first principles.) Lastly (minor), around the fourth paragraph of the subsection “Wider systems lead to boundary-driven mitotic waves”, the authors discuss a two-dimensional system. They assert that the height of the droplet of extract relative to the diameter of the droplet determines the system dimensionality; this is not accurate; rather, the height of the droplet should be compared to the length scale of the wave (see a recent preprint for details: https://www.biorxiv.org/content/10.1101/2019.12.27.887273v1).

[Editors' note: further revisions were suggested prior to acceptance, as described below.]

Thank you for resubmitting your work entitled "Nuclei determine the spatial origin of mitotic waves" for further consideration by eLife. Your revised article has been reviewed by three peer reviewers, one of whom is a member of our Board of Reviewing Editors and the evaluation has been overseen by Naama Barkai as the Senior Editor.

All three reviewers agree that the paper is significantly improved by your new experiments, analyses and edits. However, there are few points that still need to be addressed before the paper can be accepted. One point (point 1) might require a bit more analysis or could be addressed by writing cautionary notes about the strength of conclusions that can be drawn from the uptake model. The remaining points (point 2-5) should all be addressed by textual modifications.

1) There are still some logical gaps in the paper which impact the readability and theory-to-experiment correspondence. For instance, there is still not a strong quantitative link between the nuclear import model presented in Figure 3 and the resulting wave dynamics explored elsewhere. Panels D and E in Figure 3 show that uptake competition is the main driver of concentration increases at nuclei near the boundaries of a given system, at least within their uptake model. What remains unclear is how robust their conclusions are – i.e., whether their conclusions hold for other plausible uptake models. Thus, it remains unclear how universal their uptake model conclusions are – in other words, whether the conclusions hold for other plausible modeling choices. It would be useful to show that either (a) quantitative evidence that their modeling choices provide testable predictions that are validated in experiment or (b) many model classes lead to the qualitative phenomena they observe. If these analyses cannot be performed the authors should at least comment on the fact that their results hold for a specific choice of the uptake model and that it remains unclear how generalizable the results are.

2) Some of the analysis is still somewhat opaque. For instance, there is not a clearly visible wave in Figure 2C. It is also not clear how the choices to draw (or not draw) wave fronts are made in the analysis leading to Figure 5 – which is a central point of the paper; for instance, in panel C of Figure 5—figure supplement 1, the wave fronts could be drawn in multiple ways. In response to our concerns, the authors have noted their image analysis methods include "drawing lines by visually judging the disappearance of nuclei" and that they "show the robustness of the findings by changing the fitting parameters used in the analysis over a wide range". It is still not clear whether these lines are drawn manually or in a regimented, computerized fashion. We trust that they have done this procedure carefully enough that their conclusions would not be affected by whatever handling method they have chosen, but it would be nice to have a clearer description of what has been done as well as a more substantive supplementary dataset, e.g., an expanded version of Figure 5—figure supplement 1.

3) The new data on the dependency of mitotic wave speed on cell cycle timing shown in Figure 2A are very interesting. The observed dependency is difficult to reconcile with trigger waves and rather suggests a transition from sweep to trigger waves as the cell cycle slows down, as suggested by Vergassola et al., 2018. That must be stated. For example, authors could say: "The dependency of mitotic wave speed on cell cycle duration is consistent with a transition from sweep waves to trigger waves as cell cycle slows down, as proposed in Vergassola et al., 2018".

4) The claims on the relevance of this paper findings to Drosophila must be further toned down. Even if the authors simulated sweep waves the internuclear distances used in the simulations are at least an order of magnitude higher than what is observe in Drosophila. So, in the fifth paragraph of the Discussion the authors should say something like: "However, the internuclear distance of our simulations is significantly larger than the one observed in the more crowded Drosophila embryo, so it remains unclear whether our results can directly extend to that system".

5) The importance of nuclear domains in Drosophila is an old concept named "energid". The authors should be clear about that in the second paragraph of the subsection “A computational model where nuclei spatially redistribute cell cycle regulators predicts the location of pacemaker regions”. It is also a bit misleading that the authors seem to imply that the nuclear domain of syncytial muscle or Drosophila embryos are similar in size to the ones observed in their experiments. They should comment on those importance size differences

Reviewer #1:

The manuscript by Nolet et al. is significantly improved by the revisions. I only have few minor requests of textual changes prior to recommending acceptance.

1) The dependency of the speed of waves with cell cycle timing is important. The data show that for very fast cell cycles one gets a wave speed that depends strongly on the cell cycle period and that for slow cycles the speed of the wave is more or less fixed. This is exactly the scenario proposed in the paper by Vergassola et al., 2018 with slow drives resulting in bistable waves and fast drives generating more rapid sweep wave with a clear dependence on the rate. That needs to be stated.

2) There is a significant difference in the internuclear distance observed in Xenopus extract and Drosophila embryos. I appreciate the effort of the authors to simulate sweep waves, but the internuclear distance in fly embryo is <~10 micron which is at least an order of magnitude lower of the values simulated by the authors. So, in their Discussion they should explain this by saying something like: However, the internuclear distance of our simulations is significantly larger than the one observed in the more crowded Drosophila embryo, so it remains unclear whether our results can directly extend to that system.

3) The importance of nuclear domains for nuclear migration was beautifully supported by data from Telley et al., 2012 in Drosophila, but it is an older concept and usually referred to as "energid". The authors should clarify that. It is also misleading that the authors seem to imply that the nuclear domain (including Drosophila) is similar to the one in their experiments. As said in point 2 the difference is about an order of magnitude and cannot be overlooked.

Reviewer #2:

The authors have carefully and thoroughly addressed the points I raised and, in every case, their original conclusions were confirmed.

Reviewer #3:

Overall, the modeling presentation is improved as there is less clutter after having moved some of the material to the SI. There are still, however, some logical gaps in the paper which impact the readability and theory-to-experiment correspondence. For instance, there is still not a strong quantitative link between the nuclear import model presented in Figure 3 and the resulting wave dynamics explored elsewhere. Additionally, it remains unclear how universal their uptake model conclusions are – in other words, whether the conclusions hold for other plausible modeling choices. It would be useful -though perhaps beyond the scope of this paper – to show that either (a) quantitative evidence that their modeling choices provide testable predictions that are validated in experiment or (b) many model classes lead to the qualitative phenomena they observe. Some additional points:

1) The authors have clarified their results in relation to our question about the relative impacts of boundary-condition-driven concentration increases versus competition-driven concentration increases. Panels D and E in Figure 3 show that uptake competition is the main driver of concentration increases at nuclei near the boundaries of a given system, at least within their uptake model. What remains unclear is how robust their conclusions are – i.e., whether their conclusions hold for other plausible uptake models.

2) Some of the analysis is still somewhat opaque. For instance, there is not a clearly visible wave in Figure 2C. It is also not clear how the choices to draw (or not draw) wave fronts are made in the analysis leading to Figure 5 – which is a central point of the paper; for instance, in panel C of Figure 5—figure supplement 1, the wave fronts could be drawn in multiple ways. In response to our concerns, the authors have noted their image analysis methods include "drawing lines by visually judging the disappearance of nuclei" and that they "show the robustness of the findings by changing the fitting parameters used in the analysis over a wide range". It is still not clear whether these lines are drawn manually or in a regimented, computerized fashion. We trust that they have done this procedure carefully enough that their conclusions would not be affected by whatever handling method they have chosen, but it would be nice to have a clearer description of what has been done as well as a more substantive supplementary dataset, e.g., an expanded version of Figure 5—figure supplement 1.

eLife. 2020 May 26;9:e52868. doi: 10.7554/eLife.52868.sa2

Author response


Essential revisions:

1) Biological Significance. It is unclear what the biological significance of the presented results is. The proposal that the experiments will apply to Drosophila embryos is complicated by several observations in that system that argue for significant differences from your results: a) Cdk1 waves are not trigger waves in fly embryos (Vergassola et al., 2018); b) the correlation length of the field of Cdk1 activity (~100 microns) is significantly larger than internuclear distance (<10 micron) suggesting that nuclei are unlikely to act in isolation in that system; c) the local nuclear-to-cytoplasmic ratio is important for timing the cell cycle. Thus, we recommend that you propose other possible in vivo applications of your insights from in vitro experiments.

2) Evidence for nuclei acting as pacemakers. The evidence that nuclei act as a pacemaker should be strengthened. There are several suggestions from the reviewers. While answering all the criticism might not be necessary, we would like you to address the main concerns of reviewer 2, as well as provide evidence that nuclear brightness is a better predictor of wave initiation than a measurement of the nuclear-to-cytoplasmic ratio (for example you could divide the extract in cell-like domains by some geometric tessellation and check whether nuclear brightness is a better predictor of wave initiation than the size of the cell-like domain). While FRAP experiments would be a great quantitative test of nuclear import/export parameters, they are not necessary if you lack the setup for performing them.

3) Theoretical analysis. Reviewer 3 raises several theoretical questions that should be dealt with.

Reviewer #1:

Signaling waves are emerging as a general mechanism of regulation of biological processes. Among them, mitotic waves in early embryos are particularly interesting as they are both functionally important and a great system for quantitative dissection of the mechanisms of the waves. The paper by Nolet and collaborators addresses the mechanisms by which certain regions can emerge as pacemakers in large spatial systems. The authors use the Xenopus extract system which is able to undergo repeated cell cycles which organize in mitotic waves. The authors argue for two major conclusions: waves tend to start at nuclei that are more efficient at nuclear import; spatial dimensions influence whether waves tend to start near the boundary or in the middle of the domain. These are in principle interesting observations, but this paper suffers from significant limitations that need to be addressed. Specifically the significance of their in vitro findings for in vivo systems is unclear and the experimental analysis could be strengthen by more quantifications and additional experiments.

1) While the experiments presented in this paper are well-executed, their relevance to in vivo systems remain unclear. The authors speculate that their results could explain the origin of waves in Drosophila embryos. However, this proposal is problematic and it is important that the authors address the fact that mitotic waves in Drosophila are not trigger waves (Vergassola et al., 2018). The authors need to study wave origin in the context of the mechanism proposed by Vergassola et al. if they wanted to make claims about the Drosophila embryo. Also notice that the inter-nuclear distances in these two systems are significantly different. Overall, I am very skeptical that one can generalize the findings of this paper to the fly embryo.

We agree that we could have done a better job on clarifying the in vivo relevance of our work. We have now expanded such a discussion both in the Introduction and in the Discussion by including (parts of) the Discussion below.

While several studies have addressed the potential biochemical mechanisms of mitotic waves (Chang and Ferrell Jr., 2013; Deneke et al., 2016; Vergassola et al., 2018), what determines the spatial origin of mitotic waves remains unclear. We find that mitotic waves originate at nuclei, which act as so-called pacemakers, regions that oscillate faster than their surroundings.

One advantage to having the nucleus control the timing of mitosis is that it allows the cell to ensure that DNA replication has completed before initiating mitosis. While DNA checkpoints are largely silenced in the early Xenopus embryo (Newport and Dasso, 1989, in Drosophila DNA content is known to activate the DNA-replication checkpoint and alter the cell cycle period (Farrell and O’Farrell, 2014; Deneke et al., 2016). A failure in the correct regulation of mitosis is associated with polyploidy, which plays a key role in nonmalignant physiological and pathological processes (Fox and Duronio,2013). In the absence of a proper pacemaker, or if the pacemaker were to be located elsewhere, linking DNA replication to mitosis would be more complicated and, perhaps, more prone to error.

Previous studies have pointed to the critical role of the nucleus in spatial redistributing cell cycle regulators (Gavet and Pines, 2010; Santos et al., 2012). In particular, the nuclear import of Cyclin B has been shown to lead to spatial positive feedback, ensuring a robust and irreversible mitotic entry (Santos et al., 2012). Nuclei have also been found to be crucial in ensuring cell cycle oscillations in the Drosophila embryo (Huang and Raff, 1999; Deneke et al., 2019). Interestingly, although previous reports have suggested that centrosomes serve as pacemakers (Chang and Ferrell Jr., 2013; Ishihara et al., 2014), we found that they are dispensable. After treating extracts with purified DNA, which lacks centrosomes, we still observed mitotic waves.

Nuclei are a natural choice of pacemaker for mitotic waves because they allow for a natural way to link one biological process, DNA replication, with another, mitosis. We hope that our work will further trigger new studies into the origin of pacemakers as the initiation of biological decisions mediated by traveling waves seem to be key in the proper coordination of a biological process. Traveling waves have, for example, also been found to propagate apoptosis, action potentials, and calcium signals over large distances. In these systems, defective mitochondria, signals from neighboring neurons, or fertilization serve as the initial trigger to locally activate a wave.

We also found that the interaction of multiple nuclei in a shared cytoplasm can lead to unexpected behavior, i.e. boundary-driven mitotic waves occur in wider systems. Strikingly, mitotic waves in the early Drosophila embryo have also been reported to often originate at the boundary (Foe and Alberts, 1983). During nuclear cycles 10-13 in the syncytial blastoderm of these early embryos, nuclei enter (and exit) mitosis in waves that originate metachronously from the opposite anterior and posterior poles of the embryo and terminate in its mid-region.

It was not our intention to make strong claims on the wave origin in the Drosophila embryo as we do not have experimental data to support such claims. However, we did feel that it was worthwhile to highlight that waves have been reported to often originate at the boundary in the Drosophila embryo. This observation is certainly intriguing as we are not aware of many biological examples where waves originate at the boundary. On the one hand, we have now formulated this discussion more carefully in the manuscript. On the other hand, while being cautious in our claims concerning the relevance of our findings for the Drosophila embryo, we have carried out additional simulations that support the idea that the existence of boundary-driven waves in Drosophila could be explained by the model presented in our manuscript. Here below we address key findings, parts of which we have also incorporated into the main text of the manuscript:

· Vergassola et al. provide evidence that mitotic waves in Drosophila are not trigger waves, but rather so-called sweep waves (Vergassola et al., 2018). However, in the same manuscript, the authors do show that slower and clearer trigger waves exist in mutant embryos (Vergassola et al., 2018). The experiment where mitotic waves in such mutant embryos are shown in this manuscript correspond to boundary-driven waves (see Figure 2 in Vergassola et al., 2018).

· Our work shows that boundary-driven waves can be generated for different types of oscillators, as long as their frequency is higher towards the boundary (Figure 4—figure supplements 1 and 2). This argues that the main ingredient for boundary-driven waves is the spatial redistribution process due to competing nuclei, which could also be relevant in Drosophila. The fact that Cdk1 oscillations only occur close to nuclei illustrates such a central role of nuclei (Deneke et al., 2019). Moreover, the uniform positioning of nuclei in the early Drosophila embryo (Deneke et al., 2019) is also a crucial element in our model to get boundary-driven waves. While this is definitely no proof that our work can be generalized to Drosophila, we do believe this is at least an interesting observation.

· Note that the work in (Vergassola et al., 2018) does not describe an oscillatory system. Instead, the model for sweep waves is based on a single propagating front in a bistable system where the locations of the saddle-node points (and the whole force field) changes in time (hence, everything is “sweeped”). We expanded this model by turning it into an oscillating system and assuming a higher cell cycle frequency towards the boundary. In doing so, we found that both trigger waves (with a fixed bistable switch or saddle-node points that are changed slowly) and sweep waves (saddle-node points are changed sufficiently fast) produced boundary-driven waves, but sweep waves were faster (see Figure 4—figure supplement 2). This is consistent with the work by Vergassola et al. and provides a potential mechanism to explain the spatial origin of sweep waves in Drosophila. In the model by Vergassola et al. the wave origin is purely random due to noise. The spatial redistribution process by a regular nuclear pattern in our work could be an additional effect to (perhaps partially) determine the wave origin.

· Finally, we checked the effect of the internuclear distance and the range of interaction/competition between nuclei. We find that boundary-driven waves still exist for larger interaction ranges (Figure 3—figure supplement 2) and smaller internuclear distances (Figure 3—figure supplement 4), a situation that more closely corresponds to the Drosophila system as mentioned by the reviewer.

2) The authors make the claim on more efficient nuclear import based on nuclear fluorescent intensity. However, it is my impression that many of the nuclei in the system do not separate following mitosis suggesting that these nuclei might ultimately become polyploid. So, I find nuclear fluorescence and intensity difficult to interpret. A better test of the nuclear import efficiency would be to use FRAP to measure the kinetic parameters of nuclear import and export. It would also be important to test how large the difference in nuclear import need to be to impact cell cycle durations. It is unclear how physiological nuclear dynamics is in the egg extract. Finally, it is in principle possible that the cell cycle influences nuclear import and vice versa. This would leave a bit of chicken/egg problem. Is nuclear import causing faster cell cycles or is higher nuclear import a consequence of the faster cell cycles? This paper presents no attempt at manipulating nuclear inputs or cell cycle duration. It should be possible to gain some insights with pharmacological perturbations.

The reviewer raises valid points. Several open questions related to how DNA and nuclei affect the spatiotemporal coordination of the cell cycle remain. We agree that it is important to attempt to manipulate nuclear inputs or cell cycle duration to verify some of our claims. To this end we supplemented cell-free extracts with different concentrations of Importazole, which is an inhibitor of importin-beta transport receptors. We also disrupted microtubule dynamics by adding S-Trityl-L-cysteine (STLC), a kinesin Eg5 inhibitor. Our experiments show that such perturbations influence local cell cycle duration and mitotic wave organization. Increasing inhibition of nuclear import leads to an average increase in the cell cycle period, smaller nuclei, and a loss of mitotic waves. This further confirms the crucial role that nuclear import processes play in forming proper nuclei and ensuring mitotic wave formation. We now discuss these results Figure 2E-G, Figure 2—figure supplement 1, and Figure 2—video 2.

The reviewer wonders whether many of the nuclei in the system do not separate following mitosis and whether the nuclear behavior in extracts is physiological or not. Various works of Levy and Heald have illustrated that nuclei expand in vivo at a rate comparable to that of egg frog extracts, illustrating that extracts faithfully recapitulate nuclear dynamics in the early embryo (Levy and Heald, Cell 2010). Cheng and Ferrell also recently observed that cell-like compartments in frog cycling extracts can undergo consecutive cell division cycles, where the daughter compartment contained a single nucleus each (Cheng and Ferrell, 2019). In our case, such divisions are hard to see with our GFP-NLS reporter, likely due to the fact that we study extracts contained in tubes rather than thin sheets, such that divisions are likely to occur outside the plane of the microscope. In order to explore physiological concentrations of nuclear densities in the egg extract, we explored the behavior for four different nuclear densities (approx. 30, 60, 250 nuclei/μl, and no nuclei). Figure 2A-C and Video 1 show the results of these experiments, where we found that the cell cycle period decreases and the wave speed increases as the nuclear density increases. These experiments show that in the absence of nuclei, the system still oscillates, but is unable to form clear mitotic waves. This directly illustrates the essential role that nuclei play in generating mitotic waves.

The reviewer also touches on another interesting question: while the cell cycle controls nuclear import, nuclear import can also drive the cell cycle, which leads to a chicken/egg problem. Is nuclear import causing faster cell cycles or is higher nuclear import a consequence of the faster cell cycles. In order to address the complex interaction between these processes we have developed a new theoretical model which expands the previous one. Our original approach consisted of two different models:

a) Model 1 (corresponding to previous Figure 3) described the spatial redistribution of cell cycle regulators by competing nuclei including import and diffusion processes that were timed by a constant cell cycle period.

b) In Model 2 (corresponding to previous Figure 4), the spatial profile of cell cycle period determinants obtained from Model 1 were introduced as a spatial profile in the cell cycle frequency in established partial differential equations for cell cycle oscillations, showing mitotic waves.

Now, however, we have expanded Model 1 by including a modulation of the cell cycle period based on the local density of cell cycle regulators. This integrated model directly explains the experimentally observed phenomena, such as boundary-driven waves and competing mitotic waves. We now include such detailed end-to-end modeling in the main text. We decided to move Model 2 to Figure 4—figure supplement 1, where it is used to illustrate the generic aspects of competition between waves generated by spatially heterogeneous frequency profiles.

3) An interesting observation of this paper is that as the size of the tube is increased the number of waves starting at the boundary also increases. The authors propose that this corresponds to nuclei of higher intensity preferentially localizing close to the boundary, due to a geometrical effect causing higher competition among internal nuclei for import. The authors should present a clear analysis of the effects of nuclear density on the observed waves, as the nuclear-to-cytoplasmic ratio can influence cell cycle duration. Also, they do not report cell cycle durations and wave speeds in all the experiments with tubes of different geometry (I only found such data in the supplement for tubes of 100 micron). In the example shown in Figure 5, the cell cycle seems to lengthen in the small tube (as shown in the supplement) while it seems of constant duration in the large tube. Is that true? The authors should do more quantification of their data to provide arguments against alternative hypotheses. At this point, I remain a bit worried that there could be other explanations for the observed phenomena.

In Figure 1B, Figure 1—figure supplement 1 and Figure 2A-C we now report in more detail on cell cycle periods and wave speeds for our experiments in thin tubes (100 μm, 200 μm) for different nuclear densities (approx. 30, 60, 250 nuclei/μl, and no nuclei). We found that the average cell cycle period increases over time (Figure 2B). Such increase in cell cycle period has been linked to a decrease in ATP supply over time (Guan et al., 2018). One additional explanation could be that a decrease in cell cycle period is related to increasing levels of DNA as it is replicated (Dasso and Newport, 1990). We found that extracts with less added sperm nuclei had a faster cell cycle, which is again consistent with the idea that increasing levels of DNA slow down the cell cycle (Figure 2A) (Dasso and Newport, 1990). Mitotic waves were similarly observed, but the wave speeds were initially faster than in tubes with a higher nuclear density (Figure 2B). The waves then slowed down to similar speeds as in the case with the higher concentration of sperm nuclei.

Interestingly, a decrease in nuclear density did not lead to a big change the internuclear distance (Figure 1—figure supplement 1I). Instead, it created more and larger regions where nuclei were absent (Figure 1—figure supplement 2), and pacemakers were predominantly found close to these regions (Figure 1—figure supplement 2). Cheng and Ferrell observed a similar transition from a regular pattern of equidistantly spaced nuclei to a system with holes in Xenopus interphase egg extracts when decreasing the concentration of added sperm nuclei (Cheng and Ferrell, 2019).

Next, we further decreased the nuclear density (approx. 30 nuclei/µl), such that only few nuclei remained in an entire tube. Here, we used a fluorescent microtubule reporter to visualize the spatial coordination of mitotic entry, while bright-field images were used to track the location of nuclei (Video 1). Mitotic waves were found to originate at the few nuclei present in the tube, and they traveled through the whole tube (several mm) at a speed of approx. 60 µm/min (Video 1, Figure 2C). In the absence of any nuclei in the tube (no added demembranated sperm nuclei), we still observed cell cycle oscillations, but no mitotic waves were observed (Video 1, Figure 2B). These experiments underscore the critical role that nuclei play in changing the cell cycle period and introducing sufficient spatial heterogeneity in cell cycle period to generate clear mitotic waves.

In Figure 5—figure supplement 5 we also characterized the wave speed and cell cycle duration for thicker tubes (300 μm, 560 μm). This analysis shows that the cell cycle period also increases in time in thicker tubes, but this increase is indeed slower as observed by the reviewer. The cell cycle period is also found to be initially longer for thicker tubes. Moreover, the wave speeds are found to be generally lower for thicker tubes.

Finally, we have extended our analysis to see whether GFP-NLS intensity is a good predictor of local cell cycle period and pacemaker location. We analyzed the spatial GFP-NLS intensity profile, the spatial profile of cell cycle periods, and the internuclear distance (Figure 1B). As a brighter nucleus has taken up more GFP-NLS, we reasoned that it similarly concentrates cell cycle regulators that lead to a local increase in the cell cycle frequency. We directly correlated this with the local period, which indeed showed that this region oscillated faster (Figure 1B). To further understand why certain nuclei were brighter, we explored whether their environment had any particular characteristics. We characterized the distance between the different nuclei and found that they were typically separated by 150 − 200µm(Figure 1—figure supplement 1). However, we found that the brightest nucleus is also most separated from its neighboring nuclei (Figure 1B). This finding is consistent with the idea that nuclei increase their oscillation frequency by concentrating cell cycle regulators, as they have a larger pool of regulators in their surroundings to import. We analyzed the spatial GFP-NLS intensity profile and the internuclear distance for 9 other experiments where we could clearly identify nuclei and mitotic waves. Overall, in 90% of the analyzed experiments the pacemaker location was well predicted by the region with the highest GFP-NLS intensity and/or the region where nuclei were most separated from their neighboring nuclei (Figure 1A, B and Figure 1—figure supplements 2 and 3). The total nuclear GFP-NLS intensity was also found to be a better indicator of the pacemaker location than the nuclear size as indicated by Hoechst staining, or than the GFP-NLS intensity normalized to the Hoechst signal (Figure 1—figure supplement 3).

Reviewer #2:

Several points need to be addressed before the conclusions reached can be accepted. These are listed below:

The authors report "We noticed that the mitotic waves often originate close to nuclei that are considerably brighter than the surrounding nuclei (Figure 2A-C). We therefore hypothesized that a region with higher GFP-NLS intensity correlates with a higher local oscillation frequency, serving as a pacemaker that organizes the mitotic wave (Figure 2C). As a brighter nucleus is more efficient in the uptake of GFP-NLS, we reasoned that it similarly concentrates cell cycle regulators that lead to a local increase in the cell cycle frequency".

The study hinges upon the assumptions and conclusions implicit and explicit in these three sentences. It therefore follows that those assumptions and conclusions need to be well supported. The following suggestions are intended to help the authors provide such support.

"Often" and "brighter" are subjective terms. The definition of bright needs to be quantitatively established, as does the definition often, particularly as inspection of the data in Figure-2—figure supplement 5 provides as many clear examples of dim nuclei apparently acting as pacemakers (using the author's criteria) as bright nuclei acting as pacemakers, as well as examples of bright nuclei that do not apparently act as pacemakers. Ideally, the authors would provide a plot of nuclear GFP signal (normalized against a DNA marker such as DAPI) versus the number or frequency of trigger wave initiation associated with the nuclei.

Increased nuclear brightness may imply more efficient nuclear import but it may also imply greater age (and indeed, some of bright nuclei appear to have been around longer than their neighbors). It may also imply greater volume. That is, the kind of fluorescence imaging employed in these experiments is inherently nonlinear, and as a result, smaller nuclei may appear less bright simply because they have less GFP-NLS rather than less concentrated GFP-NLS.

We have extended our analysis to see whether GFP-NLS intensity is a good predictor of local cell cycle period and pacemaker location. We analyzed the spatial GFP-NLS intensity profile, the spatial profile of cell cycle periods, and the internuclear distance (Figure 1B). As a brighter nucleus has taken up more GFP-NLS, we reasoned that it similarly concentrates cell cycle regulators that lead to a local increase in the cell cycle frequency. We therefore directly correlated this with the local period, which indeed showed that this region oscillated faster (Figure 1B). To further understand why certain nuclei were brighter, we explored whether their environment had any particular characteristics. We characterized the distance between the different nuclei and found that they were typically separated by 150 − 200µm (Figure 1—figure supplement 1). However, we found that the brightest nucleus is also most separated from its neighboring nuclei (Figure 1B). This finding is consistent with the idea that nuclei increase their oscillation frequency by concentrating cell cycle regulators, as they have a larger pool of regulators in their surroundings to import. We analyzed the spatial GFP-NLS intensity profile and the internuclear distance for 9 other experiments where we could clearly identify nuclei and mitotic waves. Overall, in 90% of the analyzed experiments the pacemaker location was well predicted by the region with the highest GFP-NLS intensity and/or the region where nuclei were most separated from their neighboring nuclei (Figure 1A, B and Figure 1—figure supplements 2 and 3).

We then repeated several experiments both with the GFP-NLS reporter and a Hoechst marker for DNA. In Figure 1—figure supplement 3 we show the analysis of an experiment with a clear mitotic wave. We first repeated the analysis of the spatial distribution of the total and maximal GFP-NLS intensity, as well as the internuclear distance. Again, both measures peaked close to the pacemaker location. Next, we analyzed the spatial distribution of the Hoechst signal to determine the internuclear distance and the nuclear size. While the internuclear distance was again high close to the pacemaker location, the nuclear size was not clearly higher at the pacemaker location. We then used the measure of nuclear size to renormalize the total and maximal GFP-NLS signal. In such normalization the measure was no longer larger than its surroundings close to the pacemaker location. This argues that the higher GFP-NLS intensity associated to pacemakers is due their larger size and volume and not due to having more concentrated GFP-NLS. We therefore no longer mention nuclear import efficiency in the manuscript, but have adopted these new measures to discuss pacemaker location. We thank the reviewer for pointing out the important difference between having a larger GFP-NLS signal due to larger total nuclear import or due to a higher nuclear import efficiency.

While one might imagine that all of the nuclei should be the same size, the standard preparation of demembranated sperm for egg extract studies often results in a population of samples that contains both intact and fragmented sperm. The authors could address their proposal that import efficiency is important by the application of pharmacological import inhibitors (along with a direct marker for DNA such as DAPI) which would, if their model is right, perturb the normal pattern or number of pacemakers. This would require a different marker for cell cycle progression, a point addressed below.

We agree that it is important to attempt to manipulate nuclear inputs or cell cycle duration to verify some of our claims. To this end we supplemented cell-free extracts with different concentrations of Importazole, which is an inhibitor of importin-beta transport receptors. We also disrupted microtubule dynamics by adding S-Trityl-L-cysteine (STLC), a kinesin Eg5 inhibitor. Our experiments show that such perturbations influence local cell cycle duration and mitotic wave organization. Increasing inhibition of nuclear import leads to an average increase in the cell cycle period, smaller nuclei, and a loss of mitotic waves. This further confirms the crucial role that nuclear import processes play in forming proper nuclei and ensuring mitotic wave formation. We now discuss these results (see Figure 2E-G, Figure 2—figure supplement 1, and Figure 2—video 2).

Ideally, testing the role of nuclei as pacemakers would entail a marker of mitotic entry that does not rely on the nuclei themselves. Three possibilities present themselves: The first is the FRET-based Cdk1 activity probe developed by the Pines lab. However, it may have insufficient spatial resolution for these studies. The second would be a microtubule probe, such as fluorescent tubulin or one of the commercially-available, fluorescent taxol derivatives (e.g. SiR-tubulin). Microtubule growth in M-phase extracts is limited but quite robust in interphase extracts. The third would be a probe for F-actin as it has been shown that M-phase extracts differ in their organization of F-actin than Interphase-arrested extracts (Field et al., 2011). This isn't to imply that the authors would need to repeat all of their experiments with a nucleus-independent cell cycle marker, but rather that they could simply run the basic assay in the presence of such a marker and determine if Cdk1 activation is more often correlated with the presence of a nucleus than would be predicted by chance. This point could be determined by comparing the number of trigger waves associated with nuclei in the original videos and then doing so again after rotating the channel showing the nuclei by 180 degrees. Additionally, the authors could compare the abundance and distribution of pacemakers in extracts with and without nuclei.

Thanks for the good suggestion to use an alternative marker for mitotic entry that does not rely on the nuclei themselves, which would allow perturbing the nuclear density and still have a way of visualizing mitotic wave dynamics. We repeated experiments with a microtubule reporter, using fluorescently labeled tubulin (HiLyte Fluor488). Figure 1C and Figure 1—video 2show that mitotic waves are also observed using such a microtubule reporter, as well as in bright-field. Using these alternative reporters, we then tested how critical system parameters such as nuclear density influences the mitotic wave dynamics.

In Figure 1B, Figure 1—figure supplement 1, and Figure 2A-C we analyzed cell cycle periods and wave speeds in additional experiments in thin tubes (100 μm, 200 μm) for different nuclear densities (approx. 30, 60, 250 nuclei/μl, and no nuclei). We found that the average cell cycle period increases over time (Figure 2B). Such increase in cell cycle period has been linked to a decrease in ATP supply over time (Guan et al., 2018). One additional explanation could be that a decrease in cell cycle period is related to increasing levels of DNA as it is replicated (Dasso and Newport, 1990). We found that extracts with less added sperm nuclei had a faster cell cycle, which is again consistent with the idea that increasing levels of DNA slow down the cell cycle (Figure 2A) (Dasso and Newport, 1990). Mitotic waves were similarly observed, but the wave speeds were initially faster than in tubes with a higher nuclear density (Figure 2B). The waves then slowed down to similar speeds as in the case with the higher concentration of sperm nuclei.

Interestingly, a decrease in nuclear density did not lead to a big change the internuclear distance (Figure 1—figure supplement 1I). Instead, it created more and larger regions where nuclei were absent (Figure 1—figure supplement 2), and pacemakers were predominantly found close to these regions (Figure 1—figure supplement 2). Cheng and Ferrell observed a similar transition from a regular pattern of equidistantly spaced nuclei to a system with holes in Xenopus interphase egg extracts when decreasing the concentration of added sperm nuclei (Cheng and Ferrell, 2019).

Next, we further decreased the nuclear density (approx. 30 nuclei/µl), such that only few nuclei remained in an entire tube. Here, we used the fluorescent microtubule reporter to visualize the spatial coordination of mitotic entry, while bright-field images were used to track the location of nuclei (Video 1). Mitotic waves were found to originate at the few nuclei present in the tube, and they traveled through the whole tube (several mm) at a speed of approx. 60 µm/min (Video 1, Figure 2C). In the absence of any nuclei in the tube (no added demembranated sperm nuclei), we still observed cell cycle oscillations, but no mitotic waves were observed (Video 1, Figure 2B). These experiments underscore the critical role that nuclei play in changing the cell cycle period and introducing sufficient spatial heterogeneity in cell cycle period to generate clear mitotic waves.

The authors note that others have proposed that the centriole/centrosome may serve as a pacemaker. A large fraction of demembranated Xenopus sperm usually have associated centrioles. The centrioles give rise to centrosomes in extracts and the centrosomes, in turn, generate microtubule asters. Because cyclin B binds to microtubules (via interactions with MAPs; see for example J. Cell Biol. 1995. 128:849-862) it is a distinct possibility that the microtubule organizing center generated by the demembranated sperm that account for the pacemaking activity. This point could be addressed by adding purified DNA to the extracts which will still assemble into nuclei (Newmeyer et al., 1986).

Centrosomes have indeed also been suggested to serve as pacemakers (Chang and Ferrell Jr., 2013; Ishihara et al., 2014), potentially by concentrating pro-mitotic factors such as Cdc25 and cyclin B (Bonnet et al., 2008; Jackman et al., 2003). As demembranated sperm nuclei also provide centrosomes that can generate microtubule asters, it is certainly relevant to test whether such centrosomes are critical to generate pacemakers. We therefore added purified DNA to the extracts, which assembled into nuclei (Newmeyer et al., 1986). Mitotic waves were still observed indicating that DNA alone is sufficient to create pacemaker-generated mitotic waves without a need for centrosomes (Figure 2D, Figure 1—video 2).

Reviewer #3:

[…] The contents of the paper are carefully prepared and well-written, and the supporting information detailed and considerate. In particular, the modeling is explained well and implemented carefully. Nonetheless, the paper has some issues that should be addressed:

1) What is the biological significance – if any – whether the waves are boundary-driven or internally driven? The significance is given more strongly in the conclusion (starting in the third paragraph of the Discussion) than in the Introduction, and even then the results are discussed in the context of a different organism (Drosophila) than the one studied by the authors.

We agree that we could have done a better job on clarifying the in vivo relevance of our work. We have now expanded such a discussion both in the Introduction and in the Discussion of the manuscript by including (parts of) our response below.

While several studies have addressed the potential biochemical mechanisms of mitotic waves (Chang and Ferrell Jr., 2013; Deneke et al., 2016; Vergassola et al., 2018), what determines the spatial origin of mitotic waves remains unclear. We find that mitotic waves originate at nuclei, which act as so-called pacemakers, regions that oscillate faster than their surroundings.

One advantage to having the nucleus control the timing of mitosis is that it allows the cell to ensure that DNA replication has completed before initiating mitosis. While DNA checkpoints are largely silenced in the early Xenopus embryo (Newport and Dasso, 1989), in Drosophila DNA content is known to activate the DNA-replication checkpoint and alter the cell cycle period (Deneke et al., 2016). A failure in the correct regulation of mitosis is associated with polyploidy, which plays a key role in nonmalignant physiological and pathological processes (Fox and Duronio, 2013). In the absence of a proper pacemaker, or if the pacemaker were to be located elsewhere, linking DNA replication to mitosis would be more complicated and, perhaps, more prone to error.

Previous studies have pointed to the critical role of the nucleus in spatial redistributing cell cycle regulators (Gavet and Pines, 2010; Santos et al., 2012). In particular, the nuclear import of Cyclin B has been shown to lead to spatial positive feedback, ensuring a robust and irreversible mitotic entry (Santos et al., 2012). Nuclei have also been found to be crucial in ensuring cell cycle oscillations in the Drosophila embryo (Huang and Raff, 1999; Deneke et al., 2019). Interestingly, although previous reports have suggested that centrosomes serve as pacemakers (Chang and Ferrell Jr., 2013; Ishihara et al., 2014), we found that they are dispensable. After treating extracts with purified DNA, which lacks centrosomes, we still observed mitotic waves.

Nuclei are a natural choice of pacemaker for mitotic waves because they allow for a natural way to link one biological process, DNA replication, with another, mitosis. We hope that our work will further trigger new studies into the origin of pacemakers as the initiation of biological decisions mediated by traveling waves seem to be key in the proper coordination of a biological process. Traveling waves have, for example, also been found to propagate apoptosis, action potentials, and calcium signals over large distances. In these systems, defective mitochondria, signals from neighboring neurons, or fertilization serve as the initial trigger to locally activate a wave.

We also found that the interaction of multiple nuclei in a shared cytoplasm can lead to unexpected behavior, i.e. boundary-driven mitotic waves occur in wider systems. Strikingly, mitotic waves in the early Drosophila embryo have also been reported to often originate at the boundary (Foe and Alberts, 1983). During nuclear cycles 10-13 in the syncytial blastoderm of these early embryos, nuclei enter (and exit) mitosis in waves that originate metachronously from the opposite anterior and posterior poles of the embryo and terminate in its mid-region. In this revised version of the manuscript, we have included additional simulations that support the idea that the existence of boundary-driven waves in Drosophila could be explained by the model presented in our manuscript.

2) It would be good if the authors could put their results in the broader context of diffusion-reaction systems and, in particular, other biological systems such as the Min oscillations briefly mentioned in the Discussion – e.g., are the results expected to hold for other systems? This seems to be the implicit claim, since the features they note are conserved across two different models (the detailed biochemical model and the generic FHN model).

In this revised version, we have tried to find a better balance between experiments and theory. On the one hand, we have reduced the parts in the main text where we discuss cell cycle oscillation models and the generic FHN model. This has allowed us to expand the experimental analysis, data analyses and biological interpretations. Instead, we have largely moved these modeling parts to supplementary figures. On the other hand, we have also expanded our modeling efforts by including more detailed end-to-end modeling, see point (8). As requested, we have also tried to put our results in a broader context of diffusion-reaction systems while trying to avoid making the manuscript too theoretical. We included (parts of) the discussions below in the manuscript.

We wondered whether these dynamics of competing pacemakers are specific to this particular computational model that includes nuclear import and diffusion processes. Therefore, we also implemented known PDE models of cell cycle oscillations (Appendix 2), where we define two pacemaker regions (see Figure 4—figure supplement 1A-C): an internal pacemaker and a boundary pacemaker region. We carried out simulations continuously changing the relative strength of both pacemaker regions by increasing the difference in cell cycle period. We found a gradual transition from boundary-driven dynamics to internal pacemaker-driven dynamics (Figure 4—figure supplement 1D). Similar results were found by using the FitzHugh-Nagumo oscillator model, a general model for relaxation-type oscillatory systems (Figure 4—figure supplement 1E). Oscillations are referred to as being of the relaxation-type when they are characterized by two separate timescales. One timescale is slow, i.e. cyclin abundances slowly build up in interphase, while the other is a fast activation of Cdk1.

We asked ourselves whether boundary-driven waves were specific to oscillatory systems based on relaxation-type oscillations. Therefore, we gradually decreased the timescale separation in the FitzHugh-Nagumo oscillator model, which led to more sinusoidal oscillations (Figure 4—figure supplement 2A) and preserved boundary-driven waves (Figure 4—figure supplement 2B). This suggests the generation of boundary-driven waves is largely independent of the type of oscillations, as long as the oscillation period is decreased close to the boundary. Our findings underscore the generic character of the dynamics of multiple competing pacemakers. Pacemaker-driven traveling waves, also often referred to as target patterns, have been widely studied and they form thanks to spatial heterogeneities that locally increase the oscillation frequency. The majority of such pacemaker waves were initially observed in chemical reaction-diffusion systems where heterogeneities were introduced as dust particles that locally modified the properties of the medium (Zaikin and Zhabotinsky, 1970; Zhabotinsky and Zaikin, 1973; Tyson and Fife, 1980). These experimental observations triggered many other studies on both traveling waves (Tyson and Fife, 1980; Kopell, 1981; Hagan, 1981; Kuramoto, 1984; Jakubith et al., 1990; Bugrim et al., 1996; Bub et al., 2005; Stich and Mikhailov, 2006) and spiral waves (Jakubith et al., 1990; Bub et al., 2002, 2005) triggered by a pacemaker. The interaction of multiple pacemaker waves has also been analyzed (Kuramoto, 1984; Walgraef et al., 1983; Mikhailov and Engel, 1986; Lee et al., 1996; Kheawon et al., 2007). In general, they propagate into the surrounding medium and compete with each other until the pacemaker with the highest frequency ultimately entrains the whole system (Kuramoto, 1984). The existence of the transition region is therefore somewhat surprising. However, simulating the system for increasingly longer transient times, we find that the transition region where boundary-driven waves and internal pacemaker-driven waves coexist shrinks, suggesting that after infinitely long transients one pacemaker indeed controls the whole domain. Such infinite transient times are, however, less biologically relevant as the early embryonic cell cycle oscillations only persist for about 13 cycles (Box 2). Therefore, one would expect to observe the full range of transient pacemaker dynamics in actual biological systems.

Our findings illustrate that the spatial environment has a strong influence on how biological processes self-organize. In particular, increasing the spatial dimensions of the system leads to a higher probability of observing mitotic waves that originate at the boundary of the system. Other studies have also stressed the importance of system size, boundaries, and geometry on self-organization processes. For example, using cell-free frog extracts, cytoplasmic volume was demonstrated to determine the spindle size (Good et al., 2013) and the size of the nucleus (Hara and Merten, 2015). System boundaries (Kopell et al., 1991; Haim et al., 1996; Rabinovitch et al., 2001; McNamara et al., 2016; Bernitt et al., 2017) and system geometry (Wettman et al., 2018) have been shown to affect the dynamics of traveling waves. In the widely studied amoeba Dictyostelium discoideum, the origin of cAMP waves has been studied in inhomogeneous systems. Waves appear spontaneously in areas of higher cell density with the oscillation frequency of these centers depending on their density (Vidal-Henriquez and Gholami, 2019). In the presence of advection, a boundary-induced instability was found to periodically excite a cAMP wave near the boundary (Vidal-Henriquez et al., 2017).

Another well-characterized model organism is the bacterium Escherichia coli, where Min-protein wave patterns help select the site of cell division (Hu and Lutkenhaus, 1999; Raskin and De Boer, 1999). Wave patterns and the location of cell division have been shown to strongly depend on the system size and geometry, both in vivo by deforming cell shape (Männik et al., 2013; Wu et al., 2015; Wettman et al., 2018) and in vitro by reconstituting Min oscillations in open and enclosed compartments (Zieske and Schwille, 2014; Zieske et al., 2016; Caspi and Dekker, 2016; Wettman et al., 2018). As thin compartments were gradually increased in length, multiple regions of oscillations were observed (Zieske and Schwille, 2014; Zieske et al., 2016; Caspi and Dekker, 2016; Wettman et al., 2018). For more complex geometries, many more wave patterns have been observed, such as standing waves, traveling planar and spiral waves, and coexisting stable stationary distributions (Zieske and Schwille, 2014; Zieske et al., 2016; Caspi and Dekker, 2016; Wettman et al., 2018). While there are similarities with our findings in the Xenopus cell-free extracts, one important difference is that the wave patterns in the Min system are mainly controlled by the spatial dimensions and geometry. In contrast, in our findings the influence of the spatial dimensions are, at least partially, mediated by the nuclei within the oscillatory medium that serve as pacemakers.

3) At times, it is hard to follow the logical flow of the paper – e.g., why do higher frequencies dominate? (This is mentioned only in the Discussion, without providing intuition). The choice of a higher frequency nuclei was given early in the paper without adequate explanation. Could the authors have instead used nuclei with deeper Gaussian wells? Or varying other parameters?

We should indeed have included a better explanation of a pacemaker at the start of the manuscript. We now discuss the link between pacemakers and oscillation frequency already in the Abstract, the Introduction, and the first section of the paper (subsection “Nuclei serve as pacemakers to organize mitotic waves”. This is discussed as follows:

Introduction: “We find that mitotic waves originate at nuclei, which act as so-called pacemakers, regions that oscillate faster than their surroundings (Kuramoto, 1984). […] We postulate that nuclei can concentrate cell cycle regulators, thus leading to faster cell cycle oscillations at those nuclear locations.”

Subsection “Nuclei serve as pacemakers to organize mitotic waves”: “We noticed that the mitotic wave originated close to a nucleus that is considerably brighter than the surrounding nuclei (Figure 1A). […] We directly correlated this with the local period, which indeed showed that this region oscillated faster (Figure 1B).”

As mentioned, we now no longer include simulations of cell cycle oscillations at the beginning of the manuscript as we feel the mix of modeling and experiment at the very start provided less of a logical flow (see also point (8)). However, as a short answer to the reviewer’s question: a lot of parameters can be varied to change the cell cycle period in the different models. We found that this had little effect and what matters most for all the dynamical behavior reported here is the fact that there is a clear frequency difference spatially. See e.g. also point (2) where we discuss the generality for different types of oscillators.

4) In the presentation of Figure 2, the authors show what appears to be transient experimental data (in panel B), then support this data with non-transient numerical simulation (in panels D and E) that shows the same spatiotemporal structure as the experiments. However, it is not clear to me why this comparison is valid, or why they assume only one prominent pacemaker region in panels D/E when there are multiple nuclei present and their assumption is that nuclear import drives pacemaking.

It is correct that the experiments are always in transient. Mitotic waves need time to build up in the presence of pacemaker regions. In fact, as we now report more elaborately in Figure 2, the cell cycle periods are also continuously changing in time. In the original modeling panels in the old Figure 2, we indeed showed dynamics that had already converged to well-defined waves (so non-transient behavior) and we did not implement a cell cycle period that was continuously changing. We believe that these assumptions make sense as they simplify the interpretation and modeling, while still capturing the essential dynamics. We both assumed one prominent pacemaker and multiple pacemakers associated to the multiple nuclei in the system, and we showed those two approaches to be valid in the old Figure 2 and old Figure 2—figure supplement 3. However, as mentioned before, partially motivated by point (8) by the reviewer, we chose to remove all these modeling figures at the beginning of the manuscript in favor of more detailed end-to-end modeling in new Figure 3 and 4.

5) "While this simulation with a single nucleus closely relates to the in vivo situation of a typical cell" – where is this shown/discussed?

We now rephrased this as follows:

While a typical cell contains a single nucleus, the cell-free extract experiment shown in Figure 1 consists of many distributed nuclei.

6) Figure 3 has several issues that require attention, most notably the presentation of the enhancement of Cavg. Firstly, The observed enhancement of Cavg near the boundary is much smaller than the values of 20-40% cited in Figure 2. Secondly, it is not clear whether the enhancement at the boundary is due to sequestration competition – as the authors propose and model in this figure or the enhanced concentration resulting from the nearby boundary. When the nucleus is deconstructed after interphase, the proteins diffuse away; with a boundary nearby, the local concentration can be enhanced as it provides a barrier to diffusion. Is there a way to tease apart the two effects and identify which is dominant in the experiments? Lastly, the color scale in Figure 3D is misleading without a colorbar.

We have added colorbars everywhere to clarify the scale of the changes in Cavg. These changes are indeed much smaller that the frequency difference that we implemented in the model in the old Figure 2. This is because Cavg represents a concentration of a certain cell cycle regulator. The actual cell cycle frequency is likely determined in a complicated (and currently largely unknown) way by a wide range of such regulators. It is possible that “small” relative changes in the concentration of cell cycle regulators can have a large effect on the cell cycle frequency.

It is indeed an interesting question whether the build-up of regulators at the boundary is due to either a sequestration effect, a boundary effect, or a combination of both. We have now carried out more simulations to tease them apart. We have discussed this in the following paragraph:

“The build-up of regulators at the boundary is mainly attributed to the fact that nuclei in the interior of the domain compete with neighboring nuclei to attract the available proteins, while nuclei close to the boundary only have one such “competitor". […] Instead, proteins build up close to the nuclei adjacent to the gaps (Figure 3—figure supplement 3).”

7) "Figure 3B shows that proteins quickly build up in the nuclear region in the early phase of the import period and then the proteins quickly disperse after nuclear envelope breakdown." This is unclear to me. The authors should maybe show a time trace of the concentration at x = 1.2mm, or some other, more interpretable plot.

We have now included such a time trace to clarify this more.

8) Also, in the first paragraph of the subsection “Wider systems lead to boundary-driven mitotic waves”, results from the model are quoted, but it seems to me that they were not clearly presented beforehand? In particular, the authors show that nuclei near the boundary are more efficient at nuclear import, but never explicitly show that this results in boundary-driven waves. (This result is implied when Figure 3 is combined with Figure 2, but the paper lacks detailed end-to-end modeling.)

This is a very good point. In order to improve the logical flow and clarity of the results, we have developed a new theoretical model which expands the previous one. Our original approach consisted of two different models:

a) Model 1 (corresponding to Figure 3) described the spatial redistribution of cell cycle regulators by competing nuclei including import and diffusion processes that were timed by a constant cell cycle period.

b) In Model 2 (corresponding to Figure 4), the spatial profile of cell cycle period determinants obtained from Model 1 were introduced as a spatial profile in the cell cycle frequency in established partial differential equations for cell cycle oscillations, showing mitotic waves.

Now, however, we expanded Model 1 by including a modulation of the cell cycle frequency based on the local density of cell cycle regulators. This integrated model directly explains the experimentally observed phenomena, such as boundary-driven waves and competing mitotic waves. We now include such detailed end-to-end modeling in the main text. We decided to move Model 2 to Figure 4—figure supplement 1, where it is used to illustrate the generic aspects of competition between waves generated by spatially heterogeneous frequency profiles.

9) How are the kymograph lines determined in e.g. Figure 5? It is not clear if they are fit by hand, by computer, etc. and as a result, one is led to wonder how solid the conclusions from Figure 5 are. Additionally, the subtraction procedure in the blue-colored sub-panel of Figure 5A, B, C seems arbitrary.

Kymograph lines are determined by using a custom-made code that allows drawing lines by visually judging the disappearance of nuclei. The. tiff files are imported in Mathematica and for all 𝑥 the maximum intensity over the width is calculated. This allows us to have a one-dimension intensity profile for each time point. Kymographs as in Figure 1A and Figure 1—figure supplement 2were made from these profiles over time. Lines are drawn through the points of mitotic entry (disappearance of nuclei), for every visible cycle. The period is calculated by taking 20 points on these lines and determining the time to the next line. This gives an average period (and standard deviation) for each cycle. The locations of the nuclei (one-dimensional) are extracted from these kymographs at the last one or two lines (if nuclei are well-separated). For each nucleus the average distance to their neighbors (left and right) is calculated which is also plotted in Figure 1C and Figure 1—figure supplement 2. For the last two cycles, the maximum intensity over the cycle is calculated at every x, yielding an intensity profile at each cycle.

The procedure used in Figure 5 is elaborately discussed in the section Image Analysis, where we also show the robustness of the findings by changing the fitting parameters used in the analysis over a wide range.

10) There are several issues regarding the discussion of the boundary and/or dimensionality. First, the authors explore the effect of the boundaries at the ends of the tubes, but there is also a boundary azimuthally. Is there any way to determine whether this boundary plays a role in the initiation of the waves? Secondly, it is not clear what sets the length scale of the boundary-driven waves. Why is there a transition around 300 micron thick tubes? (This latter point may not be easy to answer from first principles.) Lastly (minor), around the fourth paragraph of the subsection “Wider systems lead to boundary-driven mitotic waves”, the authors discuss a two-dimensional system. They assert that the height of the droplet of extract relative to the diameter of the droplet determines the system dimensionality; this is not accurate; rather, the height of the droplet should be compared to the length scale of the wave (see a recent preprint for details: https://www.biorxiv.org/content/10.1101/2019.12.27.887273v1).

In our modeling in Figure 3D,F we found that the width of the transverse direction indeed plays an important role in determining the strength of a build-up of cell cycle regulators at the different boundaries. While for thinner tubes (especially 100, 200 μm width) there is not much build-up of regulators at the boundary in the transverse direction (but only in the longitudinal one), in thicker tubes that have several rows of nuclei such build-up becomes more pronounced. As soon as the two directions become of similar size, waves can emerge from the different boundaries (see Figure 3F and Video 2).

What determines the critical length scale of the tubes that lead to a transition to boundary-driven waves remains an open question. We believe that this is linked to the typical length scale of the internuclear distance and the nuclear domain (approx. 150 μm). As soon as tubes get wide enough (wider than approx. 2 x 150 = 300 μm), multiple rows of nuclei fit along the transverse direction. We believe that this increases the regularity of the nuclear pattern, which increases the likelihood of observing boundary-driven waves.

Regarding the comment about dimensionality: we thank the reviewer for pointing this out. We have rephrased our statements.

[Editors' note: further revisions were suggested prior to acceptance, as described below.]

All three reviewers agree that the paper is significantly improved by your new experiments, analyses and edits. However, there are few points that still need to be addressed before the paper can be accepted. One point (point 1) might require a bit more analysis or could be addressed by writing cautionary notes about the strength of conclusions that can be drawn from the uptake model. The remaining points (point 2-5) should all be addressed by textual modifications.

1) There are still some logical gaps in the paper which impact the readability and theory-to-experiment correspondence. For instance, there is still not a strong quantitative link between the nuclear import model presented in Figure 3 and the resulting wave dynamics explored elsewhere. Panels D and E in Figure 3 show that uptake competition is the main driver of concentration increases at nuclei near the boundaries of a given system, at least within their uptake model. What remains unclear is how robust their conclusions are – i.e., whether their conclusions hold for other plausible uptake models. Thus, it remains unclear how universal their uptake model conclusions are – in other words, whether the conclusions hold for other plausible modeling choices. It would be useful to show that either (a) quantitative evidence that their modeling choices provide testable predictions that are validated in experiment or (b) many model classes lead to the qualitative phenomena they observe. If these analyses cannot be performed the authors should at least comment on the fact that their results hold for a specific choice of the uptake model and that it remains unclear how generalizable the results are.

We want to make a clear distinction between the models used for Figure 3 and Figure 4. In the first, the redistribution of cell cycle regulators due to a potential (mimicking nuclear import) is modeled, where the cell cycle period is fixed. This is done to show how regulators can build up at different locations depending on nuclear distribution and system dimensions, but it does not include any wave dynamics. It only shows the distribution of regulators if the cell cycle period would not be influenced by the local concentration of regulators. When we doinclude this feedback, we arrive at the model of Figure 4, which clearly shows waves. It also provided us with several predictions that were then qualitatively confirmed by our experiments. At the moment, we do not attempt a quantitative comparison as there are too many system parameters that remain unknown and experimentally uncharacterized.

It is indeed a relevant question whether our model is universal enough such that the qualitative conclusions hold for various plausible nuclear uptake models. The uptake model, without feedback to the cell cycle period (Figure 3), is already very general in the sense that import is modeled via a potential function, without the need of specifying how this potential is formed. The derivative of the potential is equal to the force, and together with diffusion they determine the full dynamics. There are no specific assumptions made regarding the experimental setup of cell-free extracts in the model itself, except for sizes and distances that are defined via model parameters. This means that all uptake models (in biology, physics, chemistry, …) that can be reduced to a potential function and diffusion will follow these dynamics within a certain range of parameters. We checked the influence of the parameters in the model in multiple (supplementary) figures, showing robustness within the given parameter ranges relevant to our experiments. Moreover, we have verified that multiple different shapes of the potential lead to similar results (not shown).

Finally, we also show in the supplementary figures of Figure 4 that the dynamics of competing pacemaker regions in reaction-diffusion systems are generic, always showing a similar transition between boundary waves and internal waves. Indeed, we showed that this behavior persisted in biochemically motivated models and universal models such as the FitzHugh-Nagumo system.

Altogether, this gives us confidence that the qualitative behavior (build-up of regulators at boundary due to nuclear uptake in systems with many nuclei + boundary waves in spatially coupled systems where those regulators increase the local oscillation frequency) is general. We now mention the generic character of our models in the main text.

2) Some of the analysis is still somewhat opaque. For instance, there is not a clearly visible wave in Figure 2C. It is also not clear how the choices to draw (or not draw) wave fronts are made in the analysis leading to Figure 5 – which is a central point of the paper; for instance, in panel C of Figure 5—figure supplement 1, the wave fronts could be drawn in multiple ways. In response to our concerns, the authors have noted their image analysis methods include "drawing lines by visually judging the disappearance of nuclei" and that they "show the robustness of the findings by changing the fitting parameters used in the analysis over a wide range". It is still not clear whether these lines are drawn manually or in a regimented, computerized fashion. We trust that they have done this procedure carefully enough that their conclusions would not be affected by whatever handling method they have chosen, but it would be nice to have a clearer description of what has been done as well as a more substantive supplementary dataset, e.g., an expanded version of Figure 5—figure supplement 1.

We agree that it is hard to see wave propagation in Figure 2C. However in the included Video 1 of the same experiment this is much clearer. We have stressed this in the text, such that a reader is not confused by Figure 2C and knows that the wave is most visible in Video 1.

The reviewer correctly points out that we can still explain in more detail the methodology that we use to calculate wave properties by drawing lines through a kymograph. We have now added panels D and E to old Figure 5—figure supplement 4 (new Figure 1—figure supplement 1), and have used those additional figures to better explain how we can get wave speeds from the microscopy data and we show that the potential error in wave speed estimates using this method is small.

Finally, we have added a new Figure 5—figure supplement 2 where we include additional kymographs of thicker (560um wide) tubes where we drew the lines using the method explained before. This figure helps to show that defining whether a wave is boundary-driven or internally-driven is unambiguous. All thicker tubes convincingly show waves that come from the boundary.

3) The new data on the dependency of mitotic wave speed on cell cycle timing shown in Figure 2A are very interesting. The observed dependency is difficult to reconcile with trigger waves and rather suggests a transition from sweep to trigger waves as the cell cycle slows down, as suggested by Vergassola et al., 2018. That must be stated. For example, authors could say: "The dependency of mitotic wave speed on cell cycle duration is consistent with a transition from sweep waves to trigger waves as cell cycle slows down, as proposed in Vergassola et al., 2018".

We have added the suggested comment.

4) The claims on the relevance of this paper findings to Drosophila must be further toned down. Even if the authors simulated sweep waves the internuclear distances used in the simulations are at least an order of magnitude higher than what is observe in Drosophila. So, in the fifth paragraph of the Discussion the authors should say something like: "However, the internuclear distance of our simulations is significantly larger than the one observed in the more crowded Drosophila embryo, so it remains unclear whether our results can directly extend to that system".

Indeed, we currently mainly use model parameters that are motivated by sizes and distances as observed in our experiments with Xenopus cell-free extracts. Although we have verified the generality of our results over a wide range of parameters, we have not changed the internuclear distance down to a scale of approx. 10 um, the approximate internuclear distance in Drosophila embryos. We have therefore added the suggested statement to stress that our results cannot directly be extended to Drosophila and this remains a question to be addressed in further research.

5) The importance of nuclear domains in Drosophila is an old concept named "energid". The authors should be clear about that in the second paragraph of the subsection “A computational model where nuclei spatially redistribute cell cycle regulators predicts the location of pacemaker regions”. It is also a bit misleading that the authors seem to imply that the nuclear domain of syncytial muscle or Drosophila embryos are similar in size to the ones observed in their experiments. They should comment on those importance size differences

We thank the reviewer for pointing out that there are important differences in size between the nuclear domain in Drosophila embryos and the nuclear domain in Xenopus cell-free extract. We now stress such differences in the manuscript.

Associated Data

    This section collects any data citations, data availability statements, or supplementary materials included in this article.

    Data Citations

    1. Nolet FE, Vandervelde A, Vanderbeke A, Pineros L, Chang JB, Gelens L. 2020. Nuclei determine the spatial origin of mitotic waves. Zenodo. [DOI] [PMC free article] [PubMed]

    Supplementary Materials

    Transparent reporting form

    Data Availability Statement

    All the data generated during the study are summarized and provided in the manuscript and supporting files. Source files have been provided for Figure 1, Figure 1—figure supplement 4, Figure 2, Figure 5—figure supplement 1, Box 2, Video 1 and Video 2 in the format of microscopy videos. Additionally, representative microscopy videos of all different conditions are provided as a Zenodo dataset (http://doi.org/10.5281/zenodo.3736728). The numerical codes that were used, together with an overview table of the performed experiments, are available through GitHub (Nolet, 2020; copy archived at https://github.com/elifesciences-publications/eLife_paper).

    All the data generated during the study are summarized and provided in the manuscript and supporting files. Source files have been provided for Figure 1, Figure 1-figure supplement 3, Figure 2, Figure 5-figure supplement 1, Box 2, Video 1 and Video 2 in the format of microscopy videos. Additionally, representative microscopy videos of all different conditions are provided as a Zenodo dataset (http://doi.org/10.5281/zenodo.3736728). The numerical codes that were used, together with an overview table of the performed experiments, are available through GitHub (https://github.com/felixnolet/eLife_paper; copy archived at https://github.com/elifesciences-publications/eLife_paper).

    The following dataset was generated:

    Nolet FE, Vandervelde A, Vanderbeke A, Pineros L, Chang JB, Gelens L. 2020. Nuclei determine the spatial origin of mitotic waves. Zenodo.


    Articles from eLife are provided here courtesy of eLife Sciences Publications, Ltd

    RESOURCES