Abstract
Purpose
This study was conducted evaluate the influence of reconstruction parameters of micro-computed tomography (micro-CT) images on bone mineral density (BMD) analyses.
Materials and Methods
The sample consisted of micro-CT images of the maxillae of 5 Wistar rats, acquired using a SkyScan 1174 unit (Bruker, Kontich, Belgium). Each acquisition was reconstructed following the manufacturer's recommendations (standard protocol; SP) for the application of artifact correction tools (beam hardening correction [BHC], 45%; smoothing filter, degree 2; and ring artifact correction [RAC], level 5). Additionally, images were reconstructed with 36 protocols combining different settings of artifact correction tools (P0 to P35). BMD analysis was performed for each reconstructed image. The BMD values obtained for each protocol were compared to those obtained using the SP through repeated-measures analysis of variance with the Dunnett post hoc test (α=0.05).
Results
The BMD values obtained from all protocols that used a BHC of 45% did not significantly differ from those obtained using the SP (P>0.05). The other protocols all yielded significantly different BMD values from the SP (P<0.05). The smoothing and RAC tools did not affect BMD values.
Conclusion
BMD values measured on micro-CT images were influenced by the BHC level. Higher levels of BHC induced higher values of BMD.
Keywords: Artifacts, Bone Density, X-Ray Microtomography
Introduction
Dental implants have been widely used as a rehabilitation alternative in patients with missing teeth. Osseointegration of implants depends on factors related to the professional (e.g., experience and the choice of surgical approach), to the implant (e.g., macrostructure and microstructure), and to the patient (e.g., oral hygiene and the quantity and quality of host bone at the implant site).1,2
Bone quality is crucial for the outcome of implant treatment.3 Bone mineral density (BMD), which is a factor that must be considered when assessing bone quality, can be evaluated through micro-computed tomography (micro-CT).4,5 Micro-CT is a non-invasive and non-destructive imaging modality that allows the visualization of structures at a micrometric level,6,7 providing image reconstructions with a high spatial resolution for detailed quantitative and qualitative analyses.7,8
Micro-CT is mostly used for scientific research purposes, due to its high radiation dose and the small image receptor.6 In implantology, it has been widely employed in studies on cortical thickness,9 the effects of age and osteoporosis,10 bone-implant integration,5 and bone characterization, such as bone volume fraction,4 bone microarchitecture,11 and bone quality.9,11
In the context of in vitro studies, along with histomorphometric analysis, micro-CT is considered to be a gold standard for bone density, as it provides information necessary for quantifying bone density, such as the ratio of bone volume to total volume.9,12,13 Additional advantages of using micro-CT rather than conducting a histomorphometric analysis include the possibility of a 3-dimensional microarchitectural analysis, less error due to shrinkage, greater time-effectiveness, and lower costs.14
Due to the characteristics of the radiation beam and detector, there are image artifacts in micro-CT that can affect image quality, such as beam hardening, ring artifacts, and noise.6,15,16 To overcome this limitation, specialized tools may be used during image reconstruction to reduce or eliminate these artifacts, such as beam hardening correction (BHC), a smoothing filter, and ring artifact correction (RAC).15,16,17
Attempting to correct beam hardening artifacts on micro-CT is important because these artifacts degrade the image quality with the appearance of cupping and streak lines, which may influence the linear attenuation coefficient values in the reconstruction of the image, consequently resulting in differences in measurements of BMD and bone mineral content.15 Although the manufacturer provides a protocol for these artifact correction tools, the manufacturer advises adjusting the intensity of these tools according to the clinician's subjective judgment.
Therefore, the aim of the present study was to evaluate the influence of artifact correction tools in the reconstruction of micro-computed tomography images for the analysis of BMD.
Materials and Methods
Micro-CT acquisition of the study sample
The present study was exempted from review by the local Institutional Ethics Committee on Animal Use since the sample consisted of micro-CT images of the maxillae of 5 female Wistar rats that were acquired for previously approved research (protocol 3344-1/2014).
The micro-CT scans were performed on a Skyscan 1174 micro-CT unit (Bruker, Kontich, Belgium) using the following settings: 50 kV; 800 µA; voxel size, 10.2 µm; aluminum filter, 0.5 mm; rotation step, 0.5°; 2 frames per rotation degree; and 180° rotation. Each maxilla was fixed with wax on the scanning platform to ensure a standardized position with the long axis vertical to the horizontal plane and individually scanned while wrapped in wet paper to maintain moisture during the scanning procedure, which lasted 35 minutes. All methods related to the acquisition, reconstruction, and image analysis were conducted by an oral radiologist with 6 years of experience in micro-CT imaging.
Micro-CT reconstruction of the experimental group
First, the raw micro-CT images were exported to the NRecon version 1.7.3.0 software (Bruker, Kontich, Belgium) and reconstructed according to the manufacturer's recommendations regarding the settings for artifact correction tools: BHC, 45%; smoothing, degree 2; and RAC, level 5. These settings were established as the standard protocol (SP). In addition, the histogram (gray values) of all images was standardized by setting the contrast range (minimum and maximum gray values). This step was performed by calculating the mean of the minimum gray value and the mean of the maximum gray value in the raw images of the rats' maxillae before reconstruction. The resulting histogram was applied to all subsequent reconstructed volumes for further analyses of BMD.
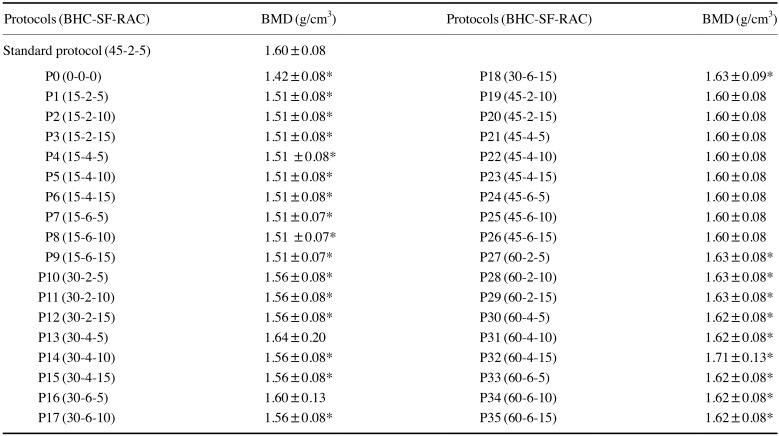
Subsequently, the raw images were reconstructed with 36 additional protocols (P0 to P35), one of them without any artifact correction tool (P0) and the others combining different settings of BHC (15%, 30%, 45%, and 60%), smoothing (degrees 2, 4 and 6), and RAC (levels 5, 10 and 15). All combinations of tools in each protocol are shown in the “Protocols” column in Table 1. Briefly, smoothing averages voxel values with those of neighboring voxels, and the values chosen represent a combination of sigma (standard deviation applied to the voxel averaging) and support (the width, in voxels, at which the filter is applied). Setting higher values for the smoothing filter means higher values of sigma and support. The RAC values represent the pixel diameter used for correction. For BHC, a linear transformation is applied, and higher percentage settings of this tool mean that the software makes a stronger correction.
Table 1. Selected reconstruction protocols of micro-CT and the mean and standard deviation of the bone mineral density (BMD) values.
BHC: beam hardening correction, SF: smoothing filter, RAC: ring artifact correction, *: P<0.05 compared with the standard protocol.
Micro-CT evaluation: BMD analysis
BMD was assessed using CTAn version 1.17.7.2+software (Bruker, Kontich, Belgium). Calibration was carried out before each BMD calculation,18 since the primary entity measured by micro-CT is the absorption of X-rays, defined as the attenuation coefficient per distance unit (mm), which in turn is determined by both the mass density and the elemental composition of the material. This calibration is done by scanning the material known to be the main substance responsible for the absorption of X-rays, making it possible to correlate the measured X-ray attenuation coefficient to the mass density of this material.18
Assuming that X-ray attenuation in mineralized bone tissues can be approximated as the X-ray attenuation of calcium hydroxyapatite,18 aqueous solutions of dipotassium phosphate (K2HPO4) were used to simulate the absorption of X-rays by the bone for software calibration. K2HPO4 is a highly water-soluble salt with an effective atomic number very close to that of calcium hydroxyapatite (15.58 and 15.86, respectively),19 and has been previously used as a calibration phantom to measure attenuation coefficients in micro-CT.20
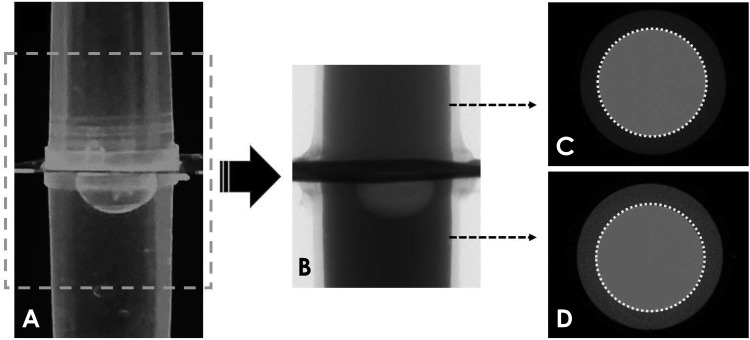
Thus, the software calibration was performed using a phantom composed of a solution of K2HPO4 at two different concentrations (600 and 1200 mg/mL), which produce attenuation coefficients equivalent to the trabecular bone and cortical bone, respectively.19,20,21 These solutions were placed in 2 Eppendorf tubes (0.2 mL; Axygen, Union City, CA, USA), which were positioned vertically and scanned together, using the same parameters as the study samples (Fig. 1). Subsequently, the phantom image was reconstructed using the protocols studied (SP and P0 to P35). The attenuation coefficient of both K2HPO4 solution concentrations was determined for each protocol to adjust the formula for BMD analysis. This step was done before the BMD calculation for each protocol.
Fig. 1. Illustration of the phantom used during software calibration for the BMD calculations. A. Phantom filled with K2HPO4 solutions at 600 mg/mL (upper compartment) and 1200 mg/mL (lower compartment). B. Raw micro-CT image. C and D. Axial micro-CT images showing the regions of interest used to obtain the attenuation coefficient of the solutions and to calibrate the software for BMD calculations. BMD: bone mineral density.
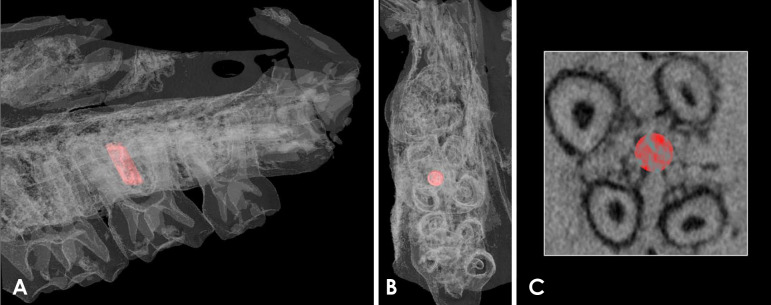
After the formula adjustment, the reconstructed images of the rats' maxillae were also imported into the CTAn software. A standardized circular region of interest (ROI) (consisting of 100 slices, 0.5 mm in diameter) in the furcation region of the right upper second molar was determined and saved, so that the same ROI could be applied in the analysis of all samples (Fig. 2). Threshold values were set for bone and the calibration phantom (maximum, 255; minimum, 61). Then, the BMD (g/cm3) for the ROI was obtained.
Fig. 2. Three-dimensional volume rendering of the maxilla of a rat used in the present study. A. Lateral view of the maxilla with the region of interest highlighted in red (0.5 mm diameter and 100 slices) placed among the roots of the right upper second molar. B. Axial view of the region of interest. C. Axial image of the micro-CT scan with the region of interest marked in red. CT, computed tomography.
Statistical analysis
SPSS version 22.0 (IBM Corp., Armonk, NY, USA) was used for data analysis. The mean BMD values obtained using each protocol were compared to those obtained using the SP by repeated-measures analysis of variance (ANOVA) with the Dunnett post hoc test. The statistical significance level was set at P<0.05.
Results
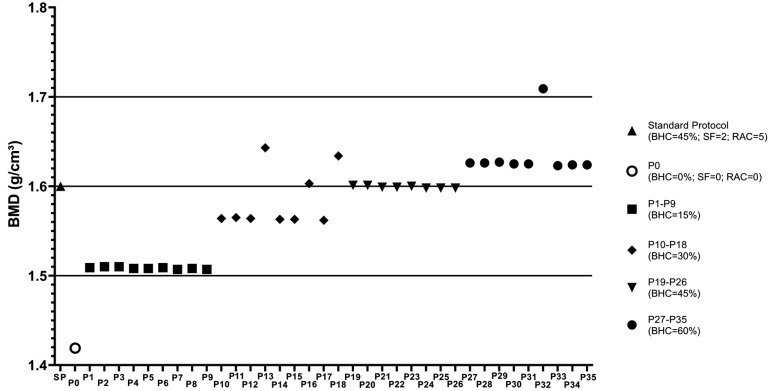
Table 1 shows the means and standard deviations of the BMD values obtained for all micro-CT reconstruction protocols. The BMD obtained using the SP was 1.6±0.08 g/cm3, while using P0, a protocol without application of any artifact reduction tool, this value decreased to 1.4±0.08 g/cm3. However, it was observed that the BMD values obtained using the protocols with BHC at 45% (P19 to P26) and with BHC at 30% (P13 and P16) did not significantly differ from those obtained using the SP (P>0.05). For the other protocols, the BMD value was directly proportional to the degree of application of the BHC tool, yielding a statistically significant difference from the SP values (P<0.05) (Fig. 3). In general, the BMD values obtained using protocols with a BHC at 15% were slightly above 1.5 g/cm3, while the protocols with BHC set at 30% resulted in BMD values between 1.5 and 1.6 g/cm3, those with BHC set at 45% generated BMD values of 1.6 g/cm3, and protocols with BHC set at 60% resulted in BMD values slightly above 1.6 g/cm3. Variation in the settings of the smoothing and RAC tools did not affect BMD values (Table 1).
Fig. 3. Distribution graph showing the mean BMD values for each protocol tested. Different symbols represent the standard protocol (SP), the protocol without artifact correction tools (P0), and protocols with different degrees of beam-hardening correction (BHC), varying from 15% to 60%. BMD: bone mineral density, SF: smoothing filter, RAC: ring artifact correction.
Discussion
The results showed a direct relationship between measured BMD values and the BHC level (i.e., BMD values were higher when protocols with higher BHC levels were used). Due to the polyenergetic characteristic of X-ray beams, beam hardening causes a discrepancy in the linear attenuation coefficient assumption.6,22 As an effect of this phenomenon, the edges (smaller thickness) of the scanned sample seem to be denser than the central region (higher thickness), also known as the “cupping” effect.20,23
Beam filtration is an option for reducing beam hardening. Meganck et al.17 evaluated the influence of different thicknesses of aluminum and copper filters on beam hardening for BMD evaluation in murine bone, concluding that filtration added to a beam flattener did not require software processing for BHC, as shown by the lack of an impact on BMD estimation, although BHC may decrease image contrast and increase image noise. However, high filtration might impair the assessment of mouse bone and soft tissue.22
Koubar et al.15 proposed a method for BHC based on linear attenuation curves for each material scanned (water, soft tissue, and bone), resulting in accurate bone mass measurements, with an error of −3.4% for mouse skulls. A cone-beam micro-CT unit constructed at the researchers' own institution was used in that study. The BHC tool in the NRecon software uses a linearization process based on a polynomial algorithm that reduces the non-linearity within the sample.20 As shown by Fajardo et al.,23 as the level of BHC increases (in %), the mean attenuation of the sample also increases, resulting in a more hyperdense (brighter) image. This fact explains the direct relationship found between BMD and BHC levels in the present study. A previous study, despite the use of a different micro-CT unit, reported that BHC was the most important predictor for BMD.24 BMD errors related to the size of the samples are dependent on object structure and BHC level, with the latter being crucial for reducing these errors.23 The present study evaluated the impact of combinations of artifact correction tools in BMD values in comparison with the manufacturer's protocol and found statistically significant differences. Further investigation of BHC levels in different samples regarding size, bone from different regions (e.g., jaw bones, long bones, etc.), different animals, and different micro-CT units should be carried out to establish optimum protocols for BMD assessment.
Ring artifacts may impair the quantitative 3D analysis of micro-CT data.25 Flat-field correction, detector shifting, and data inpainting can be pre-processing tools for minimizing ring artifacts, but do not completely remove these artifacts.25,26 Some post-processing methods have been reported successful for this task, using mean and medial filtering based on polar coordinates25 and an adaptive correction scheme.27 However, the value applied in NRecon (from 0 to 20) is determined empirically, and higher values are not recommended, as they can cause image blurring or even new ring artifacts. Noise can also impair 3D image analyses (e.g., edge detection, image segmentation, and volume rendering).16 Smoothing (also sometimes referred to as “blurring”) reduces noise by averaging the defective noise voxels with the gray values of neighboring voxels, normally by a Gaussian or median filter.
Despite the change in voxels' gray values from both RAC and smoothing, which replace data by an average of surrounding values, those tools did not seem to influence the BMD measurements, except for P13 (BHC, 30%; RAC, 5; smoothing, 4) and P16 (BHC, 30%; RAC, 5; smoothing, 4) which unexpectedly did not differ from the SP. The standard deviations of protocols P13 and P16 were also higher than those of the other protocols, which may be attributed to this result. In contrast, P10 had the same RAC and BHC levels, but a lower smoothing of 2, and behaved as expected. Additionally, protocols P18 (BHC, 30%; high RAC; medium smoothing) and P32 (high BHC; high RAC; and medium smoothing) presented unexpected behavior, with higher BMD values than the other protocols with the same BHC. More studies should focus on understanding not only the behavior of these tools in isolation, but also their behavior when combined.
Gramanzini et al.5 concluded that micro-CT is a viable tool to characterize bone density. However, that study, as well as most previous studies that assessed BMD through micro-CT for bone quality assessments in implantology, did not report the reconstruction parameters and artifact correction tools that were applied,4,5,9,10,28 while Hua et al.11 only cited the smoothing values used. According to our results, these reconstruction protocols influence BMD analysis, which makes it difficult to adequately analyze and compare studies. Therefore, the reconstruction parameters should always be described in future research.
Proper calibration is necessary to ensure the accuracy of BMD analysis. The present results were obtained using a home-made phantom with homogeneous solutions of K2HPO4 at 2 different concentrations (600 and 1200 mg/mL), with attenuation coefficients equivalent to the trabecular and cortical bone, respectively. K2HPO4, which is water-soluble, displays the same absorption characteristics as hydroxyapatite over a wide range of energies and overcomes the solubility problem of using the mineral hydroxyapatite, which is the main component of calcified bone that causes X-ray attenuation.29 The accuracy of the mineralization density of this compound was determined by comparing its measured linear attenuation coefficients with the theoretical values from previous studies.20,29,30 Furthermore, the recommendations of the micro-CT unit manufacturer regarding size, diameter, and positioning were followed when making the phantoms.18
In conclusion, this study showed that the level of the BHC tool used in the reconstruction of micro-CT images influenced the BMD analysis; specifically, higher BHC levels resulted in higher BMD values. Therefore, direct comparisons between studies using different BHC levels are not appropriate. Calibration of the scanned sample density and dimensions, with adequate phantoms, is recommended to ensure reproducibility. A single micro-CT unit was used in this study, so further research is required to evaluate how other micro-CT units and their artifact correction tools influence the values obtained in BMD analysis.
Footnotes
This study was financed in part by the Coordenação de Aperfeiçoamento de Pessoal de Nível Superior - Brasil (CAPES) - Finance Code 001.
Conflicts of Interest: None
References
- 1.Isoda K, Ayukawa Y, Tsukiyama Y, Sogo M, Matsushita Y, Koyano K. Relationship between the bone density estimated by cone-beam computed tomography and the primary stability of dental implants. Clin Oral Implants Res. 2012;23:832–836. doi: 10.1111/j.1600-0501.2011.02203.x. [DOI] [PubMed] [Google Scholar]
- 2.Ko YC, Huang HL, Shen YW, Cai JY, Fuh LJ, Hsu JT. Variations in crestal cortical bone thickness at dental implant sites in different regions of the jawbone. Clin Implant Dent Relat Res. 2017;19:440–446. doi: 10.1111/cid.12468. [DOI] [PubMed] [Google Scholar]
- 3.Karakida LM, Araujo CM, Johann AC, Camargo ES, Tanaka OM, Filho OG. Interaction of anabolic androgenic steroids and induced tooth ovement in rats. Braz Dent J. 2017;28:504–510. doi: 10.1590/0103-6440201601119. [DOI] [PubMed] [Google Scholar]
- 4.Parsa A, Ibrahim N, Hassan B, van der Stelt P, Wismeijer D. Bone quality evaluation at dental implant site using multislice CT, micro-CT, and cone beam CT. Clin Oral Implants Res. 2015;26:e1–e7. doi: 10.1111/clr.12315. [DOI] [PubMed] [Google Scholar]
- 5.Gramanzini M, Gargiulo S, Zarone F, Megna R, Apicella A, Aversa R, et al. Combined microcomputed tomography, biomechanical and histomorphometric analysis of the peri-implant bone: a pilot study in minipig model. Dent Mater. 2016;32:794–806. doi: 10.1016/j.dental.2016.03.025. [DOI] [PubMed] [Google Scholar]
- 6.Bouxsein ML, Boyd SK, Christiansen BA, Guldberg RE, Jepsen KJ, Müller R. Guidelines for assessment of bone microstructure in rodents using micro-computed tomography. J Bone Miner Res. 2010;25:1468–1486. doi: 10.1002/jbmr.141. [DOI] [PubMed] [Google Scholar]
- 7.Rutty GN, Brough A, Biggs MJ, Robinson C, Lawes SD, Hainsworth SV. The role of micro-computed tomography in forensic investigations. Forensic Sci Int. 2013;225:60–66. doi: 10.1016/j.forsciint.2012.10.030. [DOI] [PubMed] [Google Scholar]
- 8.Swain MV, Xue J. State of the art of micro-CT applications in dental research. Int J Oral Sci. 2009;1:177–188. doi: 10.4248/IJOS09031. [DOI] [PMC free article] [PubMed] [Google Scholar]
- 9.Suttapreyasri S, Suapear P, Leepong N. The accuracy of conebeam computed tomography for evaluating bone density and cortical bone thickness at the implant site. J Craniofac Surg. 2018;29:2026–2031. doi: 10.1097/SCS.0000000000004672. [DOI] [PubMed] [Google Scholar]
- 10.Freitag L, Günther C, Eberli U, Fürst A, Zeiter S, Stadelmann VA. Relative effects of age on implant integration in a rat model: a longitudinal in vivo microct study. J Orthop Res. 2019;37:541–552. doi: 10.1002/jor.24210. [DOI] [PubMed] [Google Scholar]
- 11.Hua Y, Bi R, Zhang Y, Xu L, Guo J, Li Y. Different bone sites-specific response to diabetes rat models: bone density, histology and microarchitecture. PLoS One. 2018;13:e0205503. doi: 10.1371/journal.pone.0205503. [DOI] [PMC free article] [PubMed] [Google Scholar]
- 12.Rüegsegger P, Koller B, Müller R. A microtomographic system for the nondestructive evaluation of bone architecture. Calcif Tissue Int. 1996;58:24–29. doi: 10.1007/BF02509542. [DOI] [PubMed] [Google Scholar]
- 13.Feldkamp LA, Goldstein SA, Parfitt AM, Jesion G, Kleerekoper M. The direct examination of three-dimensional bone architecture in vitro by computed tomography. J Bone Miner Res. 1989;4:3–11. doi: 10.1002/jbmr.5650040103. [DOI] [PubMed] [Google Scholar]
- 14.Uchiyama T, Tanizawa T, Muramatsu H, Endo N, Takahashi HE, Hara T. A morphometric comparison of trabecular structure of human ilium between microcomputed tomography and conventional histomorphometry. Calcif Tissue Int. 1997;61:493–498. doi: 10.1007/s002239900373. [DOI] [PubMed] [Google Scholar]
- 15.Koubar K, Bekaert V, Brasse D, Laquerriere P. A fast experimental beam hardening correction method for accurate bone mineral measurements in 3D μCT imaging system. J Microsc. 2015;258:241–252. doi: 10.1111/jmi.12238. [DOI] [PubMed] [Google Scholar]
- 16.Shahmoradi M, Lashgari M, Rabbani H, Qin J, Swain M. A comparative study of new and current methods for dental micro-CT image denoising. Dentomaxillofac Radiol. 2016;45:20150302. doi: 10.1259/dmfr.20150302. [DOI] [PMC free article] [PubMed] [Google Scholar]
- 17.Meganck JA, Kozloff KM, Thornton MM, Broski SM, Goldstein SA. Beam hardening artifacts in micro-computed tomography scanning can be reduced by X-ray beam filtration and the resulting images can be used to accurately measure BMD. Bone. 2009;45:1104–1116. doi: 10.1016/j.bone.2009.07.078. [DOI] [PMC free article] [PubMed] [Google Scholar]
- 18.Nazarian A, Snyder BD, Zurakowski D, Müller R. Quantitative micro-computed tomography: A non-invasive method to assess equivalent bone mineral density. Bone. 2008;43:302–311. doi: 10.1016/j.bone.2008.04.009. [DOI] [PubMed] [Google Scholar]
- 19.Oliveira ML, Tosoni GM, Lindsey DH, Mendoza K, Tetradis S, Mallya SM. Assessment of CT numbers in limited and medium field-of-view scans taken using Accuitomo 170 and Veraviewepocs 3De cone-beam computed tomography scanners. Imaging Sci Dent. 2014;44:279–285. doi: 10.5624/isd.2014.44.4.279. [DOI] [PMC free article] [PubMed] [Google Scholar]
- 20.Mulder L, Koolstra JH, Van Eijden TM. Accuracy of microCT in the quantitative determination of the degree and distribution of mineralization in developing bone. Acta Radiol. 2004;45:769–777. doi: 10.1080/02841850410008171. [DOI] [PubMed] [Google Scholar]
- 21.Sevilla RS, Cruz F, Chiu CS, Xue D, Bettano KA, Zhu J, et al. Development and optimization of a high-throughput micro-computed tomography imaging method incorporating a novel analysis technique to evaluate bone mineral density of arthritic joints in a rodent model of collagen induced arthritis. Bone. 2015;73:32–41. doi: 10.1016/j.bone.2014.11.014. [DOI] [PubMed] [Google Scholar]
- 22.Salmon PL, Liu X. MicroCT bone densitometry: context sensitivity, beam hardening correction and the effect of surrounding media. Open Access J Sci Technol. 2014;2:101142 [Google Scholar]
- 23.Fajardo RJ, Cory E, Patel ND, Nazarian A, Laib A, Manoharan RK, et al. Specimen size and porosity can introduce error into microCT-based tissue mineral density measurements. Bone. 2009;44:176–184. doi: 10.1016/j.bone.2008.08.118. [DOI] [PMC free article] [PubMed] [Google Scholar]
- 24.Entezari V, Vartanians V, Zurakowski D, Patel N, Fajardo RJ, Müller R, et al. Further improvements on the factors affecting bone mineral density measured by quantitative micro-computed tomography. Bone. 2012;50:611–618. doi: 10.1016/j.bone.2011.10.004. [DOI] [PubMed] [Google Scholar]
- 25.Kyriakou Y, Prell D, Kalender WA. Ring artifact correction for high-resolution micro CT. Phys Med Biol. 2009;54:N385–N391. doi: 10.1088/0031-9155/54/17/N02. [DOI] [PubMed] [Google Scholar]
- 26.Zhu Y, Zhao M, Li H, Zhang P. Micro-CT artifacts reduction based on detector random shifting and fast data inpainting. Med Phys. 2013;40:031114. doi: 10.1118/1.4790697. [DOI] [PubMed] [Google Scholar]
- 27.Anas EM, Lee SY, Hasan K. Classification of ring artifacts for their effective removal using type adaptive correction schemes. Comput Biol Med. 2011;41:390–401. doi: 10.1016/j.compbiomed.2011.03.018. [DOI] [PubMed] [Google Scholar]
- 28.Tanaka M, Yamashita-Mikami E, Akazawa K, Yoshizawa M, Arai Y, Ejiri S. Trabecular bone microstructure and mineral density in human residual ridge at various intervals over a long period after tooth extraction. Clin Implant Dent Relat Res. 2018;20:375–383. doi: 10.1111/cid.12591. [DOI] [PubMed] [Google Scholar]
- 29.Nuzzo S, Peyrin F, Cloetens P, Baruchel J, Boivin G. Quantification of the degree of mineralization of bone in three dimensions using synchrotron radiation microtomography. Med Phys. 2002;29:2672–2681. doi: 10.1118/1.1513161. [DOI] [PubMed] [Google Scholar]
- 30.Nazarian A, Snyder BD, Zurakowski D, Müller R. Quantitative micro-computed tomography: a non-invasive method to assess equivalent bone mineral density. Bone. 2008;43:302–311. doi: 10.1016/j.bone.2008.04.009. [DOI] [PubMed] [Google Scholar]


