

Abstract
Manganese (Mn) is both essential element and neurotoxicant. Exposure to Mn can occur from various sources and routes. Structural equation modeling was used to examine routes of exposure to Mn among children residing near a ferromanganese refinery in Marietta, Ohio. An inhalation pathway model to ambient air Mn was hypothesized. Data for model evaluation were obtained from participants in the Communities Actively Researching Exposure Study (CARES). These data were collected in 2009 and included levels of Mn in residential soil and dust, levels of Mn in children’s hair, information on the amount of time the child spent outside, heat and air conditioning in the home and level of parent education. Hair Mn concentration was the primary endogenous variable used to assess the theoretical inhalation exposure pathways. The model indicated that household dust Mn was a significant contributor to child hair Mn (0.37). Annual ambient air Mn concentration (0.26), time children spent outside (0.24) and soil Mn (0.24) significantly contributed to the amount of Mn in household dust. These results provide a potential framework for understanding the inhalation exposure pathway for children exposed to ambient air Mn who live in proximity to an industrial emission source.
Keywords: Structural equation model (SEM), Dispersion modeling, Dust, Hair, Blood
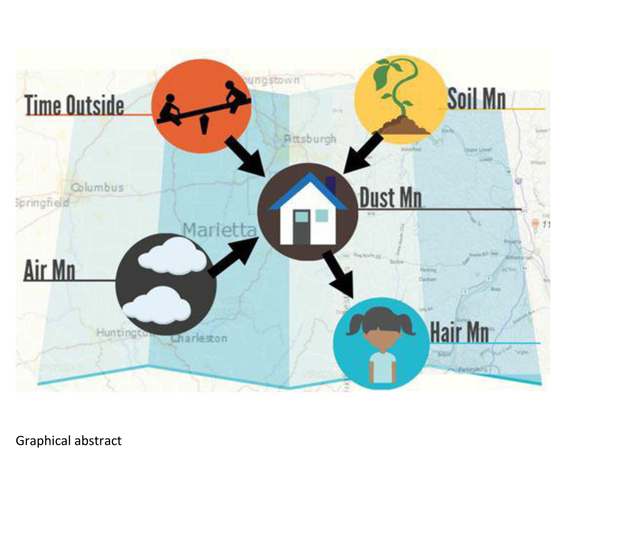
Graphical Abstract
1. Introduction
Although manganese (Mn) is an essential nutrient necessary for normal metabolic functioning, excessive exposure may result in neurotoxic effects. Occupational exposure to Mn has been associated with neurological impacts ranging from impairment of motor function to decreases in visual perception and memory (Bouchard et al., 2008; Bowler et al., 2006; Lucchini et al., 1997). Significant associations have been identified between the level of Mn in children’s hair and a number of neurodevelopmental health outcomes (Bouchard et al., 2007; Bouchard et al., 2011; Carvalho et al., 2014; Lucchini et al., 2012; Menezes-Filho et al., 2009; Riojas-Rodriguez et al., 2010; Rugless et al 2014; Haynes et al 2015). A systematic review found a 50% increase in hair Mn concentration was associated with a decrease in IQ of 0.7 among children ages 5–15 (Rodriguez-Barranco et al., 2013). Neurological health outcomes in children have been associated with Mn in soil (Lucchini et al., 2012) and Mn in children’s hair was found to be associated with Mn levels in ambient air (Haynes et al., 2010). In a South African study, the relationship between Mn in children’s blood and Mn in classroom dust and playground soil approached statistical significance (p=0.10) (Rollin et al., 2005). Understanding the sources, routes, and magnitude of Mn exposure is essential in identifying preventive strategies. It is currently not clear how these pathways are related and the relative impact each may have in an individual’s total Mn exposure. One approach to model exposure pathways is structural equation models (SEMs). SEM is a multivariate statistical technique that facilitates the simultaneous testing of networks of relationships between a set of variables (Buncher et al., 1991; von Lindern et al., 2015). The flexibility of the SEM approach can provide a framework to identify potential casual pathways and evaluate multiple Mn exposure scenarios simultaneously.
The 2002 National-Scale Air Toxics Assessment (US EPA, 2002) reported that of the 23 air toxics with potential for neurological effects, Mn is the most significant contributor at 28 percent. Mn was included in an analysis of air pollutants in a 2009 United States Environmental Protection Agency (USEPA) survey of outdoor air quality at 63 schools in 22 states, demonstrating USEPA’s concern for children’s potential environmental exposure to this neurotoxin in ambient air (US EPA, 2010). A mean level of Mn in air of 1.46 μg/m3 was detected at Warren Elementary School in Marietta, Ohio (US EPA, 2010). This level exceeds the reference concentrations for chronic exposure to inhaled manganese set by USEPA (0.05 μg Mn/m3), ATSDR (0.04 μg Mn/m3), and the World Health Organization (WHO) (0.15 μg Mn/m3) (ATSDR, 2012; US EPA, 1999; WHO, 2000). Warren Elementary School is about 5 km from Eramet Marietta, Inc, the longest running manganese refinery in the United States. The primary aim of this study was to examine theoretical Mn inhalation exposure pathways for children living near the ferromanganese refinery enrolled in the Communities Actively Researching Exposure Study (CARES) using SEM. CARES is an epidemiological investigation of the potential neurobehavioral effects of air Mn exposure on children residing in Marietta, OH.
2. Methods
2.1. Study Population
CARES was initiated in response to community concern about potential neurobehavioral impacts on children exposed to Mn (Haynes et al., 2011). Study participants were recruited via letters through schools and local radio and newspaper advertisement. Those eligible for enrollment in CARES were children ages 7 – 9 years who resided in the Marietta, Ohio community since birth. In addition, their biological mother must have resided in close proximity to Marietta during pregnancy with the child. Recruitment occurred from October, 2008 to March, 2013; data for the current analysis was obtained from participants enrolled and sampled from Jan 1, 2009 to Dec 31, 2009. The University of Cincinnati Institutional Review Board approved the CARES study and all parents signed an informed consent while the children signed an informed assent.
Each participating family completed a questionnaire capturing information about the residence including type of heating and air conditioning, where the child attended school, and how much time the child plays outside. As the amount of time children spend outdoors may impact their overall exposure to ambient Mn, detailed questions were asked regarding the number of hours per day the child spent outdoors. The Barratt Simplified Measure of Social Status (BSMSS) was also administered at the home visit (Barratt, 2012) to assess education level of the child’s parent/legal guardian. The parent education score was used as a surrogate for socioeconomic status (SES) in the SEM model. Information collected on heating and air conditioning was combined into an index representing air filtration in the home, referred to as the heating, ventilation, and air conditioning (HVAC) Score. An electric, gas or heating oil furnace as the primary heating source received an HVAC score of 2 and as a secondary heating source received an HVAC score of 1. If the primary heating source had an air filter a score was given based on frequency of filter change: once a month = 1; once every three months = 0.75, every six months = 0.5 and annually = 0.25. If the primary source of cooling for the home was central air conditioning or individual air conditioning units, a score of 2 was assigned. If the air conditioning unit had an air filter a score was given based on frequency of filter change following the same pattern as for the heating source. A score of 1 was given if the home also had an air purifier. Scores for each response were summed to represent a total HVAC Score for the dwelling. Possible values ranged from 0 to 8 with higher HVAC Scores linked to higher household air filtration.
2.2. Soil and Dust Sample Collection and Analysis
The CARES environmental sampling team were members of the community trained to collect samples of soil and dust from residences of study participants following HUD protocols for sample collection (HUD, 1995). Sample collection forms were completed for each dwelling including address, owner name, phone number and Geographic Information Systems (GIS) coordinates. Within 10% of the households, field duplicate soil and dust samples were collected for quality control (QC). In addition, standardized QC dust samples were prepared by the Hematology and Environmental Laboratory at the University of Cincinnati using the same materials as collection of field samples and National Institute of Standards and Technology (NIST) standard reference materials. These samples were randomly inserted into the sample stream for assessment of QC of the digestion and analysis process at the laboratory.
At each residence a composite surface soil sample was collected from six random locations within the yard. Locations selected for sampling were bare soil in an area free of rocks and other debris. At each location, a stainless steel spatula was used to scrape one-half inch of bare soil and to transfer the soil to a baggie. Samples were composited and after the final sample was collected the baggie was zip-locked, double bagged and labeled with participant identification. Protective gloves were worn during sample collection and the spatula decontaminated prior to leaving the site by wiping with wet wipes until all visible dirt was removed. One final wipe of the spatula was completed to ensure no contamination remained on the spatula.
Interior floor dust samples were collected from three sites within the residence. The preferred sites were the front entry of the home, the kitchen, and the room where the child spends the most awake time (e.g.; living room, bedroom, or playroom). Dust samples were collected using a wet wipe method (HUD, 1995). A plexiglass template or tape boundaries were used to delineate a one square foot sample area. Prior to sampling the area was inspected and obvious foreign material removed. Using a wet wipe, visible dust was collected from the surface using a two-pass approach. The first wipe pass was from right to left following an S pattern across the entire surface. After folding the wipe in half with the contaminated side facing inward, a second wipe pass was from top to bottom, also following an S pattern. The wipe was then folded again with the contaminated side facing inward and inserted in a centrifuge tube and labeled with sample identification. To prevent cross-sample contamination, clean disposable gloves were used and changed prior to collection of each sample. Sample templates and wipe containers were also cleaned with one wipe prior to every dust sample. The room, the surface type and surface condition were recorded for each sample.
Soil and dust samples were analyzed for Mn following a method adapted from USEPA Method 3050B Acid Digestion of Sediments, Sludges, and Soils. (US EPA 1996). For soil samples a nominal one gram of soil from the composited sample was placed in an extraction tube. For dust samples, each wipe was placed in a separate extraction tube. To each sample 5 milliliters (ml) of one part water to one part nitric acid (HNO3), 0.05 ml of 1000 parts per million (ppm) of gold (Au), and 2 ml of hydrochloric acid (HCl) were added. Samples were racked and placed in a SCP Science 48 well Digi-Prep digestion block at 95° Celsius (C) for one hour to allow a 15 to 20 minute reflux of the sample. After cooling of the sample to room temperature, 2.5 ml of concentrated HNO3 was added and samples returned to the digestion block for two hours at 95° C. Samples were removed, cooled to room temperature, 1 ml of Millipore Element deionized water (DIW) and 1.5 ml of hydrogen peroxide (H2O2) were added to the sample prior to returning them to the digestion block for an additional 2 hours at 95°C. Once removed and cooled to room temperature, samples were diluted to final volume of 50 ml with DIW, capped tightly, shaken and placed in a Beckman G6 centrifuge at 1700 revolutions per minute (RPM) for 20 minutes. For wipe samples, all samples from a single residence were combined prior to final dilution. Samples were analyzed by a Thermo X-Series II Inductively Coupled Plasma Mass Spectrometer (ICP-MS) with collisions cell, 10% hydrogen, helium and 1% ammonia gases. The reported limit of detection (LoD) for Mn in dust was 5.0 μg and for soil Mn was 25 mg/kg. Laboratory and field duplicates for both soil and dust samples were analyzed for Mn. Levels of Mn in dust were reported by the lab as μg. Prior to statistical analysis dust sample concentrations were divided by the number of sample wipes to obtain dust levels as micrograms per square foot (μg/ft2). Summary statistics are reported as μg/m2 to conform to SI units. Research Triangle Institute (Research Triangle Park, NC) conducted sample preparation and analysis.
2.3. Hair Collection and Analysis
Hair samples were collected from the occipital region using ceramic scissors cleaned with alcohol. Approximately 20 strands of hair at least one centimeter (cm) in length were isolated and cut close to the scalp. For children with long hair, the sample was trimmed to 6 cm and taped at the non-scalp end of the hair to an index card with an arrow indicating the scalp end. Samples were deposited in a clean white envelope labeled with participant identification. All samples were shipped to the Channing Trace Metals Laboratory, Harvard School of Public Health (Boston, Massachusetts) for analysis. At the laboratory, hair samples were rinsed in a 1% Triton X-100 solution followed by several rinses with distilled deionized water (Wright et al, 2006). After drying at 70° C for 24 hours, samples were then acid digested using concentrated HNO3. Analysis for Mn was performed using ICP-MS, with each sample measured by the instrument five times and the average reported for each participant. The method detection limit (MDL) for Mn in hair was 0.002 mg/kg.
2.4. Measures of Ambient Mn Exposure
Ambient Mn exposure was characterized by two measures: a time-weighted distance (TWD) proximity measure from the primary airborne Mn source, and a modeled annual Mn ambient concentration based on emissions from the primary source. The TWD measure was developed for the CARES participants and published in two previous assessments of childhood exposure to Mn (Haynes et al., 2012; Rugless et al., 2014). It is based on the distance in kilometers of the child’s residence and school from the ferromanganese refinery and estimates of time spent at home and at school. The values for time at home and school were derived from daily activity logs for children participating in the personal air Mn study and set at 70% and 30%, respectively. Annual ambient Mn concentrations for residences and schools were modeled using the USEPA air dispersion model AERMOD (USEPA, 2004). AERMOD is a steady-state plume model that incorporates meteorological data and terrain data, as well as point source emissions data, to estimate location specific ambient concentrations of air pollutants. It simulates short-range dispersion (< 50 km) based on planetary boundary layer turbulence structure and scaling concepts (Maantay et al., 2009; Zou, et al., 2010). Details of the modeling approach are provided elsewhere (Fulk et al., 2016). Briefly, monitored data were available for the full calendar year 2009 and modeled concentrations were based on the same time window. The current study uses the annual ambient Mn concentrations derived from the 2009 modeled concentrations from AERMOD. Output from AERMOD included monthly ambient Mn μg/m3 concentration levels for each school and participant residence and annual ambient Mn concentrations were calculated by averaging the monthly concentrations.
2.5. Inhalation Exposure Pathway
Theoretical inhalation exposure pathways for Mn exposure were developed based on a population of children environmentally exposed to manganese through industrial air emissions (Figure 1). The inhalation pathways were constructed based on the following concepts: children inhale Mn directly through exposure to Mn in ambient air; ambient air Mn infiltrates the home and is deposited in household dust and the child inhales the dust; ambient air Mn is deposited in soil at children’s residences, tracked into the home, deposited in household dust, and the child inhales the dust. Factors that may act upon these pathways include how much time a child spends outdoors and the type of heating, air conditioning and air filtration that occurs in the home. Hair Mn is a biomarker of Mn exposure and given that hair grows approximately 1 cm per month, reflects exposure and uptake of Mn over longer time frames (Bouchard et al., 2011; Eastman et al., 2013). It is included in the pathway model as the measure of the child’s total Mn exposure. The modeled annual ambient air Mn concentrations are included as the ambient exposure level. Children’s environmental exposures may be modified by family demographics such as SES, thus parent education level is included as an indicator of SES (Gunier et al., 2014).
Figure 1: Theoretical Pathway Model for Children’s Inhalation Exposure to Mn.

Endogenous variables represented by ovals; Exogenous variables represented by rectangles; Dust Mn = Household Dust Mn
2.6. Statistical Analysis
All statistical analyses were performed using SAS 9.4 and MPlus Software Version 4.2 (Muthen & Muthen, 2006; SAS, 2013). Descriptive statistics were calculated for all variables. Normality of analysis variables was evaluated with the Shapiro-Wilk test for normality and histograms. Where normality was lacking, the natural log transformation (ln) was used to achieve normality. Pearson bivariate correlations and bivariate plots provided an assessment of associations between Mn levels in hair, dust and soil and all other analysis variables. Initial SEM model analyses were conducted using the CALIS procedure in SAS 9.4. Once a final SEM model was determined, an analysis that imputed missing data was performed with Mplus Software to increase sample size. Analyses were performed on the variance-covariance matrix and used the maximum likelihood method for parameter estimation. Path coefficients were estimated and measure the direct effect of one variable on another along the pathway. Sign of the path coefficient indicates the direction of the effect. Two-sided t-tests were used to determine significance of path coefficients. Multiple model fit statistics were used to assess goodness-of-fit: chi-squared test (χ2), the comparative fit index (CFI), the normed fit index (NFI) and the non-normed fit index (NNFI). The CFI and the NNFI are good measures of fit for all sample sizes while the NFI may underestimate the goodness-of-fit in small samples (Hatcher, 2006).
Manganese measured in soil, dust and hair were the endogenous variables in the constructed model. Exogenous variables included modeled annual ambient Mn concentrations, HVAC Score, average weekly time outdoors, and parent education. All variables were treated as manifest variables and provided a direct measure of the variable of interest.
3. Results
3.1. Data Summary
There were 88 children enrolled in CARES in 2009. Of these, 92% were white/Caucasian, 57% were female and the average age was 8.6 years. Descriptive statistics for the study population are provided in Table 1. The hair Mn levels ranged from 0.096 mg/kg to 7.38 mg/kg with a median level of 0.44 mg/kg. The greatest TWD was 17.7 km and the least was 3.5 km (median 11.0 km). The median modeled annual ambient Mn concentration was 19.3 ng/m3 (range 5.8 ng/m3 - 159.9 ng/m3) and 26% of the values were above 50 ng/m3, the reference concentration for chronic exposure to inhaled manganese set by USEPA (US EPA, 1999).
Table 1:
Summary Statistics for Communities Actively Researching Exposure Study (CARES) Participants in Marietta, Ohio
| n | Mean(SD) | Range | Median | |
|---|---|---|---|---|
| Age (years) | 88 | 8.6 (0.9) | 7.0 – 10.0 | 8.7 |
| Time Weighted Distance (km) | 88 | 10.6 (3.5) | 3.5 – 17.7 | 11.0 |
| Parent Education(BSMSSa) | 88 | 14.7 (2.4) | 9.0 – 20.0 | 15.0 |
| HVAC Scoreb | 88 | 4.91 (1.08) | 1.00 – 7.00 | 5.00 |
| Hair Mn (mg/kg) | 77 | 0.83 (1.25) | 0.096 – 7.38 | 0.44 |
| Household Dust Mn (μg/m2) | 71 | 107 (136) | 8 – 746 | 59 |
| Soil Mn (mg/kg) | 71 | 597 (366) | 94 – 2229 | 552 |
| Modeled Annual Mn (ng/m3) | 88 | 33.9 (30.3) | 5.8 – 159.9 | 19.3 |
| Time Spent Outside (hrs/week) | 88 | 25.1 (9.4) | 8.8 – 55.0 | 23.9 |
| Log Hair Mn | 77 | 6.18 (0.95) | 4.57 – 8.91 | 6.10 |
| Log Dust Mn | 71 | 1.82 (0.95) | −0.31 – 4.24 | 1.70 |
| Log Soil Mn | 71 | 6.23 (0.60) | 4.54 – 7.71 | 6.31 |
| Log Modeled Annual Mn | 88 | 3.20 (0.78) | 1.75 – 5.07 | 2.96 |
| Log Time Spent Outside | 88 | 3.16 (0.37) | 2.17 – 4.01 | 3.17 |
BSMSS is the Barratt Simplified Measure of Social Status
HVAC Score represents a measure of the heating, ventilation, air conditioning and air filtration in the home. Higher values are associated with more household air filtration.
Median soil and dust Mn levels were 552 mg/kg and 59 μg/m2 respectively. The highest level of soil Mn was reported as 2229 mg/kg and the lowest level as 94 mg/kg. Dust Mn concentrations ranged from 8 μg/m2 to 746 μg/m2. Dust samples were collected in 62 homes, with 3 wipe samples in 61 homes and 2 wipe samples in 1 home. The majority of the dust samples were collected from entryways, kitchens and living rooms (98%) and from vinyl or bare wood surfaces (77%). Despite instructions to collect samples from bare surfaces, at least one dust wipe sample was collected from carpet in 43 residences (74%). For dust samples, the mean percent difference for lab duplicates was 5% (n=3) with the highest percent difference reported as 15% and for field duplicates the mean percent difference was 32% (n=10) with the highest value reported as 127%. Mean percent difference for laboratory duplicates for soil was 10% (n=25) with a maximum value of 38%. Field duplicates for soil had a mean percent difference of 27% (n=7) with a high percent difference of 101%. Parent education on average was at least one year of college and ranged from partial high school to graduate degree (Rugless et al., 2014). The average HVAC score of 5 indicated that homes typically had a moderate level of air filtration or conditioning.
3.2. Correlations
Two children had missing Mn values for hair, dust and soil; nine had missing hair Mn data; fifteen had no reported data for dust Mn and soil Mn. The initial SEM analysis was limited to the 62 participants with complete data. Natural log (ln) transformations were performed for soil Mn, dust Mn, hair Mn, time spent outside, and annual ambient Mn to achieve normality. The square root of the parent education score was used in the analysis for scaling purposes.
Pearson Correlations were calculated for all pairwise comparisons based on transformed data (Table 2). Hair Mn and dust Mn were significantly correlated (r=0.39, p=0.002). Significant correlations were also detected between levels of Mn in dust and soil Mn, annual ambient Mn, and time spent outside (Table 2). Modeled annual ambient Mn concentrations and TWD were negatively correlated (r = −0.64, p<0.0001). Annual ambient Mn concentrations were also positively correlated with HVAC Score (r = 0.31, p = 0.02). No significant correlations were detected between TWD and hair Mn, dust Mn or soil Mn.
Table 2:
Pearson Correlations of Analysis Variables for Communities Actively Researching Exposure Study (CARES) Participants with Complete Data (n=62)
| Variable | Log Hair Mn | Log Household Dust Mn | Log Soil Mn | Log Modeled Annual Mn | Time Weighted Distance | Log Time Spent Outside | HVAC Score | Parent Education |
|---|---|---|---|---|---|---|---|---|
| Log Hair Mn | 1.00 | |||||||
| Log Household Dust Mn | 0.39* | 1.00 | ||||||
| Log Soil Mn | 0.22 | 0.27* | 1.00 | |||||
| Log Modeled Annual Mn | 0.01 | 0.29* | 0.06 | 1.00 | ||||
| Time Weighted Distance | 0.17 | −0.13 | −0.15 | −0.64* | 1.00 | |||
| Log Time Spent Outside | 0.18 | 0.29* | 0.06 | 0.14 | −0.04 | 1.00 | ||
| HVAC Score | −0.17 | 0.02 | 0.01 | 0.31* | −0.09 | 0.04 | 1.00 | |
| Parent Education | −0.14 | −0.10 | 0.05 | 0.25 | −0.04 | −0.02 | −0.06 | 1.00 |
indicates significant correlations at p < 0.05
3.3. Initial SEM Model
The initial SEM model (Figure 1) was analyzed using Proc CALIS (Hatcher, 2006). Evaluation of fit of this theoretical model was mixed. The chi-square goodness of fit accepted the null hypothesis that the specified model structure fit the data (χ2= 8.3489, df = 6 and p = 0.2136). The CFI was 0.9034 also indicating an acceptable fit of the model. Yet the NFI and the NNFI were both less than 0.9 (NFI = 0.8157; NNFI = 0.6618) indicating a less than desirable fit of the model.
As seen in Table 3, the pathways for dust Mn to hair Mn (p < 0.01), ambient Mn to dust Mn and soil Mn to dust Mn were significant pathways (p < 0.05). The R2 values for all endogenous variables were low (< .2) with the R2 for hair Mn displaying the largest value (R = 0.1792) (data not shown). Given the preliminary nature of the model due to small sample size, no paths were eliminated from the model.
Table 3:
Pathway Coefficients (t-values) for the Original and Modified SEM Model for Communities Actively Researching Exposure Study (CARES) participants (n=62)
| Pathway | Original Model | Modified Model |
|---|---|---|
| Household Dust to Hair Mn | 3.076** | 3.146** |
| Time Spent Outside to Hair MN | 0.673 | 0.653 |
| HVAC Score to Hair Mn | −1.459 | −1.476 |
| Parent Education to Hair Mn | −0.874 | −0.878 |
| Annual Mn to Hair Mn | −0.209 | −0.21 |
| HVAC Score to Household Dust Mn | −0.625 | −0.631 |
| Annual Mn to Household Dust Mn | 2.375* | 2.205* |
| Soil Mn to Household Dust Mn | 2.120* | 2.136* |
| Time Spent Outside to Household Dust Mn | n/a | 2.143* |
| Annual Mn to Soil Mn | 0.432 | 0.433 |
Significant at p<0.01
Significant at p<0.05
Evaluation of the standardized residuals revealed four residuals greater than two, all were related to hair Mn, dust Mn and time spent outside. In addition, a Lagrange multiplier test signified that addition of a path for time spent outside and dust Mn may improve the model. A path from time outside to the level of Mn in household dust is plausible given that Mn may be transferred inside through soil on clothes and shoes and/or Mn deposited on clothing from the air. Therefore, the model was modified to include a pathway from time outside to dust Mn (Figure 2).
Figure 2: Structural Equation Model for Children’s Inhalation Exposure to Mn.

SEM Diagram with Standardized Path Coefficient estimates from the modified SEM model; Significant Coefficients in bold
Endogenous variables represented by ovals; Exogenous variables represented by rectangles Dust Mn = Household Dust Mn
3.4. Modified SEM model
The modified model was also analyzed using the CALIS procedure in SAS 9.4. Fit statistics for the modified model were consistent and signified an improved fit of the model: χ2 = 4.1389, df = 5, and p = 0.5296; CFI = 1.0; NFI = 0.9086; and NNFI = 1.1488. Review of the path coefficients for the modified model indicated the following significant pathways: dust Mn to hair Mn, ambient Mn to dust Mn, time spent outside to dust Mn and soil Mn to dust Mn. Standardized path coefficients and significant pathways were included in the figure for the modified model (Figure 2). Comparison of the relative size of standardized path coefficients provided an indication of which paths had the largest impact on the endogenous variables. Examination of the coefficients for the modified SEM model indicated that the path from dust Mn to hair Mn had the largest effect (0.3696). Soil Mn, time the child spends outside and the annual ambient Mn concentrations had similar magnitudes of effect on levels of Mn in household dust (0.2389, 0.2418 and 0.2612, respectively). Examination of the standardized residuals showed that all residuals were less than two. Within the boundaries of the variables available for the model, the Lagrange multiplier test did not indicate potential improvement of the model with addition of new paths. R-squared values for the endogenous variables were still low with the values for hair Mn and dust Mn slightly improved (R2 = 0.1909 and R2 = 0.2014).
Since missing data for hair Mn, dust Mn and soil Mn, all endogenous variables, limited the dataset for the SEM analysis, an additional SEM was run imputing missing values using a maximum likelihood approach assuming values are missing completely at random. The modified model (Figure 2) was run with Mplus Software Version 4.2 with the full dataset (n=88). SEM model results for the full dataset with imputed values basically mirrored the results for the reduced dataset (n=62). However, the level of significance for the path from time spent outside to dust Mn dropped to 0.10 and the standardized path coefficient to 0.199.
4. Discussion
4.1. Child exposures to Mn via household dust
This is the first study to use SEM in evaluating an inhalation pathway model for children’s exposure to Mn (Figure 1). Results of the model assessment indicated that the level of Mn in household dust was a significant contributor to the level of Mn in children’s hair. One other study has evaluated levels of Mn in hair and household dust (Lucas et. al., 2015). Similar to the current study, Lucas et. al included samples of household dust to assess potential household contamination from ferromanganese alloy plant emissions. The authors did report a significant positive correlation between levels of Mn in children’s hair and levels of Mn in household dust (rs=0.28; n=199). In the current study the correlation between hair Mn levels and household dust Mn levels was slightly higher, albeit with a smaller sample size (r=0.39; n=62). The dust exposure pathway can be manifested in other biomarkers such as blood. In a South African study, children’s Mn blood levels and Mn levels in dust and soil were evaluated in a city with Mn emission sources and an unexposed city (Rollin et al., 2005). Dust samples were collected from school classrooms and soil samples from school playgrounds. Levels of Mn in dust and soil were significantly higher in the exposed versus unexposed city (p<0.01). Adjusted blood Mn concentrations among exposed children were 3.44 units higher than the unexposed. The relationship between Mn in blood and Mn in dust and soil approached statistical significance (p=0.10) (Rollin et al., 2005). Obtaining soil and dust samples from residences, in addition to the school samples, may have improved the association with levels of Mn in blood. While the median soil Mn level for the exposed South Africans (436 mg/kg) was similar to the median level in Marietta (552 mg/kg), the soil Mn levels in Marietta covered a broader range (94 – 2229 mg/kg versus 117 – 904 ng/kg). Dust Mn levels reported by Rollin et al. as μg/g and are not comparable to the current study where dust levels are reported as μg/m2.
4.2. Dust as an exposure factor
Dust and soil have been identified by the USEPA as important exposure factors for children (US EPA, 2008). Children may be exposed to contaminants in dust through ingestion, inhalation or dermal absorption. Studies have demonstrated that household dust near industrial sources of toxic metals can be contaminated and contribute to the overall exposure scenario for children (Layton and Beamer, 2009; Lioy et al., 2002; Lucas et al., 2015; Zota et al., 2011). A recent study investigated indoor metallic pollution in the mining city of Oruro, Bolivia by collecting household dust samples and hair samples from children between 7 and 10 years of age (Barbieri et. al., 2014). Both dust and hair were analyzed for a number of metals, including arsenic, lead, zinc and copper; manganese was not included. The study detected significant correlations between metals in household dust and metals in children’s hair, with the strongest correlation reported for lead (rs=0.535; n=97). In studies of childhood lead exposure, soil and household dust have been identified as significant contributing factors (Bornschein et al., 1985; Lamphear et al., 1996; Lapmhear & Roghmann, 1997; Lucas et al., 2015; Sayre et al., 1974; Succop et al., 1998). In a recent study looking at children’s soil and dust ingestion rates and blood lead levels, the analysis indicated that younger children (6 – 23 months) had higher intake rates from household dust than older children (von Lindern et al., 2015). Although these studies focused on deposition of soil or dust on hands and children’s hand-to-mouth activity, (i.e., ingestion), they verify that household dust and residential soil are significant factors in understanding children’s environmental exposures.
4.3. Mn soil to Mn household dust
In the current study the SEM model identified a significant pathway from soil Mn to household dust Mn. This finding is supported by an exposure assessment of children living near a Superfund site that collected outdoor soil, indoor dust and particulate matter air samples from residences (Zota et al., 2011). Mn soil concentration and the number of people living in the residence were significantly associated with increased dust Mn levels. The authors suggested that occupant density is a “surrogate for indoor re-suspension activity” (Zota et al., 2011). The mean Mn dust loading was 90 μg/m2, ranging from 0.8 μg/m2 to 499 μg/m2. The mean level of dust Mn for the Marietta cohort was higher, 107 μg/m2 with a wider range of 8 to 746 μg/m2, which is consistent with the presence of an additional source of Mn through ambient air. Minimum and maximum soil levels for Mn were reported by Zota et al. as 112 mg/kg and 1587 mg/kg with a mean of 396 mg/kg and reflected levels found in soils in the region (Zota et al., 2011). These levels are on average lower than levels in residential soil in Marietta (597 mg/kg),
An additional study by Layton and Beamer used monitoring data collected from residences in the U.S. and The Netherlands to evaluate a conceptual framework to represent the movement of contaminated soil and airborne particles into a residence and the subsequent incorporation and redistribution in household dust. Data from homes in the U.S. Midwest for arsenic (As) indicated that 60% of the input to floor dust came from ambient air with the remainder accounted for by soil track-in. For homes in Sacramento, CA historical data on lead (Pb) in indoor dust showed ambient air Pb levels as the dominant source for Pb in floor dust in 1982. However, in 1992 after the phase-out of leaded gasoline, soil resuspension and track-in became the dominant source for Pb in floor dust. Findings from these studies highlight the importance of understanding the transport pathways and the relative source contributions to dust levels to further the development of mitigation strategies at the household level. Results from Layton and Beamer, as well as Lucas et. al. and Zota et al., support the finding in the current study of a significant pathway from soil Mn to household dust Mn. The conclusion of Zota et al. that occupant density may influence the level of Mn in dust through re-suspension of particles provides another factor that could be included in future inhalation pathway models.
The current study did not explore a direct pathway from soil to hair, however there is some supporting evidence to link soil and hair from another study in Mn-exposed Northern Italy that focused on the assessment of Mn exposure utilizing soil Mn. Children ages 11 to 14 years were recruited from communities that were impacted by ferroalloy manufacturing and a reference community with no history of ferromanganese activity (Lucchini et al., 2012). Personal air samples were collected for a 24 hour period, soil levels of Mn were obtained from residences and samples of hair, blood and urine were obtained. Soil Mn and personal air Mn were significantly different between exposed and reference populations (p<0.01 and p<0.05). No significant differences were detected for levels of Mn in hair, blood or urine. Soil Mn was significantly associated with impairment of neurological function. Reported median level of Mn in soil for the exposed population was 897mg/kg and for the reference population was 408 mg/kg, bracketing the median level for the current study. Median hair Mn concentrations measured in mg/kg were 0.11 and 0.12 for the exposed and reference populations respectively, much lower than median hair Mn levels for CARES participants (0.44 mg/kg). The significant difference between soil Mn levels in communities with and without ferroalloy manufacturing combined with the association between soil Mn and impairment of neurological function reinforces the concept that soil Mn levels play a role in Mn exposure in children.
4.4. Other pathways
The current study was unique as the modeled ambient air Mn concentration included time spent at home as well as school and demonstrated a significant pathway from ambient air Mn to levels of Mn in household dust. In the Northern Italy study of communities impacted by ferromanganese plants, the authors reported significant correlations between indoor dust Mn concentrations and soil and ambient air Mn concentrations (rs = 0.154 and 0.291 respectively, all P’s<0.01) (Lucas et al, 2015). Conclusions of the study by Layton and Beamer also support the contribution of ambient air to contaminant levels in household dust, with ambient air accounting for as much as 60% of levels of Arsenic in household dust for a sample of US homes (Layton and Beamer, 2009).
Time spent outside in the SEM model was associated with household dust Mn. This pathway may be explained by children playing outside and either tracking soil into the home or by Mn deposited on clothing. In either case the presence of Mn in ambient air could potentially contribute to this pathway through deposition. The role that outside activity may contribute to levels of Mn in household dust is examined from the view of agricultural workers in a study of Mn exposure in the agricultural Salinas Valley in California, the Center for Health Assessment of Mothers and Children of Salinas (CHAMACOS) study (Gunier et al., 2014). As part of this study a number of factors including agricultural workers in the home, housekeeping practices and the use of doormats were evaluated for their contribution to levels of Mn in household dust. Samples were collected from one square meter of floor space per residence and analyzed for Mn. Researchers found that higher Mn loadings in household dust were associated with a number of factors including farmworkers living in the home, the agricultural use of Mn fungicides within 3 km of the residence during the month prior to dust collection, location of residence relative to wind direction, type of soil, housekeeping practices and use of doormats in the home. Levels were less when doormats and effective housekeeping practices were used indicating that interventions such as storing shoes and clothes of agricultural workers outside the home, more frequent or effective cleaning and use of a door mat may help mitigate exposure.
The ambient air Mn to soil pathway was not detected which may be due to the fact that soil Mn levels would be the result of cumulative Mn deposition and the soil sample was limited to one half inch of surface soil. As historic emission levels from EMI were substantially higher (Carter et al., 2015), current ambient air Mn would not correlate as closely with surface soil Mn. Additional factors that could impact the amount of Mn available for resuspension include vegetation coverage and the amount the soil has been disturbed over time.
4.5. Ambient air Mn to hair Mn pathway
Although children residing in the Marietta community are potentially exposed to ambient air Mn via the industrial source of Mn air emissions, in the SEM model the pathway from ambient air Mn to children’s hair Mn was not significant. This may be a reflection of the impact of all exposure pathways on the biomarker Mn in hair. For example, studies using the location of the child’s residence as a surrogate for measured Mn exposure are limited in their ability to identify the relative contribution of each source (air, soil, dust) but may capture the totality of Mn exposure. In a 2009 Brazilian study of children aged 1 to 10 years living near a ferromanganese refinery, child’s area of residence was significantly associated with levels of Mn in hair (Menezes-Filho et al., 2009). A comparison of children living in rural communities to children living less than a kilometer from a Mn mineral processing plant in Mexico, indicated that levels of hair Mn were significantly higher for children living near the plant (Riojas-Rodriguez et al., 2010). A pilot study of adults and children in Marietta, OH evaluated hair Mn and modeled levels of the annual average of ambient air Mn at their residence and detected a significant association after adjustment for genotypes for absorption of iron (Haynes et al., 2010).
4.6. Limitations
This analysis utilized a small number of soil and dust samples. Typically, an adequate sample size to support SEM analysis is 5 observations for every parameter estimated or at least 200 participants (Hatcher, 2006). The small number of observations limited the ability to include additional variables and pathways in the model, such as sex of the child, number of household occupants and smoking status of occupants. Despite the small sample size, significant pathways were identified. Another limitation was the location of household dust sample collection. Dust samples were composite samples taken from floor surfaces using wipes in three areas of the home. Bare surfaces are preferred for collection of dust wipe samples; however, samples in 43 residences includes a sample collected from carpet in at least one room. Since the wipe methods may not adequately collect house dust on carpet, this may influence the composite dust Mn concentration for these homes. In addition, school exposure through dust and soil were not considered in this analysis; however, time spent at home was greater than time spent at school.
4.7. Conclusions
Children’s exposure to ambient air Mn can occur through multiple pathways. The overall goal of this study was to evaluate a theoretical inhalation exposure pathway for children’s exposure to Mn using a SEM approach. Results of this study, though preliminary in nature, indicate that significant pathways for children include direct exposure to Mn through inhalation of household dust, and indirect exposure to ambient air Mn through Mn deposited in house dust. The model indicates that this deposition may occur through tracking Mn contaminated soil into the home, direct infiltration of ambient air Mn into the home and through children playing outside and depositing Mn in the home from their shoes and clothing. Given the significant results of the SEM analysis with a limited dataset, further evaluation of the modified inhalation pathway model is warranted. Further study will assist the development of a mitigation framework to reduce Mn exposures for children living near ambient Mn sources.
Highlights.
An inhalation pathway model for children’s exposure to ambient Mn was hypothesized.
Levels of Mn in air, soil and dust and children’s hair were used to test the model.
Mn in air and soil and time outside significantly contributed to household dust Mn.
Household dust Mn was found to be a significant contributor to child hair Mn.
Acknowledgements
The authors acknowledge Pierce Kuhnell, Jody Alden, Sandy Roda, Bill Menrath, Mary Barnas, Rusty Roberts, Callie Lyons, Diana Hackenburg, Russellita Young, Ryan Ellis, Anthony Derotto, Maggie Alden, Derek Hennen, Corin Bonnett, Marlena Thomas, John St. Marie, Velvet Tranchina, and the CARES Advisory Board.
Funding: This work was supported by funding from National Institute of Environmental Health Sciences (1R01 ES016531-01; P30-ES006096) and an Institutional Clinical and Translational Science Award, NIH/NCRR 5UL1RR026314. This work was completed in partial fulfillment of the Doctor of Philosophy degree in Epidemiology in the Department of Environmental Health, Division of Epidemiology and Biostatistics, University of Cincinnati College of Medicine. The views expressed in this paper are those of the authors and do not necessarily reflect the views or policies of the U.S. Environmental Protection Agency or NIEHS.
Abbreviations
- Mn
Manganese
- SEM
Structural equation modeling
- CARES
Communities Actively Researching Exposure Study
- HVAC
heating, ventilation, and air conditioning
- TWD
time-weighted distance
Footnotes
The authors have no conflicts of interest to report
Publisher's Disclaimer: This is a PDF file of an unedited manuscript that has been accepted for publication. As a service to our customers we are providing this early version of the manuscript. The manuscript will undergo copyediting, typesetting, and review of the resulting proof before it is published in its final citable form. Please note that during the production process errors may be discovered which could affect the content, and all legal disclaimers that apply to the journal pertain.
References
- Agency for Toxic Substances and Disease Registry (ATSDR). Toxicological Profile for Manganese. 2012. Available at: http://www.atsdr.cdc.gov/toxprofiles/tp.asp?id=102&tid=23. Accessed 1/22/2016. [PubMed]
- Barbieri E, Fontúrbel F, Herbas C, Barbieri F, and Gardon J Indoor metallic pollution and children exposure in a mining city. Science of the total Environment. 2014; 487:13–19. [DOI] [PubMed] [Google Scholar]
- Barratt W The Barratt Simplified Measure of Social Status (BSMSS) Measuring SES. 2012. Available at: http://socialclassoncampus.blogspot.com/2012/06/barratt-simplified-measure-of-social.html. Accessed 1/22/2016.
- Bornschein RL, Succop P, Dietrich KN, Clark CS, Que Hee S, Hammond PB. The Influence of Social and Environmental Factors on Dust Lead, Hand Lead, and Blood Lead Levels in Young Children. Environmental Research.1985;38:108–118. [DOI] [PubMed] [Google Scholar]
- Bouchard M, Laforest F, Vandelac L, Bellinger D, Mergler D. Hair manganese and hyperactive behaviors: pilot study of school-age children exposed through tap water. Environmental Health Perspectives.2007;15(1):122–127. [DOI] [PMC free article] [PubMed] [Google Scholar]
- Bouchard M, Mergler D, Baldwin ME, Panisset M. Manganese cumulative exposure and symptoms: a follow-up study of alloy workers. Neurotoxicology. 2008;29(4):577–583. [DOI] [PubMed] [Google Scholar]
- Bouchard MF, Sauve S, Barbeau B, Legrand M, Brodeur ME, Bouffard T et al. Intellectual Impairment in School-Age Children Exposed to Manganese from Drinking Water. Environmental Health Perspectives.2011;119(1):138–143. [DOI] [PMC free article] [PubMed] [Google Scholar]
- Bowler RM, Gysens S, Diamond E, Nakagawa S, Drezgic M, Roels HA. Manganese exposure: neuropsychological and neurological symptoms and effects in welders. Neurotoxicology. 2006;27(3):315–326. [DOI] [PubMed] [Google Scholar]
- Buncher R, Succop P, Dietrich K. Structural Equation Modeling in Environmental Risk Assessment. Environmental Health Perspectives.1991;90:209–213. [DOI] [PMC free article] [PubMed] [Google Scholar]
- Carter M, Gaudet B, Stauffer D, White T, Brantley S. Using Soil Records with Atmospheric Dispersion Modeling to Investigate the Effects of Clean Air Regulations on 60 Years of Manganese Deposition in Marietta, Ohio (USA). Science of the Total Environment 2015; 515–516:49–59. [DOI] [PubMed] [Google Scholar]
- Carvalho C, Menezes-Filho J, de Matos V, Bessa J, Coelho-Santos J, Viana G et al. Elevated airborne manganese and low executive function in school-aged children in Brazil. NeuroToxicology.2014;45:301–308. [DOI] [PubMed] [Google Scholar]
- Eastman R, Jursa T, Benedetti C, Lucchini R, Smith D. Hair as a Biomarker of Environmental Manganese Exposure. Environmental Science and Technology. 2013;47(3): 1629–1637. [DOI] [PMC free article] [PubMed] [Google Scholar]
- Fulk F, Haynes E, Hilbert T, Brown D, Petersen D, Reponen T. Comparison of Stationary and Personal Air Sampling with an Air Dispersion Model for Children’s Ambient Exposure to Manganese. Journal of Exposure Science and Environmental Epidemiology. 2016:1–9. [DOI] [PMC free article] [PubMed] [Google Scholar]
- Hatcher L A Step-by-Step Approach to Using SAS for Factor Analysis and Structural Equation Modeling. SAS Institute Inc., Cary, NC, USA: 2006. [Google Scholar]
- Gunier R, Jerrett M, Smith D, Jursa T, Yousefi P, Camacho J et al. Determinants of manganese levels in house dust samples from the CHAMACOS cohort. Science of the Total Environment. 2014:497–498: 360–368. [DOI] [PMC free article] [PubMed] [Google Scholar]
- Haynes E, Heckel P, Ryan P, Roda S, Leung Y, Sebastian K et al. Environmental manganese exposure in residents living near a ferromanganese refinery in Southeast Ohio: A pilot study. NeuroToxicology. 2010;31(5):468–474. [DOI] [PMC free article] [PubMed] [Google Scholar]
- Haynes E, Beidler C, Wittberg R, Meloncon L, Parin M, Kopras E et al. Developing a Bidirectonal Academic-Community Partnership with an Appalachian-American Community for Environmental Health Research and Risk Communication. Environmental Health Perspectives.2011;119(10):1364–1372. [DOI] [PMC free article] [PubMed] [Google Scholar]
- Haynes E, Heckel P, Ryan P, Chen A, Brown D, Roda S et al. Assessment of personal exposure to manganese in children living near a ferromanganese refinery. Science of the Total Environment.2012; 427–428:19–25. [DOI] [PMC free article] [PubMed] [Google Scholar]
- HUD. Guidelines for Evaluation of Lead-Based Paint Hazards in Housing. HUD-1539-LBP. Washington, DC. U.S. Department of Housing and Urban Development, 1995. [Google Scholar]
- Lamphear B, Weitzman M, Winter N, Eberly S, Yakir B, Tanner M et al. Lead-Contaminated House Dust and Urban Children’s Blood Lead Levels. American Journal of Public Health.1996; 86(10):1416–1421. [DOI] [PMC free article] [PubMed] [Google Scholar]
- Lamphear B and Roghmann K Pathways of Lead Exposure in Urban Children. Environmental Research.1997; 74:67–73. [DOI] [PubMed] [Google Scholar]
- Layton D and Beamer P. Migration of Contaminated Soil and Airborne Particulates to Indoor Dust. Environmental Science and Technology. 2002:110(10)969–983. [DOI] [PMC free article] [PubMed] [Google Scholar]
- Lioy P, Freeman N and Millette J. Dust: A Metric for Use in Residential and Building Exposure Assessment and Source Characterization. Environmental Health Perspectives. 2002:110(10):969–983. [DOI] [PMC free article] [PubMed] [Google Scholar]
- Lucas E, Bertrand P, Guazzetti S, Donna F, Peli M, Jursa T et al. Impact of ferromanganese alloy plants on household dust manganese levels: Implications for childhood exposure. Environmental Research. 2015; 138:279–290. [DOI] [PMC free article] [PubMed] [Google Scholar]
- Lucchini R, Bergamaschi E, Smargiassi A, Festa D, Apostoli P. Motor function, olfactory threshold, and hematological indices in manganese-exposed ferroalloy workers. Environmental Research 1997;73(1–2):175–180. [DOI] [PubMed] [Google Scholar]
- Lucchini R, Guazzetti S, Zoni S, Donna F, Peter S, Zacco A et al. Tremor, olfactory and motor changes in Italian adolescents exposed to historical ferro-manganese emission. NeuroToxicology.2012; 33: 687–696. [DOI] [PMC free article] [PubMed] [Google Scholar]
- Maantay J, Tu J. Maroko A. Loose-coupling an air dispersion model and a geographic information system (GIS) for studying air pollution and asthma in the Bronx, New York City. International Journal of Environmental Health Research. 2009; 19(1):59–79. [DOI] [PubMed] [Google Scholar]
- Menezes-Filho J, Bouchard M, Sarcinelli P, Moreira J. Manganese exposure and the neuropsychological effect on children and adolescents: a review. Pan American Journal of Public Health. 2009; 26(6):541–548. [DOI] [PubMed] [Google Scholar]
- Muthen and Muthen. 2006. Mplus Version 4.2. Available at: www.statmodel.com. Accessed 1/22/2016.
- Riojas-Rodriguez H, Solis-Vivanco R, Schilmann A, Montes S, Rodriguez S, Rios C et al. Intellectual Function in Mexican Children Living in a Mining Area and Environmentally Exposed to Manganese. Environmental Health Perspectives.2010;118(10):1465–1470. [DOI] [PMC free article] [PubMed] [Google Scholar]
- Rodriguez-Barranco M, Lacasana M, Aguilar-Garduno C, Alguacil J, Gil F, Gonzalez-Alzaga B et al. Association of arsenic, cadmium and manganese exposure with neurodevelopment and behavioral disorders in children: A systematic review and meta-analysis. Science of the Total Environment.2013;454–455:562–577. [DOI] [PubMed] [Google Scholar]
- Rollin H, Mathee A, Levin J, Theodorou P, Wewers F. Blood manganese concentrations among first-grade schoolchildren in two South African cities. Environmental Research. 2005;97:93–99. [DOI] [PubMed] [Google Scholar]
- Rugless F, Bhattacharya A, Succop P, Dietrich K, Cox C, Alden J et al. Childhood exposure to manganese and postural instability in children living near a ferromanganese refinery in Southeastern Ohio. Neurotoxicology and Teratology. 2014;41:71–79. [DOI] [PMC free article] [PubMed] [Google Scholar]
- SAS Institute Inc. SAS(R) 9.4. Cary, NC, USA: 2013. Available at: http://support.sas.com/software/94/index.html. Accessed 1/22/2016. [Google Scholar]
- Sayre J, Charney E, Vostal J, Pless I. House and Hand Dust As a Potential Source of Childhood Lead Exposure. American Journal of Diseases of Children.1974;127:167–170. [DOI] [PubMed] [Google Scholar]
- Succop P, Bornschein R, Brown K, Tseng C. An Empirical Comparison of Lead Exposure Pathway Models. Environmental Health Perspectives. 1998; 106(6):1577–1583. [DOI] [PMC free article] [PubMed] [Google Scholar]
- US Census Bureau. 2011. Available at: www.census.gov. Accessed 1/22/2016.
- U.S. Department of Housing and Urban Development (HUD): Guidelines for the Evaluation and Control of Lead-Based Paint Hazards in Housing. Washington, D.C.: HUD, Office of Lead-Based Paint Abatement and Poisoning Prevention, 1995. [Google Scholar]
- US Environmental Protection Agency. Integrated Risk Information System (IRIS) on Manganese. National Center for Environmental Assessment, Office of Research and Development, Washington, DC: 1999. [Google Scholar]
- US Environmental Protection Agency. National-Scale Air Toxics Assessment for 2002. Available at: http://www.epa.gov/nata. Accessed 1/22/2016.
- US Environmental Protection Agency. User’s Guide for the AMS/EPA Regulatory Model AERMOD. EPA-454/B-03–001.2004.
- US Environmental Protection Agency. Method 3050B, Acid Digestion of Sediments, Sludges, and Soils. Revision 2. 2006. Available at: http://www3.epa.gov/epawaste/hazard/testmethods/sw846/pdfs/3050b.pdf. Accessed 01/05/2016.
- US Environmental Protection Agency. Child-Specific Exposure Factors Handbook (Final Report). US Environmental Protection Agency, Washington, D.C.,EPA/600/R-06/096F. 2008. [Google Scholar]
- US Environmental Protection Agency. 2010. Assessing Outdoor Air Near Schools. Available at: http://www3.epa.gov/air/sat/. Accessed 1/22/2016.
- Von Lindern I, Spalinger S, Stifelman M, Stanek L and Bartrem C. Estimating Children’s Soil/Dust Ingestions Rates through Retrospective Analysis of Blood Lead Biomonitoring from the Bunker Hill Superfund Site in Idaho. Environmental Health Perspectives. 2015; DOI: 10.1289/ehp.1510144. [DOI] [PMC free article] [PubMed] [Google Scholar]
- World Health Organization. 2000. Air quality guidelines for Europe (2nd ed.). Copenhagen, Denmark: World Health Organization, Regional Office for Europe; http://www.euro.who.int/data/assets/pdf_file/0003/123078/AQG2ndEd_6_8Manganese.pdf. Accessed 1/22/2016. [Google Scholar]
- Wright RO, Amarasiriwardena C, Woolf AD, Jim R, Bellinger DC. 2006. Neuropsychological correlates of hair arsenic, manganese, and cadmium levels in school-age children residing near a hazardous waste site. Neurotoxicology 27:210–216. [DOI] [PubMed] [Google Scholar]
- Zota A, Schaider L, Ettinger A, Wright R, Shine J, Spengler J. Metal sources and exposures in the homes of young children living near a mining-impacted Superfund site. Journal of Exposure Science and Environmental Epidemiology. 2011;21(5): 495–505. [DOI] [PMC free article] [PubMed] [Google Scholar]
- Zou B, Zhan F, Wilson J, Zeng Y. Performance of AERMOD at different time scales. Simulation Modelling Practice and Theory.2010;18: 612–623. [Google Scholar]