Abstract
Available information on chest Computed Tomography (CT) findings of the 2019 novel coronavirus disease (COVID-19) is constantly evolving. Ground glass opacities and consolidation with bilateral and peripheral distribution were reported as the most common CT findings, but also less typical features could be identified. All radiologists should be aware of the imaging spectrum of the COVID-19 pneumonia and imaging changes in the course of the disease. Our aim is to display the chest CT findings at first assessment and follow-up through a pictorial essay, to help in the recognition of these features for an accurate diagnosis.
Electronic supplementary material
The online version of this article (10.1007/s11604-020-01010-7) contains supplementary material, which is available to authorized users.
Keywords: Pneumonia, Viral, Coronavirus, COVID-19, Severe acute respiratory syndrome coronavirus 2, Tomography, Spiral computed
Introduction
In December 2019, the outbreak of an epidemical pneumonia, of initially unidentified origin occurred in Wuhan, Hubei Province, China [1]. Its cause was identified in a new virus, the “2019 novel coronavirus (2019-nCoV)” or “severe acute respiratory syndrome (SARS)-CoV-2”, which was subsequently named coronavirus disease (COVID-19) [2].
On January 30, 2020, the World Health Organization (WHO) declared a global public health emergency; on March 11, 2020, the pandemic declaration was made [3]. As of May 5, 2020, a total of 3,435,894 confirmed cases and 239,604 deaths have been reported [4].
Due to the current absence of specific therapies and vaccines for this infection, the detection of the disease at an early stage, with the isolation of the infected subjects from the healthy population, is crucial.
The diagnosis of COVID-19 is based on viral nucleic acid test, through the reverse transcription-polymerase chain reaction (RT-PCR) on throat swab, however, the results of this test are not immediately available and some patients can show false-negative results at the onset of the symptoms [5].
Chest X-Rays showed little diagnostic value in early stages [6], whereas chest Computed Tomography (CT) showed a high sensitivity for the diagnosis of COVID-19, particularly important in COVID-19 patients with false-negative RT-PCR result, assuming a role for the CT as a primary tool for COVID-19 diagnosis in the epidemic areas [5, 7–9]. The 6th version of the diagnosis and treatment program published by the National Health Commission of the People’s Republic of China [10], confirmed the pivotal role of Chest CT, including the radiological confirmation of viral pneumonia in the diagnostic criteria for COVID-19, and suggesting CT examination in monitoring disease progression and assessing treatments effectiveness.
Bilateral evidence of ground-glass opacities (GGO) with or without consolidation with posterior and peripheral distribution represents the most characteristic appearance of COVID-19 pneumonia [11, 12]. However, different imaging findings have also been described, including crazy paving pattern, linear opacities, reversed halo sign, etc. [13, 14], and the need to raise awareness for this disease among the imaging community, analyzing the spectrum of the disease has already been stated [15].
Due to the essential role of chest CT, radiologists should be familiar with the imaging features of this infection.
Our aim is to propose a review of the CT imaging findings described in COVID-19 pneumonia, and their modifications in different stages of the disease, based on relevant articles found in the literature.
The search was conducted by 2 radiologists and 2 radiology residents on PubMed (including Medline), Sciencedirect and Google Scholar databases, using the key-words as follows: “nCoV,” “2019-nCoV,” SARS-CoV-2”, “COVID-19” in all possible combinations with the key-words, “computed tomography”, “CT”. The WHO database on COVID-19 and the reference list of the included articles were also checked for potentially relevant papers, not including in the previous search [16].
We considered as eligibility criteria: articles published in 2020, articles written in English, articles regarding adult patients with RT-PCR confirmed diagnosis of COVID-19 infection, studies including ≥ 2 patients, articles focused on chest CT features of the infection. Two radiologists independently checked the titles and abstracts of the articles found according to the eligibility criteria. An agreement was reached by consensus.
For each article, the following data were collected, when available: patient demographics, lobar involvement, distribution pattern, chest CT findings, evolution of chest CT findings. The collected data have been summarized in Tables in Supplementary Materials.
CT findings first assessment
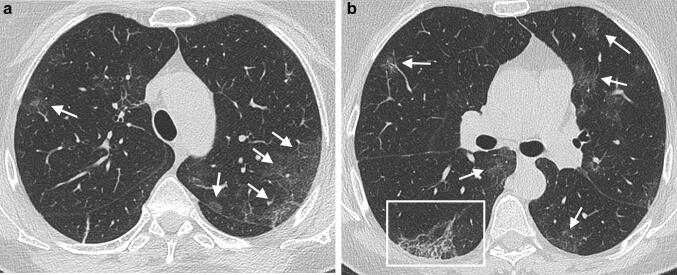
A wide variety of findings have been reported in different studies (Supplementary Material 1). GGO are the most observed abnormalities (Fig. 1a, b), typically with a peripheral and subpleural distribution, followed by consolidations (Fig. 2) and mixed patterns characterized by consolidation and GGO (Fig. 3).
Fig. 1.
a, b A 75-year-old COVID-19 positive woman presenting fever and dry cough for 8 days. Unenhanced CT scan shows multiple bilateral areas of GGO (arrows). A reticular pattern is visible in the lower right lobe (frame in b)
Fig. 2.
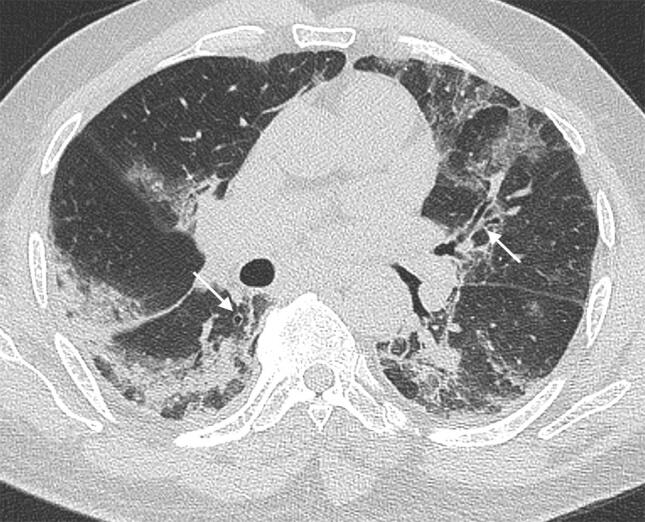
A 78-year-old COVID-19 positivewoman presenting fever and dry cough for 10 days, and dyspnea in the last 3 days. CT scan shows bilateral areas of GGO and consolidation with linear opacities and bronchial wall thickening (arrows)
Fig. 3.
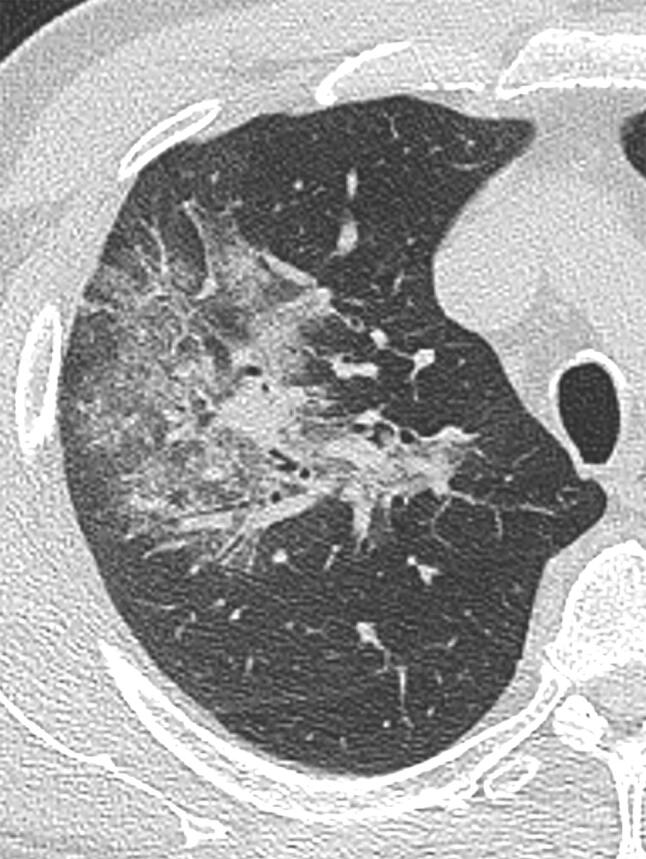
A 61-year-old COVID-19 positive man presenting with cough and fever up to 39° for 4 days. CT scan shows a mixed pattern of consolidation and GGO in the upper right lobe
GGO were reported in up to 97.6% of cases [26], and were frequently associated with other imaging manifestations, such as consolidations and interlobular septal thickening [31].
Consolidations were described as patchy, multifocal, or segmental [25, 26]; they were also considered as a possible indicator of disease progression [31].
Crazy paving pattern (Fig. 4), which consists of GGO with reticular interlobular septal thickening, and reticular opacities were reported in highly variable rates, up to 70% [5] and up to 81% [21], respectively; interlobular septal thickening was described in up to 70% of cases [5]. Some studies reported the presence of nodules with [5, 18–20] and without the halo sign (Fig. 5) [5, 7, 14, 18, 19, 21, 22, 25, 26, 29]. Fibrotic streaks (Fig. 6) and linear opacities were observed in some studies, with a rate of up to 33% [30] and to 33.9% [17], respectively. The reverse halo sign was rarely found [5, 14, 19].
Fig. 4.
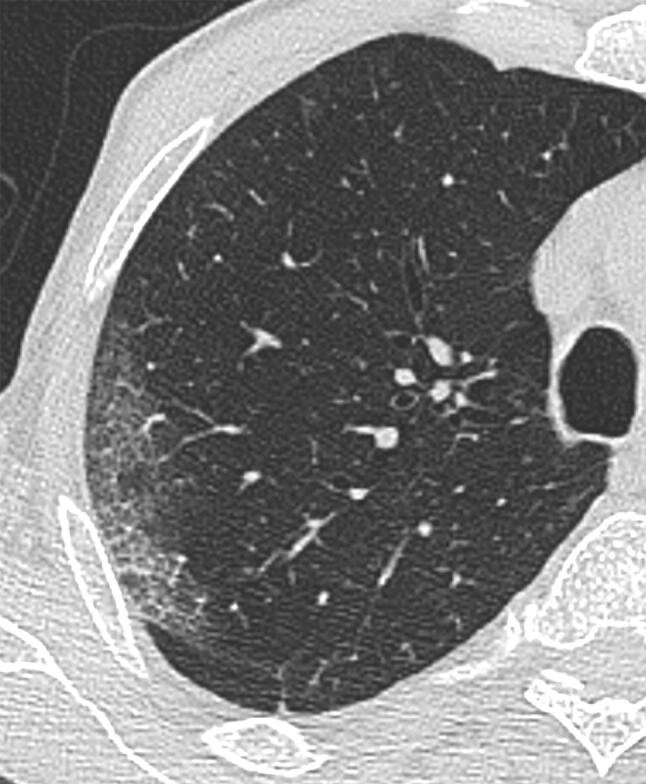
A 63-year-old COVID-19 positive woman presenting chest pain, fever, and dry cough for 3 days. CT scan shows a “crazy paving pattern” peripherally located in the upper right lobe
Fig. 5.
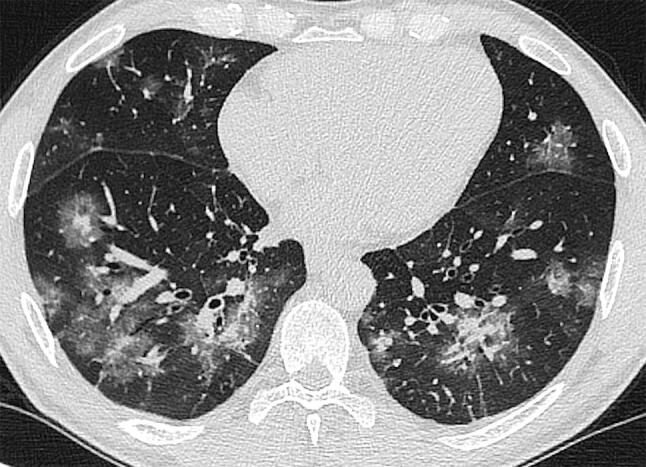
A 50-year old COVID-19 positive man presenting with cough and fever for 6 days. Bilateral presence of halo signs in the lower lobes, mainly with peri-bronchovascular distribution, with central dense components surrounded by GGO. In the middle and superior left lobes patchy GGO are recognizable
Fig. 6.
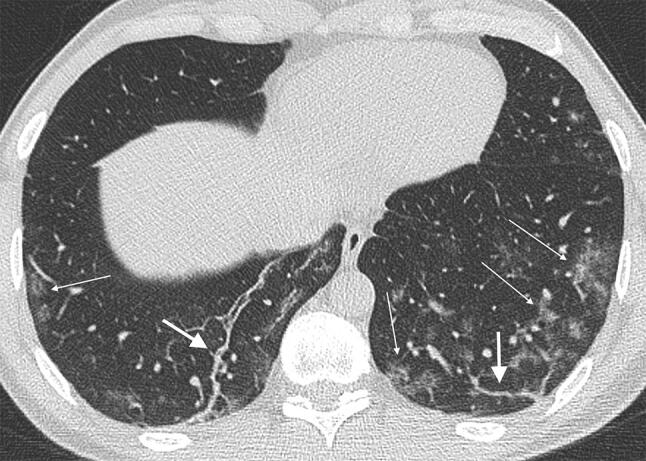
A 38-year-old COVID-19 positive man with cough and fever up to 38° for 3 days. CT scan shows bilateral presence of fibrous streaks (arrows) in the lower lobes. Patchy GGO, more represented in the subpleural site, are bilaterally recognizable (thin arrows)
Air-bronchogram sign was detected in up to 72.7% of cases [21] (Fig. 7, 8). Pleural thickening [17, 19, 24, 25, 34, 36] and effusion [5, 14, 17, 19, 23, 26, 31, 34–38, 41–44] were reported in few patients.
Fig. 7.
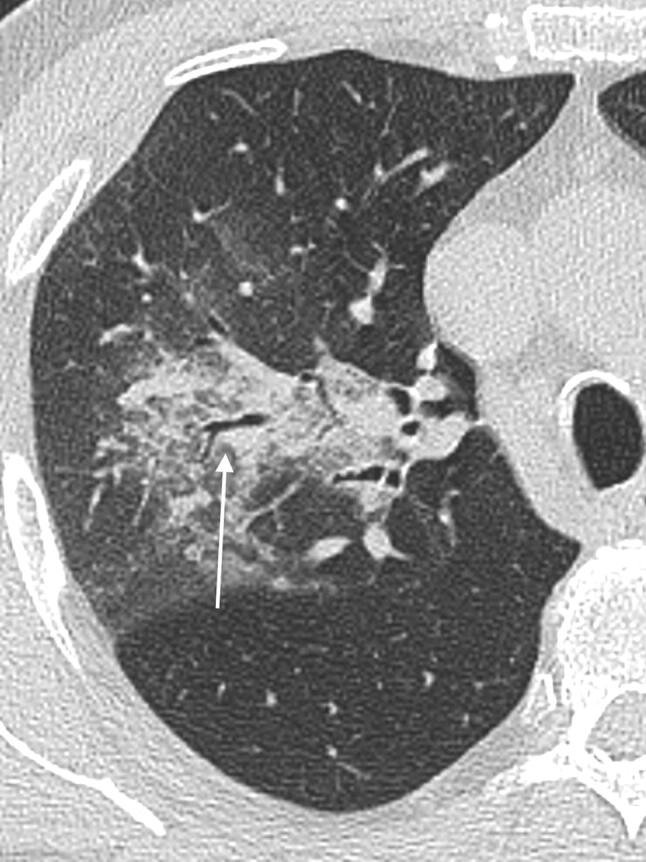
A 61-year-old COVID-19 positive man presenting with cough and fever. CT scan shows an extensive consolidation with central distribution, with evidence of air-bronchogram sign (arrow). Peripheral presence of GGO
Fig. 8.
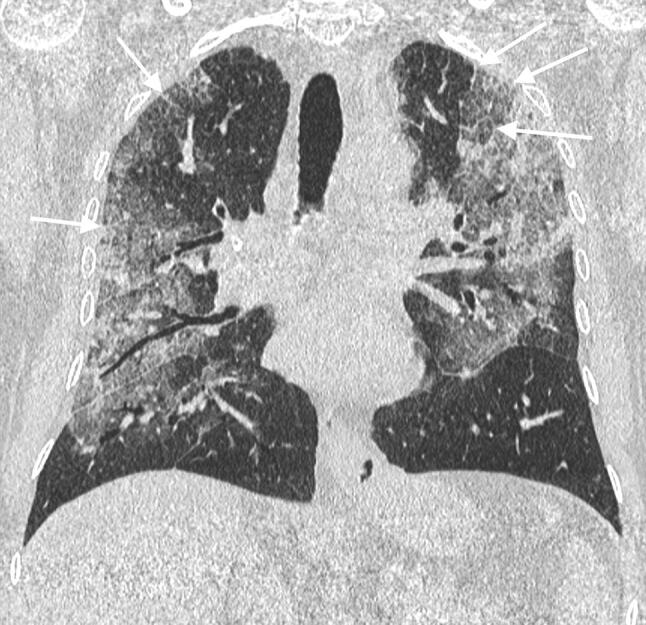
A 60-year-old COVID-19 positive man presenting with cough and fever up to 39°. Coronal reconstruction of his chest CT showing bilateral extensive areas of GGO and consolidations, with prevalent peripheral distribution. Air bronchogram signs are bilaterally recognizable. Interlobular septal thickening is bilaterally visible in the upper lobes in the subpleural areas (arrows)
Reticular pattern with thickened pulmonary interstitial structures located in the subpleural space has been observed in different studies [7, 12, 19, 21, 26, 31, 43, 45] (Fig. 9).
Fig. 9.
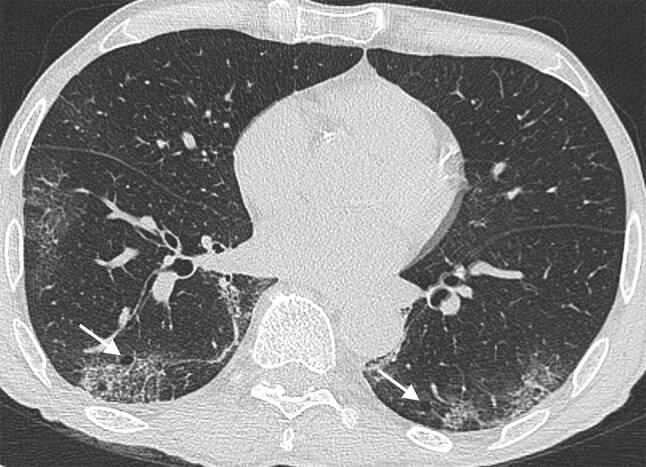
A 68-year-old man COVID-19 positive man presenting fever and dry cough for 7 days. CT scan shows multiple areas of panlobular GGO. In the posterior lower right lobe, an area of lung alteration with interlobular septal thickening resulting in a reticular pattern is present. Air bubble sign (arrows) is bilaterally recognizable. Air bubble sign consists of a small air-containing space, that can result from a dilatation of a physiological space or from lung cystic changes [24] or can be related to consolidation resorption
Two studies highlighted the evidence of triangular or GGO, located under the pleura, with internal interlobular septa thickened in a net-appearance has also been named “the spider-web” sign [23, 26].
Mediastinal lymphadenopathies (mediastinal lymph nodes with short-axis diameter > 1 cm) were detected in 0–8% of cases [5, 27] and were considered a significant risk factor for severe disease [26].
According to CT abnormalities distribution, most abnormalities are peripherally located.
The disease extent is widely variable, ranging from mild involvement, affecting less than 10% of the lung parenchyma to severe pneumonia with a “white lung” appearance on CT. The majority of studies observed an involvement of 5 pulmonary lobes in most of the patients [5, 12, 14, 20–22, 26, 31, 33, 34, 36–39, 42, 43, 45] (lobar involvement and lesion distribution in the different studies are listed in Supplementary Materials 2,3).
CT evolution during the course of COVID-19 pneumonia
COVID-19 pneumonia CT features change over time. Some studies described imaging modifications according to different timings (Supplementary Material 4). Wang et al. [46] described the CT findings according to 5 illness periods (0–5 days, 6–11 days, 12–17 days, 18–23 days, ≥ 24 days) and assigned a CT score dividing the lungs into six zones [47]. CT scores and the number of involved lung zones increased rapidly, with a peak on stage “days 6–11”. The most common finding was GGO, which increased in the late stages, whereas consolidation was the second most observed finding in the first 11 days. Distribution was mostly bilateral and peripheral (Fig. 10).
Fig. 10.
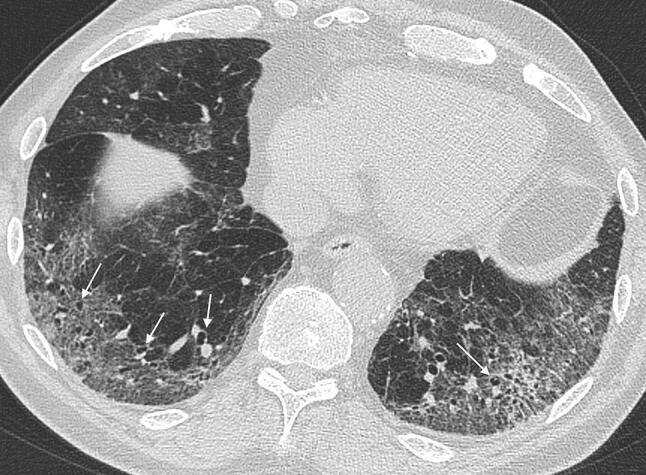
Chest CT of a 63-year old COVID-19 positive man executed at 36 days from the onset of symptoms. CT shows bilateral diffuse GGO with peripheral distribution and interlobular septal thickening. Presence of bilateral bronchiolectasis (arrows)
Jin et al. [48] divided the most frequent imaging findings according to a classification in 5 stages: ultra-early, early, consolidation, and the dissipation stage. GGO were characteristics of the first two phases, consolidations of phases three and four, whereas the last stage showed a progressive increase of thickening of the interlobular septa and bronchial walls.
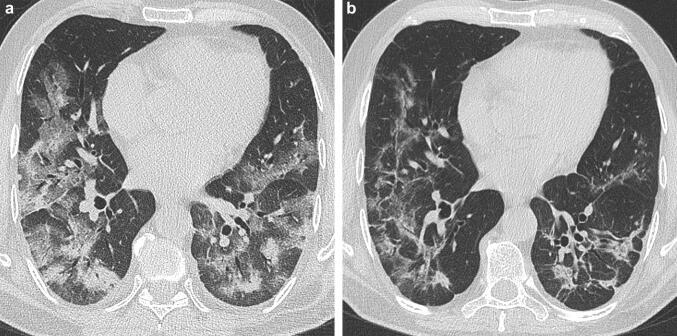
In another study, Pan et al. [49] classified CT findings according to 4 temporal stages. GGO was recognizable in all the disease stages; crazy paving in the first three stages; consolidation was the most common finding in stage 3. In the second stage, the pneumonia rapidly worsened, with diffuse bilateral multilobar distribution. After day 14, imaging improvement was observed in 75% of patients. They stated that GGO and consolidations, often with a bilateral and peripheral lung distribution, could be considered as the CT hallmark of COVID-19 pneumonia. The evidence of consolidations, extension of lung involvement, linear opacities, appearance of the “reverse halo” sign and “crazy-paving” pattern, increased in patients scanned after a long time after symptoms onset (Fig. 11a, b), representing the CT correlate for the underlying pathophysiology of the infective process as it organizes.
Fig. 11.
CT images of a 73-year-old COVID-19 positive man at 10 (a) and 23 days (b) from the onset of symptoms. Bilateral evidence of extensive areas of consolidation and crazy paving pattern (a); in b, CT scan shows marked improvement of imaging findings, with bilateral reduction of lung abnormalities, patchy consolidations, fibrotic stripes, and interlobular septal thickening
Signs of fibrosis have been identified in the late stage of the disease, after patients discharge from the hospital, with a higher rate in older patients [52] (Figs. 12, 13). Even if the data are inhomogeneous, we can deduce that the imaging appearance of COVID-19 pneumonia can change widely over time, with the occurrence of new lesions in previously unaffected lung areas, and with variation in density. The appearance of fibrotic stripes could be a characteristic of the late CT stage.
Fig. 12.
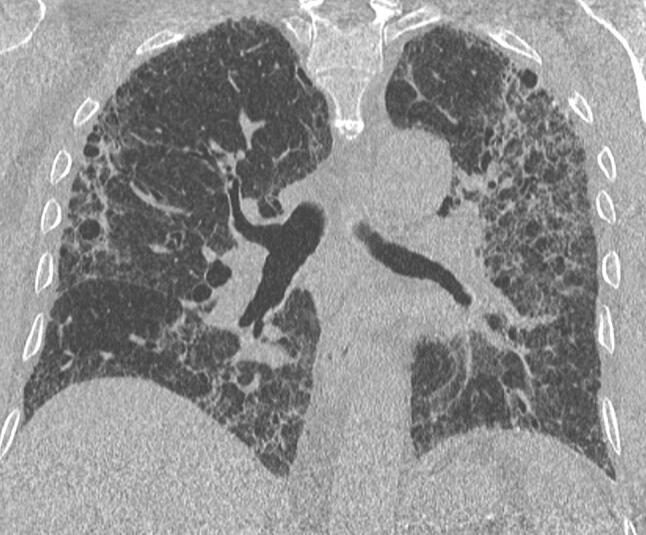
Coronal MPR image of chest CT executed by a 65-year-old man at 32 days from the onset of symptoms showing diffuse thickening of the interlobular septa, with fibrotic appearance, pleural irregularities, thickening of the bronchial wall
Fig. 13.
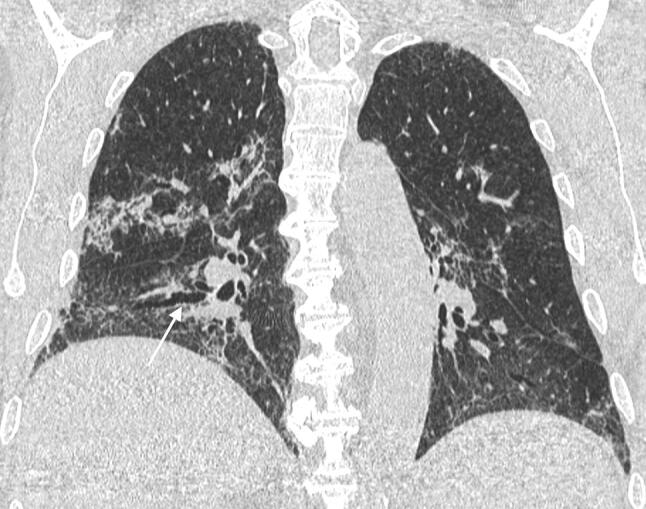
Coronal MPR image of chest CT executed in a 72-year-old man at 38 days from the onset of symptoms. CT shows reticular opacities and septal thickening in bilateral lower lobes. Note bronchial distortion in right lower lobe (arrow)
Repeated CT scans can help patient management by identifying disease progression and implementing proper treatment, but a precise timing still needs to be established.
Conclusions
In conclusion, imaging presentations of COVID-19 pneumonia are mostly GGO, bilaterally located in the peripheral lung areas under the pleura with an increase in consolidations number in the course of the disease, followed by reabsorption, and formation of fibrotic stripes. The lesion may have quick changes with new lesions may appear.
The accurate and early identification of COVID-19 pneumonia on chest CT plays an essential role, both in controlling this outbreak, especially in patients with false-negative RT-PCR results, but also in the management of patients affected by this disease. Currently, there are no scientifically proven therapies for the treatment of COVID-19, but some treatments are under investigation: we can guess that chest CT will become an important tool in the assessment of their effectiveness.
In this scenario, the radiologists are protagonists and should be aware of the typical and atypical CT manifestations of this infection, as well as of the modifications of images findings in the course of the disease.
Electronic supplementary material
Below is the link to the electronic supplementary material.
Compliance with ethcical standards
Conflict of interest
The authors declare that they have no conflict of interest.
Footnotes
Publisher's Note
Springer Nature remains neutral with regard to jurisdictional claims in published maps and institutional affiliations.
References
- 1.Huang C, Wang Y, Li X, Ren L, Zhao J, Hu Y, et al. Clinical features of patients infected with 2019 novel coronavirus in Wuhan. China Lancet. 2020;395(10223):497–506. doi: 10.1016/S0140-6736(20)30183-5. [DOI] [PMC free article] [PubMed] [Google Scholar]
- 2.World Health Organization website (2020). Naming the coronavirus disease (COVID-19) and the virus that causes it. https://www.who.int/emergencies/diseases/novel-coronavirus-2019/technical-guidance/naming-the-coronavirus-disease-(covid-2019)-and-the-virus-that-causes-it. Accessed 5 May 2020.
- 3.World Health Organization website. WHO Director-General's opening remarks at the media briefing on COVID-19. 2020. https://www.who.int/dg/speeches/detail/who-director-general-s-opening-remarks-at-the-media-briefing-on-covid-19. Accessed 11 Mar 2020.
- 4.World Health Organization website (2020). Coronavius Disease (COVID-19) Situation Report—105 https://www.who.int/docs/default-source/coronaviruse/situation-reports/20200504-covid-19-sitrep-105.pdf?sfvrsn=4cdda8af_2. Accessed 5 May 2020.
- 5.Li Y, Xia L. Coronavirus disease 2019 (COVID-19): role of chest CT in diagnosis and management. AJR Am J Roentgenol. 2020;4:1–7. doi: 10.2214/AJR.20.22954. [DOI] [PubMed] [Google Scholar]
- 6.Salehi S, Abedi A, Balakrishnan S, Gholamrezanezhad A. Coronavirus disease 2019 (COVID-19): a systematic review of imaging findings in 919 patients. AJR Am J Roentgenol. 2020;14:1–7. doi: 10.2214/AJR.20.23034. [DOI] [PubMed] [Google Scholar]
- 7.Ai T, Yang Z, Hou H, Zhan C, Chen C, Lv W, et al. Correlation of chest CT and RT-PCR testing in coronavirus disease 2019 (COVID-19) in China: a report of 1014 cases. Radiology. 2020;26:200642. doi: 10.1148/radiol.2020200642. [DOI] [PMC free article] [PubMed] [Google Scholar]
- 8.Huang P, Liu T, Huang L, et al. Use of chest CT in combination with negative RT-PCR assay for the 2019 novel coronavirus but high clinical suspicion. Radiology. 2020;295:22–23. doi: 10.1148/radiol.2020200330. [DOI] [PMC free article] [PubMed] [Google Scholar]
- 9.Xie X, Zhong Z, Zhao W, Zheng C, Wang F, Liu J. Chest CT forRadiology typical 2019-nCoV pneumonia: relationship to negative RT-PCR testing. Radiology. 2020 doi: 10.1148/radiol.2020200343. [DOI] [PMC free article] [PubMed] [Google Scholar]
- 10.National Health Commission of the People's Republic of China website. Diagnosis and treatment of novel coronavirus infection (trial version 6). https://www.nhc.gov.cn/yzygj/s7653p/202002/8334a8326dd94d329df351d7da8aefc2.shtml. Published 18 Feb 2020.
- 11.Wang D, Hu B, Hu C, et al. Clinical characteristics of 138 hospitalized patients with 2019 novel coronavirus–infected pneumonia in Wuhan, China. China JAMA. 2020 doi: 10.1001/jama.2020.1585. [DOI] [PMC free article] [PubMed] [Google Scholar]
- 12.Chung M, Bernheim A, Mei X, et al. CT imaging features of 2019 novel coronavirus (2019-nCoV) Radiology. 2020 doi: 10.1148/radiol.2020200230. [DOI] [PMC free article] [PubMed] [Google Scholar]
- 13.Qian L, Yu J, Shi H. Severe acute respiratory disease in a Huanan seafood market worker: images of an early casualty. Radiol Cardiothorac Imaging. 2020 doi: 10.1148/ryct.2020200033. [DOI] [PMC free article] [PubMed] [Google Scholar]
- 14.Bernheim A, Mei X, Huang M, et al. Chest CT findings in coronavirus disease-19 (COVID-19): relationship to duration of infection. Radiology. 2020 doi: 10.1148/radiol.2020200463. [DOI] [PMC free article] [PubMed] [Google Scholar]
- 15.Kay F, Abbara S. The many faces of COVID-19: spectrum of imaging manifestations. Radiol Cardiothorac Imaging. 2020 doi: 10.1148/ryct.2020200037. [DOI] [PMC free article] [PubMed] [Google Scholar]
- 16.World Health Organization website. WHO database of publications on coronavirus disease (COVID-2019). https://www.who.int/emergencies/diseases/novel-coronavirus-2019/global-research-on-novel-coronavirus-2019-ncov.
- 17.Zhou S, Wang Y, Zhu T, Xia L. CT features of coronavirus disease 2019 (COVID-19) pneumonia in 62 patients in Wuhan. China AJR Am J Roentgenol. 2020;5:1–8. doi: 10.2214/AJR.20.22975. [DOI] [PubMed] [Google Scholar]
- 18.Ng M, Lee E, Yang J, Yang F, Li X, Wang H, et al. Imaging profile of the COVID-19 infection: radiologic findings and literature review. Radiol Cardiothorac Imaging. 2020 doi: 10.1148/ryct.2020200034. [DOI] [PMC free article] [PubMed] [Google Scholar]
- 19.Bai HX, Hsieh B, Xiong Z, Halsey K, Choi JW, Tran TML, et al. Performance of radiologists in differentiating COVID-19 from viral pneumonia on chest CT. Radiology. 2020;10:200823. doi: 10.1148/radiol.2020200823. [DOI] [PMC free article] [PubMed] [Google Scholar]
- 20.Han R, Huang L, Jiang H, Dong J, Peng H, Zhang D. Early clinical and CT manifestations of coronavirus disease 2019 (COVID-19) pneumonia. AJR Am J Roentgenol. 2020;17:1–6. doi: 10.2214/AJR.20.22961. [DOI] [PubMed] [Google Scholar]
- 21.Cheng Z, Lu Y, Cao Q, Qin L, Pan Z, Yan F, et al. Clinical features and chest CT manifestations of coronavirus disease 2019 (COVID-19) in a single-center Study in Shanghai. China AJR Am J Roentgenol. 2020;14:1–6. doi: 10.2214/AJR.20.22959. [DOI] [PubMed] [Google Scholar]
- 22.Pan Y, Guan H, Zhou S, Wang Y, Li Q, Zhu T, et al. Initial CT findings and temporal changes in patients with the novel coronavirus pneumonia (2019-nCoV): a study of 63 patients in Wuhan. China Eur Radiol. 2020 doi: 10.1007/s00330-020-06731-x. [DOI] [PMC free article] [PubMed] [Google Scholar]
- 23.Wu J, Wu X, Zeng W, Guo D, Fang Z, Chen L, et al. Chest CT findings in patients with corona virus disease 2019 and its relationship with clinical features. Invest Radiol. 2020 doi: 10.1097/RLI.0000000000000670. [DOI] [PMC free article] [PubMed] [Google Scholar]
- 24.Shi H, Han X, Jiang N, Cao Y, Alwalid O, Gu J, et al. Radiological findings from 81 patients with COVID-19 pneumonia in Wuhan, China: a descriptive study. Lancet Infect Dis. 2020 doi: 10.1016/S1473-3099(20)30086-4. [DOI] [PMC free article] [PubMed] [Google Scholar]
- 25.Fang Y, Zhang H, Xu Y, Xie J, Pang P, Ji W. CT manifestations of two cases of 2019 novel coronavirus (2019-nCoV) pneumonia. Radiology. 2020;295(1):208–209. doi: 10.1148/radiol.2020200280. [DOI] [PMC free article] [PubMed] [Google Scholar]
- 26.Li K, Wu J, Wu F, Guo D, Chen L, Fang Z, et al. The clinical and chest CT features associated with severe and critical COVID-19 pneumonia. Invest Radiol. 2020 doi: 10.1097/RLI.0000000000000672. [DOI] [PMC free article] [PubMed] [Google Scholar]
- 27.Chen N, Zhou M, Dong X, Qu J, Gong F, Han Y, et al. Epidemiological and clinical characteristics of 99 cases of 2019 novel coronavirus pneumonia in Wuhan, China: a descriptive study. Lancet. 2020;395(10223):507–513. doi: 10.1016/S0140-6736(20)30211-7. [DOI] [PMC free article] [PubMed] [Google Scholar]
- 28.Guan WJ, Ni ZY, Hu Y, Liang WH, Ou CQ, He JX, et al. China Medical Treatment Expert Group for Covid-19. Clinical characteristics of coronavirus disease 2019 in China. N Engl J Med. 2020 doi: 10.1056/NEJMoa2002032. [DOI] [PMC free article] [PubMed] [Google Scholar]
- 29.Diao K, Han P, Pang Y, Li Y, Yang Z. HRCT imaging features in representative imported cases of 2019 novel coronavirus pneumonia. Precis Clin Med. 2020 doi: 10.1093/pcmedi/pbaa004. [DOI] [PMC free article] [PubMed] [Google Scholar]
- 30.Fang Y, Zhang H, Xie J, Lin M, Ying L, Pang P, et al. Sensitivity of chest CT for COVID-19: comparison to RT-PCR. Radiology. 2020;19:200432. doi: 10.1148/radiol.2020200432. [DOI] [PMC free article] [PubMed] [Google Scholar]
- 31.Song F, Shi N, Shan F, Zhang Z, Shen J, Lu H, et al. Emerging 2019 novel coronavirus (2019-nCoV) pneumonia. Radiology. 2020;295(1):210–217. doi: 10.1148/radiol.2020200274. [DOI] [PMC free article] [PubMed] [Google Scholar]
- 32.Lin X, Gong Z, Xiao Z, Xiong J, Fan B, Liu J. Novel coronavirus pneumonia outbreak in 2019: computed tomographic findings in two cases. Korean J Radiol. 2020;21(3):365–368. doi: 10.3348/kjr.2020.0078. [DOI] [PMC free article] [PubMed] [Google Scholar]
- 33.Yoon SH, Lee KH, Kim JY, Lee YK, Ko H, Kim KH, et al. Chest radiographic and CT findings of the 2019 novel coronavirus disease (COVID-19): analysis of nine patients treated in Korea. Korean J Radiol. 2020;21(4):494–500. doi: 10.3348/kjr.2020.0132. [DOI] [PMC free article] [PubMed] [Google Scholar]
- 34.Xu X, Yu C, Qu J, Zhang L, Jiang S, Huang D, et al. Imaging and clinical features of patients with 2019 novel coronavirus SARS-CoV-2. Eur J Nucl Med Mol Imaging. 2020 doi: 10.1007/s00259-020-04735-9. [DOI] [PMC free article] [PubMed] [Google Scholar]
- 35.Zhou Z, Guo D, Li C, Fang Z, Chen L, Yang R, et al. Coronavirus disease 2019: initial chest CT findings. Eur Radiol. 2020 doi: 10.1007/s00330-020-06816-7. [DOI] [PMC free article] [PubMed] [Google Scholar]
- 36.Li X, Zeng W, Li X, Chen H, Shi L, Li X, et al. CT imaging changes of coronavirus disease 2019(COVID-19): a multi-center study in Southwest China. Transl Med. 2020;18(1):154. doi: 10.1186/s12967-020-02324-w. [DOI] [PMC free article] [PubMed] [Google Scholar]
- 37.Caruso D, Zerunian M, Polici M, Pucciarelli F, Polidori T, Rucci C, et al. Chest CT features of COVID-19 in Rome, Italy. Radiology. 2020;3:201237. doi: 10.1148/radiol.2020201237. [DOI] [PMC free article] [PubMed] [Google Scholar]
- 38.Zhu T, Wang Y, Zhou S, Zhang N, Xia LA. Comparative study of chest computed tomography features in young and older adults with corona virus disease (COVID-19) J Thorac Imaging. 2020 doi: 10.1097/RTI.0000000000000513. [DOI] [PMC free article] [PubMed] [Google Scholar]
- 39.Himoto Y, Sakata A, Kirita M, Hiroi T, Kobayashi KI, Kubo K, et al. Diagnostic performance of chest CT to differentiate COVID-19 pneumonia in non-high-epidemic area in Japan. Jpn J Radiol. 2020 doi: 10.1007/s11604-020-00958-w. [DOI] [PMC free article] [PubMed] [Google Scholar]
- 40.Wang K, Kang S, Tian R, Zhang X, Zhang X, Wang Y. Imaging manifestations and diagnostic value of chest CT of coronavirus disease 2019 (COVID-19) in the Xiaogan area. Clin Radiol. 2020;75(5):341–347. doi: 10.1016/j.crad.2020.03.004. [DOI] [PMC free article] [PubMed] [Google Scholar]
- 41.Yang S, Shi Y, Lu H, Xu J, Li F, Qian Z, et al. Clinical and CT features of early-stage patients with COVID-19: a retrospective analysis of imported cases in Shanghai. China. Eur Respir J. 2020 doi: 10.1183/13993003.00407-2020. [DOI] [PMC free article] [PubMed] [Google Scholar]
- 42.Li K, Fang Y, Li W, et al. CT image visual quantitative evaluation and clinical classification of coronavirus disease (COVID-19) Eur Radiol. 2020 doi: 10.1007/s00330-020-06817-6. [DOI] [PMC free article] [PubMed] [Google Scholar]
- 43.Dai H, Zhang X, Xia J, Zhang T, Shang Y, Huang R, et al. High-resolution chest CT features and clinical characteristics of patients infected with COVID-19 in Jiangsu, China. Int J Infect Dis. 2020 doi: 10.1016/j.ijid.2020.04.003. [DOI] [PMC free article] [PubMed] [Google Scholar]
- 44.Yuan M, Yin W, Tao Z, Tan W, Hu Y. Association of radiologic findings with mortality of patients infected with 2019 novel coronavirus in Wuhan, China. PLoS ONE. 2020;15(3):e0230548. doi: 10.1371/journal.pone.0230548. [DOI] [PMC free article] [PubMed] [Google Scholar]
- 45.Iwasawa T, Sato M, Yamaya T, et al. Ultra-high-resolution computed tomography can demonstrate alveolar collapse in novel coronavirus (COVID-19) pneumonia. Jpn J Radiol. 2020 doi: 10.1007/s11604-020-00956-y. [DOI] [PMC free article] [PubMed] [Google Scholar]
- 46.Wang Y, Dong C, Hu Y, Li C, Ren Q, Zhang X, et al. Temporal changes of CT findings in 90 patients with COVID-19 pneumonia: a longitudinal study. Radiology. 2020;19:200843. doi: 10.1148/radiol.2020200843. [DOI] [PMC free article] [PubMed] [Google Scholar]
- 47.Ooi GC, Khong PL, Müller NL, Yiu WC, Zhou LJ, Ho JC, et al. Severe acute respiratory syndrome: temporal lung changes at thin-section CT in 30 patients. Radiology. 2004;230(3):836–844. doi: 10.1148/radiol.2303030853. [DOI] [PubMed] [Google Scholar]
- 48.Jin YH, Cai L, Cheng ZS, Cheng H, Deng T, Fan YP, et al. For the Zhongnan Hospital of Wuhan University Novel Coronavirus Management and Research Team, Evidence-Based Medicine Chapter of China International Exchange and Promotive Association for Medical and Health Care (CPAM). A rapid advice guideline for the diagnosis and treatment of 2019 novel coronavirus (2019-nCoV) infected pneumonia (standard version) Mil Med Res. 2020;7(1):4. doi: 10.1186/s40779-020-0233-6. [DOI] [PMC free article] [PubMed] [Google Scholar]
- 49.Pan F, Ye T, Sun P, Gui S, Liang B, Li L, et al. Time course of lung changes on chest CT during recovery from 2019 novel coronavirus (COVID-19) pneumonia. Radiology. 2020;13:200370. doi: 10.1148/radiol.2020200370. [DOI] [PMC free article] [PubMed] [Google Scholar]
- 50.Kong W, Agarwal P. Chest imaging appearance of COVID-19 infection. Radiol Cardiothorac Imaging. 2020 doi: 10.1148/ryct.2020200028. [DOI] [PMC free article] [PubMed] [Google Scholar]
- 51.Albarello F, Pianura E, Di Stefano F, Cristofaro M, Petrone A, Marchioni L, et al. 2019-novel Coronavirus severe adult respiratory distress syndrome in two cases in Italy: an uncommon radiological presentation. Int J Infect Dis. 2020;26(93):192–197. doi: 10.1016/j.ijid.2020.02.043. [DOI] [PMC free article] [PubMed] [Google Scholar]
- 52.Lei DP. The progression of computed tomographic (CT) images in patients with coronavirus disease (COVID-19) pneumonia: the CT progression of COVID-19 pneumonia. J Infect. 2020 doi: 10.1016/j.jinf.2020.03.020. [DOI] [PMC free article] [PubMed] [Google Scholar]
Associated Data
This section collects any data citations, data availability statements, or supplementary materials included in this article.


