Abstract
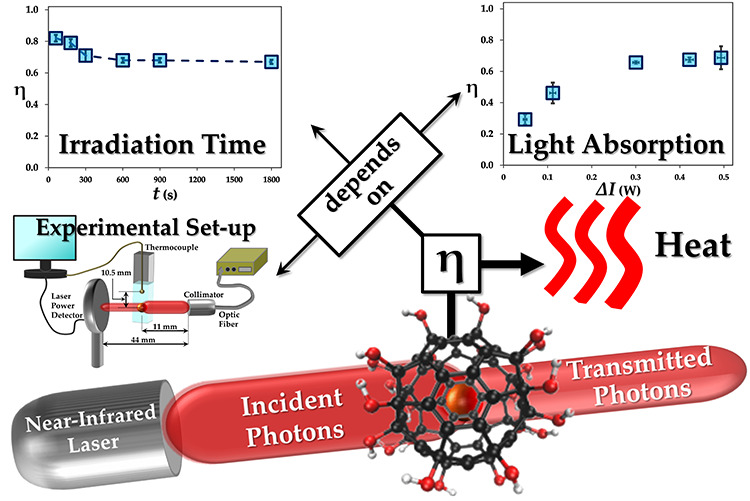
Photothermal therapy, utilizing photonic nanoparticles, has gained substantial interest as an alternative to systemic cancer treatments. Several different photothermal nanoparticles have been designed and characterized for their photothermal efficiency. However, a standardized experimental methodology to determine the photothermal efficiency is lacking leading to differences in the reported values for the same nanoparticles. Here, we have determined the role of different experimental parameters on the estimation of photothermal efficiency. Importantly, we have demonstrated the role of laser irradiation time and nanoparticle concentration as the two critical factors that can lead to errors in the estimation of photothermal efficiency. Based on the optimized parameters, we determined the photothermal conversion efficiency of polyhydroxy fullerenes to be 69%. Further, the photothermal response of polyhydroxy fullerenes was found to be stable with repeated laser irradiation and no changes in the molecular structure were observed. Given its high photothermal efficiency and superior stability, polyhydroxy fullerenes are an ideal candidate for photothermal therapy.
Introduction
Photothermal therapy has gained substantial interest as an alternative to systemic cancer treatments such as chemotherapy and radiation therapy, which have toxic side effects. Photothermal therapy utilizes photonic nanoparticles that produce heat under laser irradiation and allows for localized tumor destruction. Several different photothermal nanoparticle systems have been engineered to absorb near-infrared light, a preference for deep-tissue penetration in clinical applications.1−4 For example, the thickness of gold nanoshells (AuNS) or the aspect ratio of gold nanorods (AuNR) can be modified for optimal laser absorption and heat generation in the 780–1000 nm range.1,5,6 Important design criteria for photothermal agents include a high photothermal (light-to-heat conversion) efficiency, photothermal stability, biocompatibility, safety (low toxicity), and ease of clearance.
Photothermal efficiency characterizes the ability of nanoparticles to convert light to heat. The photothermal efficiency (η) of nanoparticles was first proposed by Roper et al. as a way to characterize the heat flux upon laser irradiation of gold nanoparticles.7 The experiments to determine photothermal efficiency were conducted in a simple cuvette-based system. The sample, in a cuvette, was irradiated with laser, and the rise in temperature of the sample was recorded. The experiment was carried out until a steady state was reached and the time taken for the sample to cool down to room temperature was recorded. The experimental data was used to solve a steady-state energy balance equation (eq 1)
| 1 |
where QHG = energy generated (W), QHT = energy transferred (W), η = photothermal conversion efficiency, h = system heat constant, ΔI = light absorption by the sample, ΔT = temperature change, m = mass, C = specific heat capacity of water (4184 J/kg °C), and dt = interval of temperature measurement. Roper and colleagues calculated η using a time constant that represents the transient temperature profile.7 Subsequent reports have utilized the time constant method to determine the photothermal efficiency of different nanoparticles albeit with different experimental procedures.4,8−20 As more photothermal agents are being developed and characterized, there is a lack of a standardized method and experimental parameters that allow for adequate comparison between different nanoparticle designs. For example, the photothermal efficiency of gold nanorods varies from 36.2 to 55% depending on the experimental parameters.4,18
Some of the differences in experimental procedures employed by various groups include the cuvette material, position of the thermocouple, irradiation time, incident laser power, and concentration of nanoparticles. For example, the cuvette material, which affects the steady-state experiments, can be silica based (glass or quartz)7,9−11,13 or plastic (poly(methyl methacrylate) or polystyrene).4,14,16,18 Since quartz and plastic have different thermal properties,21 η estimation could be influenced without consideration of these differences. Also, laser absorption by the thermocouple metals or its insulation can overestimate temperature measurement by up to 9.9 °C.22 Therefore, the position of the thermocouple in the cuvette with respect to the path of the laser significantly affects η estimation. Calculation of the photothermal efficiency with a steady-state energy balance requires that photothermal experiments are conducted until the temperature of solution in the cuvette reaches a steady state. However, the reported laser irradiation time varies from 250 to 3600 s (Table S1), which, in some cases, is not sufficient to achieve the steady state. Another difference between reports is the incident laser power employed for the photothermal experiments, which varies from 0.1 to 2 W (Table S1). Further, the concentration of nanoparticles employed for these experiments ranges from 0.03 to 10 mg/mL (Table S1). Jiang et al. suggests a logarithmic relationship between η and concentration.11 Given these differences in concentrations, it is no longer adequate to simply report η as a single number. At a minimum, the photothermal efficiency should be reported at a characteristic concentration. However, as mass concentration is material-specific, laser absorbance (ΔI) is a better parameter for comparison.
In this study, we determine the role of different experimental parameters on the estimation of photothermal efficiency for a given nanomaterial. We chose polyhydroxy fullerenes for these studies as its photothermal response is independent of laser wavelength and, thus, can be applied for photothermal cancer treatment.3,23,24 Further, we determine the reproducibility and photostability of polyhydroxy fullerenes.
Results and Discussion
Optimization of the Experimental Setup
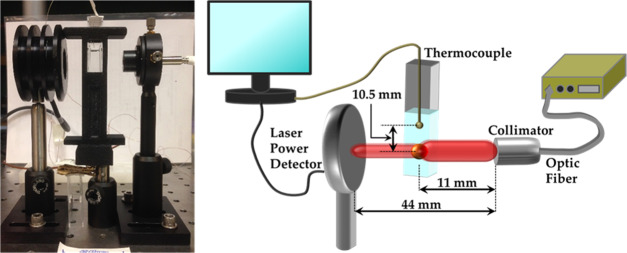
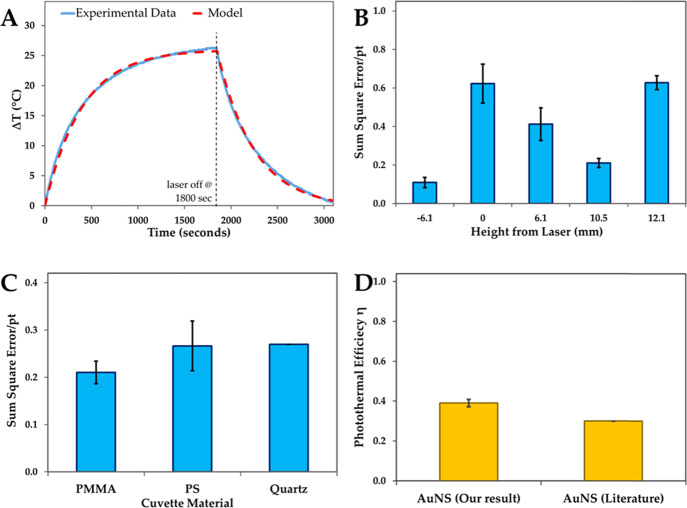
We first optimized the photothermal setup in terms of the position of the thermocouple with respect to the laser beam and the type of cuvette employed. The design of the photothermal setup is presented in Figure 1, which consists of a continuous wave, near-infrared laser, cuvette containing 1 mL of the sample, and a laser power detector. The laser beam from a 550 μm optic fiber is collimated before irradiating at the center of the sample in the cuvette. The distance between the cuvette and the laser collimator was fixed at 11 mm. The power of the laser exiting the cuvette was measured with a laser power detector positioned at a distance of 44 mm from the collimator. In a typical photothermal experiment, the incident laser power (Io) was first measured without the cuvette. Next, the transmitted laser power (IT) was measured with the cuvette and the thermocouple (fixed with the cuvette lid) in position. After the laser absorbance (ΔI = Io– IT) was determined, temperature recording was initiated. At time t = 0, the laser was turned on and the temperature rise was monitored. After a predetermined time under steady-state conditions, the laser was turned off and the sample was allowed to cool down to room temperature. An example of a photothermal heating and cooling curve is presented in Figure 2a. Initially, the temperature rise is linear and reaches a steady-state plateau between the heat generated by photothermal nanoparticles and heat lost to the surroundings. This experimental data was then fitted with an energy balance equation (eq 1). The goodness of fit was determined by the sum of squared errors (differences between the model and experimental temperature values), which was minimized by using the solver function in Microsoft Excel by changing the photothermal conversion efficiency and system heat constant.
Figure 1.
Photograph (left) and schematic (right) of the photothermal setup showing the optical system consisting of the power detector, cuvette with the sample, and 785 nm near-infrared, continuous wave laser. The distance between the power detector to the collimator was 44 mm, while the distance between the cuvette’s center and the collimator was 11 mm. The thermocouple’s tip was placed 10.5 mm above the laser beam.
Figure 2.
Optimization of the photothermal experimental setup. (A) Example of an experimental photothermal heating and cooling curve and model fit to the experimental data. (B) Optimization of the thermocouple distance from the laser beam. (C) Optimization of the cuvette material. (D) Comparison of the photothermal efficiency obtained from our experimental setup and reported literature value.4 All experiments were conducted in triplicate (n = 3) and error bars represent standard deviations.
The thermocouple position with respect to the laser beam was changed from above (+) to below (−) the laser beam. The sum of squared errors was then utilized to determine the optimal thermocouple position (Figure 2b). The thermocouple with the metal junction exposed absorbs and scatters the near-infrared laser, and this phenomenon has been reported to cause artifacts in temperature measurements.22,25 At the positions of −6.1 and 0 mm, the laser is absorbed and scattered by thermocouple wires and the metal junction and these positions were not considered for further experiments. Increasing the distance of the thermocouple position above the laser path decreased the sum of squared errors with the lowest at 10.5 mm. The distance of 12.1 mm from the laser path is proximal to the liquid–air interface where evaporation and condensation are occurring. This position exhibited the higher sumof squared errors due to variations in temperature measurements caused by the dynamic interface. The thermocouple position at +10.5 mm yielded the smallest sum of squared errors and was used for all subsequent experiments.
Next, we optimized the cuvette material employed for the photothermal experiments. The cuvette material should be able to transmit all light and prevent heat transfer to the surroundings. Three commonly used cuvettes made of poly(methyl methacrylate) (PMMA), polystyrene (PS) and quartz were tested. Each material was tested using a typical photothermal experiment and optimized using the sum of squared errors. Although quartz has the lowest absorbance at 785 nm, it has the highest heat conductivity and could result in higher heat loss to the surroundings (Table 1). The light absorbance and heat conductivity of PMMA and PS were similar. However, PMMA with absorbance and heat conductivity between the other two materials provided the least sum of squared errors (Figure 2c) and was employed for further experiments. With the photothermal setup optimized for the thermocouple position and the cuvette material, we determined the photothermal efficiency (η) of gold nanoshells (AuNS; c = 0.03 mg/mL) to be 39% (Figure 2d), which is in good agreement with Cole et al.4
Table 1. Absorbance and Heat Conductivity of Different Cuvette Materialsa.
| cuvette material | PMMA | PS | quartz |
|---|---|---|---|
| absorbance at 785 nm | 0.0892 | 0.0968 | 0.0615 |
| heat conductivity (W/(m K)) | 0.19 | 0.13 | 1.42 |
The absorbance at 785 nm was determined using a UV–vis–NIR spectrophotometer. Heat conductivity values were taken from ref (21).
Optimization of Experimental Variables
The steady-state equation (eq 1) can be written in terms of the photothermal efficiency
| 2 |
| 3 |
where η = photothermal conversion efficiency, h = system heat constant, ΔI = light absorption by the sample (W), I0 = incident laser power (W), ΔT = temperature change, m = mass of the sample, C = specific heat capacity of water, t = irradiation time, ε = extinction coefficient, l = laser path length in the cuvette (1 cm), and c = concentration of nanoparticles. Since h, a, m, ε, l, and C are constant for the system, the major variables in these equations are the irradiation time (t), incident laser power (I0), and concentration of nanoparticles (c).
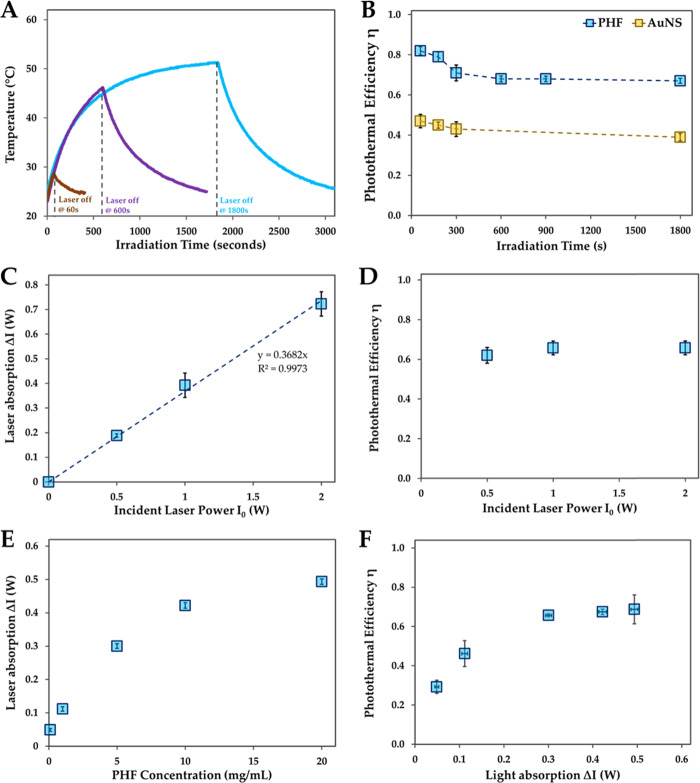
Based on eq 3, the photothermal efficiency should exponentially decrease and eventually reach a constant value at longer irradiation times.26 To determine the role of irradiation time, we conducted photothermal experiments with polyhydroxy fullerenes (PHF; c = 10 mg/mL; ΔI = 0.4 W; I0 = 0.5 W) irradiated with the laser for 60, 180, 300, 600, 900, and 1800 s. As evident in Figure 3a, the system attains the steady state with laser irradiation longer than 1500 s. The photothermal efficiency was found to be highest (η = 82 ± 2%) at the shortest irradiation time of 60 s and decreased with increasing irradiation time. The photothermal efficiency (η) reached a constant value of 69 ± 1.5% for PHF above 600 s (Figure 3b). We repeated these experiments by irradiating gold nanoshells (AuNS; c = 0.03 mg/mL; ΔI = 0.45 W; I0 = 0.5 W) with the laser for 60, 180, 300, and 1800 s. The photothermal efficiency for AuNS was highest (η = 47 ± 3.4%) at 60 s and decreased with longer irradiation time. Similar to PHF, the photothermal efficiency values reached a constant value (η = 39 ± 1.8%) at longer irradiation times. These results suggest that, regardless of the photothermal agent, the photothermal efficiency is overestimated with shorter laser irradiation times. Based on the results in Figure 3b, a minimum laser irradiation time of 600 s is required. Since our photothermal system attains the steady state above 1500 s, further experiments were carried out with laser irradiation time set at 1800 s.
Figure 3.
Optimization of photothermal experiment variables. (A) Photothermal heating and cooling curves with different laser irradiation times. The concentrations of polyhydroxy fullerenes (10 mg/mL; ΔI = 0.4 W) and the laser power (I0 = 0.5 W) were kept constant. (B) Photothermal efficiency as a function of laser irradiation time for polyhydroxy fullerenes (PHF) and gold nanoshells (AuNS). The light absorption for PHF (10 mg/mL) and AuNS (0.0312 mg/mL) was similar at ΔI = 0.4 W with the incident laser power of I0 = 0.5 W. (C) Laser absorption as a function of the incident laser power. The concentrations of PHF and laser irradiation time were constant at 10 mg/mL and 1800 s, respectively. (D) Photothermal efficiency as a function of the incident laser power. (E) Laser absorption as a function of PHF concentration. The incident laser power (I0) was kept constant at 0.5 W. (F) Photothermal efficiency as a function of light absorption, which was varied by changing PHF concentration. The incident laser power (I0) and irradiation time were kept constant at 0.5 W and 1800 s, respectively. All experiments were conducted in triplicate (n = 3) and error bars represent standard deviations.
Next, the role of incident laser power (I0) was determined by conducting photothermal experiments with PHF (c = 1 mg/mL; t = 1800 s) at 0.5, 1, and 2 W laser powers. PHF’s laser absorption was found to increase linearly with laser power as expected (Figure 3c). Based on eq 3, photothermal efficiency should decrease with the increasing laser power (I0). However, temperature rise (ΔT) is directly proportional to the incident laser power. Thus, the overall effect of changing incident laser power on photothermal efficiency is expected to be negligible. The photothermal efficiency did not significantly change at the tested laser powers (Figure 3d).
Finally, the effect of concentration of nanoparticles on the photothermal efficiency was determined. The irradiation time (t = 1800 s) and the incident laser power (I0 = 0.5 W) were kept constant. The absorbance of PHF increases linearly with concentration (Figure S1a). The extinction coefficient of PHF at 785 nm was determined to be 0.071 mL/(mg cm). Photothermal efficiency increases linearly at lower concentrations of PHF and then plateaus at higher concentrations reaching a constant value of 69% (Figure S1b). This trend is consistent with that of other photothermal agents, as seen in literature.11 However, comparison of the photothermal efficiency of nanoparticles based on concentration may not be appropriate as the nanoparticles have different absorption coefficients and size that could scatter light.9 Since the light absorption is an intrinsic optical property of the nanoparticle, which depends on its size and absorption coefficient, the light absorption (ΔI) is more suitable for comparing different nanoparticles. Figure 3e shows the changes in the amount of the laser light absorbed (ΔI) by different concentrations of PHF. The photothermal efficiency of PHF was determined to be 29 ± 3.4% at the lowest ΔI of 0.05 W (c = 0.1 mg/mL). The photothermal efficiency reached a constant value of 69% above ΔI of 0.3 W (Figure 3f), suggesting that η does not change if the nanoparticles absorb at least half of the incident light (I0 is 0.5 W). The attainment of the constant value is consistent with eq 2 as the temperature rise (ΔT) and maximum temperature achieved at the steady state linearly increased with light absorption as expected (Figure S2). At similar light absorptions, PHF exhibited 1.8 × higher photothermal efficiency than AuNS (Figure S2a). These results suggest that the photothermal efficiency is underestimated at lower nanoparticle concentrations and should be reported with the nanoparticle concentration that absorbs at least half of the incident irradiation. Further, ΔI should be reported for comparison with other photothermal agents.
PHF Photothermal Stability
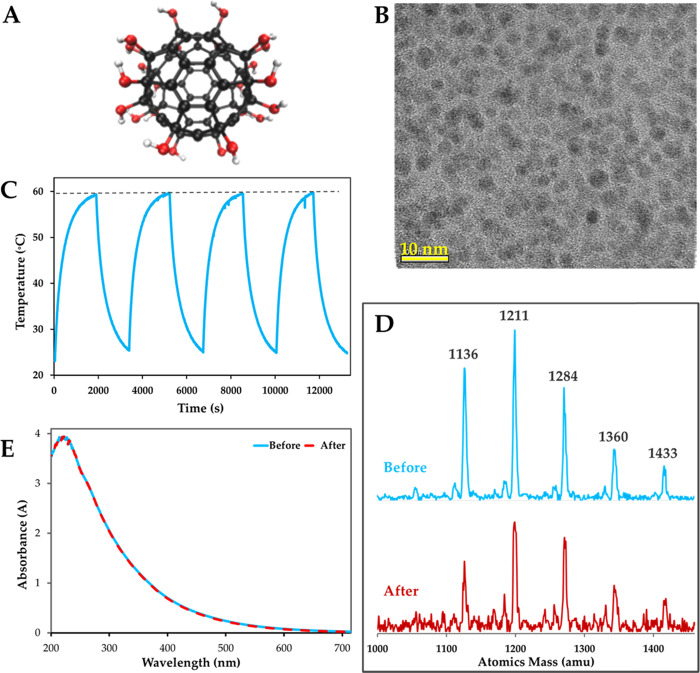
Some photothermal agents such as gold nanorods5 are known to change their structure with laser absorption and eventually lose their photothermal property. Polyhydroxy fullerenes are spherical carbon cages appended with hydroxyl groups on surfaces (Figure 4a). PHF is 1.3 nm in size, highly water soluble, and forms clusters at higher concentration.27 High-resolution transmission electron microscopy shows that PHF exists as a 3 ± 0.4 nm cluster (Figure 4b). PHF has been reported to instantaneously ignite with laser irradiation,3 and thus, it is important to determine the stability of PHF after the photothermal experiment. To determine the effect of laser absorption and heating on the photothermal response of PHF, sequential photothermal heating and cooling of PHF (c = 10 mg/mL; ΔI = 0.4 W; I0 = 0.5 W; t = 1800 s) for a total of four cycles were carried out (Figure 4c). The maximum temperature observed was constant at 59 °C and did not change significantly over four cycles of heating and cooling (Figure 4c). To determine the effect of photothermal heating on the molecular structure, PHF (c = 1 mg/mL) was exposed to a high power laser (I0 = 2 W) continuously for 4 h. The structural stability of PHF before and after photothermal exposure was determined by time-of-flight secondary ion mass spectroscopy (ToF-SIMS) and UV–vis absorption. PHF has five characteristics mass peaks (Figure 4d) at 1136, 1211, 1284, 1360, and 1433 m/z. The ToF-SIMS spectrum of PHF after heating was identical to unexposed PHF. Further, the UV–vis absorption of PHF remains unchanged after heating (Figure 4e). These results suggest that the PHF structure is stable, and there is no breakdown of the fullerene cage or loss in functional groups.
Figure 4.
Polyhydroxy fullerenes and photothermal stability. (A) Molecular structure of PHF. (B) High-resolution transmission electron microscope image of PHF clusters. (C) Heating curve showing four laser on/off cycles for PHF (ΔI = 0.4 W). The sample was heated for 1800 s at 0.5 W and cooled until the ambient temperature (23 °C) was reached. There was no significant difference (p > 0.01) in the maximum temperature between cycles. (D) Time-of-flight secondary ion mass spectrometry of PHF before and after 4 h of irradiation. (E) UV–vis spectrophotometry of PHF before and after 4 h of irradiation.
Conclusions
In this article, we have determined the minimum experimental variables that should be used for estimating the photothermal efficiency of nanoparticles. The photothermal experiment conducted with an irradiation time that reaches the steady-state conditions and a nanoparticle concentration that absorbs at least half of the incident laser irradiation provides consistent results. Incident laser power at the tested range did not have any effect on the photothermal efficiency estimations. Based on these requirements, the photothermal efficiency of polyhydroxy fullerenes was determined to be around 69% (ΔI = 0.4 W; I0 = 0.5 W; t = 1800 s). Further, polyhydroxy fullerenes are stable to repeated laser heating and do not exhibit any change in the molecular structure. Given these observations, polyhydroxy fullerenes are excellent candidates for photothermal therapy.
Experimental Section
Materials
Polyhydroxy fullerene (PHF) was purchased from MER Corporation (Tuscon, AZ), SES Research (Houston, TX), and Suzhou Dade Carbon Nanotechnology Company (Suzhou, China). Gold nanoshell (AuNS) was purchased from NanoComposix (San Diego, CA). All other chemicals were purchased from Fisher Scientific (Pittsburg, PA).
Photothermal Apparatus Design
PHF’s photothermal property was determined using a custom-built setup (Figure 1), which consisted of a 785 nm near-infrared continuous wave (CW) laser (B&W Tek, Newark, DE), a laser power detector (Coherent, Santa Clara, CA), a three-dimensional (3-D)-printed 1 mL cuvette holder, and a K-type thermocouple (5SRTC-TT-K-40-36) connected to a HH1470 data logger (Omega, Norwalk, CT). The laser was connected to a 550 μm optical fiber and a fixed collimator with a focal length = 11.07 mm (Thorlabs Inc, Newton, NJ). The thermocouple was inserted into the system through a hole drilled into a cuvette cap similar to the procedure in Cole et al.4 The power of the laser exiting the cuvette was measured with the laser power detector positioned at a distance of 44 mm from the collimator.
Photothermal Conversion Efficiency Determination
Photothermal experiments were performed with 1 mL of the desired sample in a cuvette and inserted into the cuvette holder. The sample was irradiated with the laser for a given length of time (optimized to 1800 s). Subsequently, the laser was turned off and the cooling rate was measured. The photothermal efficiency was then determined using an energy balance model (eq 4) similar to Cole et al.4
| 4 |
where QHG = energy generated (W), QHT = energy transferred (W), η = photothermal conversion efficiency, h = system heat constant, ΔI = light absorption by the sample, ΔT = temperature change, m = mass, C = specific heat capacity of water, and dt = interval of temperature measurement.
η was then calculated using the solver function in Microsoft Excel by minimizing the sum of squared errors. Similarly, the value for h was also determined using the solver and was found to be a constant 0.01 J/sK. Both η and h were determined via the solver simultaneously. A time step (dt) of 5 s was used in the calculations. Finally, the specific heat of the whole system was assumed to be of water, the dominant quantity in the solution. The mass of water was almost three orders of magnitude greater than the masses of PHF and AuNS. Thus, a mass of 1 g and the specific heat of water (4184 J/kg °C) were used.
PHF Characterization
The molecular structure of PHF was determined with high-resolution transmission electron microscopy (FEI Tecnai F30) and time-of-flight secondary ion mass spectrometry (PHI TRIFT V nano ToF-SIMS; Physical Electronics, Inc., Chanhassen, MN). The ground-state absorption spectrum for PHF was obtained with a Perkin Elmer Lambda 1050 UV–vis–NIR spectrophotometer (Waltham, MA).
Acknowledgments
The authors acknowledge the financial support from the Elsa U Pardee Foundation and the Lerner Research Institute. Any opinions, findings, conclusions, or recommendations expressed herein are those of the author(s) and do not necessarily reflect the views of the funding agencies. Cuvette holder was 3D printed at Sears think[box]. HR-TEM and ToF-SIMS were carried out at the Swagelok Center for Surface Analysis of Materials and were supported by Lerner Research Institute’s seed funds for V.B.K.
Supporting Information Available
The Supporting Information is available free of charge at https://pubs.acs.org/doi/10.1021/acsomega.0c01018.
Ground-state absorption of PHF as a function of concentration at 785 nm; Photothermal conversion efficiency as a function of PHF concentration. Effect of light absorption (ΔI) on photothermal efficiency (η), temperature rise (ΔT), and maximum temperature. Comparison of literature values of photothermal efficiency determined and the experimental parameters employed (PDF)
Author Present Address
§ Oncology Institute, Cleveland Clinic Abu Dhabi, Abu Dhabi, United Arab Emirates.
The authors declare no competing financial interest.
Supplementary Material
References
- Vines J. B.; Yoon J. H.; Ryu N. E.; Lim D. J.; Park H. Gold Nanoparticles for Photothermal Cancer Therapy. Front. Chem. 2019, 7, 167 10.3389/fchem.2019.00167. [DOI] [PMC free article] [PubMed] [Google Scholar]
- Awasthi R.; Roseblade A.; Hansbro P. M.; Rathbone M. J.; Dua K.; Bebawy M. Nanoparticles in Cancer Treatment: Opportunities and Obstacles. Curr. Drug Targets 2018, 19, 1696–1709. 10.2174/1389450119666180326122831. [DOI] [PubMed] [Google Scholar]
- Krishna V.; Stevens N.; Koopman B.; Moudgil B. Optical heating and rapid transformation of functionalized fullerenes. Nat. Nanotechnol. 2010, 5, 330–334. 10.1038/nnano.2010.35. [DOI] [PubMed] [Google Scholar]
- Cole J. R.; Mirin N. A.; Knight M. W.; Goodrich G. P.; Halas N. J. Photothermal Efficiencies of Nanoshells and Nanorods for Clinical Therapeutic Applications. J. Phys. Chem. C 2009, 113, 12090–12094. 10.1021/jp9003592. [DOI] [Google Scholar]
- Huang X.; Jain P. K.; El-Sayed I. H.; El-Sayed M. A. Plasmonic photothermal therapy (PPTT) using gold nanoparticles. Lasers Med. Sci. 2008, 23, 217–228. 10.1007/s10103-007-0470-x. [DOI] [PubMed] [Google Scholar]
- Ahmad R.; Fu J.; He N.; Li S. Advanced Gold Nanomaterials for Photothermal Therapy of Cancer. J. Nanosci. Nanotechnol. 2016, 16, 67–80. 10.1166/jnn.2016.10770. [DOI] [PubMed] [Google Scholar]
- Roper D. K.; Ahn W.; Hoepfner M. Microscale Heat Transfer Transduced by Surface Plasmon Resonant Gold Nanoparticles. J. Phys. Chem. C 2007, 111, 3636–3641. 10.1021/jp064341w. [DOI] [PMC free article] [PubMed] [Google Scholar]
- Bi C.; Chen J.; Chen Y.; Song Y.; Li A.; Li S.; Mao Z.; Gao C.; Wang D.; Möhwald H.; Xia H. Realizing a Record Photothermal Conversion Efficiency of Spiky Gold Nanoparticles in the Second Near-Infrared Window by Structure-Based Rational Design. Chem. Mater. 2018, 30, 2709–2718. 10.1021/acs.chemmater.8b00312. [DOI] [Google Scholar]
- Jiang K.; Smith D. A.; Pinchuk A. Size-Dependent Photothermal Conversion Efficiencies of Plasmonically Heated Gold Nanoparticles. J. Phys. Chem. C 2013, 117, 27073–27080. 10.1021/jp409067h. [DOI] [Google Scholar]
- Tian Q.; Jiang F.; Zou R.; Liu Q.; Chen Z.; Zhu M.; Yang S.; Wang J.; Wang J.; Hu J. Hydrophilic Cu9S5 Nanocrystals: A Photothermal Agent with a 25.7% Heat Conversion Efficiency for Photothermal Ablation of Cancer Cells in Vivo. ACS Nano 2011, 5, 9761–9771. 10.1021/nn203293t. [DOI] [PubMed] [Google Scholar]
- Jiang R.; Cheng S.; Shao L.; Ruan Q.; Wang J. Mass-Based Photothermal Comparison Among Gold Nanocrystals, PbS Nanocrystals, Organic Dyes, and Carbon Black. J. Phys. Chem. C 2013, 117, 8909–8915. 10.1021/jp400770x. [DOI] [Google Scholar]
- Hessel C. M.; Pattani V. P.; Rasch M.; Panthani M. G.; Koo B.; Tunnell J. W.; Korgel B. A. Copper Selenide Nanocrystals for Photothermal Therapy. Nano Lett. 2011, 11, 2560–2566. 10.1021/nl201400z. [DOI] [PMC free article] [PubMed] [Google Scholar]
- Chen H.; Shao L.; Ming T.; Sun Z.; Zhao C.; Yang B.; Wang J. Understanding the photothermal conversion efficiency of gold nanocrystals. Small 2010, 6, 2272–2280. 10.1002/smll.201001109. [DOI] [PubMed] [Google Scholar]
- Yoon H.-J.; Lee H.-S.; Lim J.-Y.; Park J.-H. Liposomal Indocyanine Green for Enhanced Photothermal Therapy. ACS Appl. Mater. Interfaces 2017, 9, 5683–5691. 10.1021/acsami.6b16801. [DOI] [PubMed] [Google Scholar]
- Leng C.; Zhang X.; Xu F.; Yuan Y.; Pei H.; Sun Z.; Li L.; Bao Z. Engineering Gold Nanorod-Copper Sulfide Heterostructures with Enhanced Photothermal Conversion Efficiency and Photostability. Small 2018, 14, e1703077 10.1002/smll.201703077. [DOI] [PubMed] [Google Scholar]
- Sun X.; Sun M.; Liu M.; Yuan B.; Gao W.; Rao W.; Liu J. Shape tunable gallium nanorods mediated tumor enhanced ablation through near-infrared photothermal therapy. Nanoscale 2019, 11, 2655–2667. 10.1039/C8NR08296K. [DOI] [PubMed] [Google Scholar]
- Wang H.; Chang J.; Shi M.; Pan W.; Li N.; Tang B. A Dual-Targeted Organic Photothermal Agent for Enhanced Photothermal Therapy. Angew. Chem., Int. Ed. 2019, 58, 1057–1061. 10.1002/anie.201811273. [DOI] [PubMed] [Google Scholar]
- Younis M. R.; Wang C.; An R.; Wang S.; Younis M. A.; Li Z.-Q.; Wang Y.; Ihsan A.; Ye D.; Xia X.-H. Low Power Single Laser Activated Synergistic Cancer Phototherapy Using Photosensitizer Functionalized Dual Plasmonic Photothermal Nanoagents. ACS Nano 2019, 13, 2544–2557. 10.1021/acsnano.8b09552. [DOI] [PubMed] [Google Scholar]
- Weng Y.; Guan S.; Wang L.; Qu X.; Zhou S. Hollow carbon nanospheres derived from biomass by-product okara for imaging-guided photothermal therapy of cancers. J. Mater. Chem. B 2019, 7, 1920–1925. 10.1039/C8TB02858C. [DOI] [PubMed] [Google Scholar]
- Lindley S. A.; Zhang J. Z. Bumpy Hollow Gold Nanospheres for Theranostic Applications: Effect of Surface Morphology on Photothermal Conversion Efficiency. ACS Appl. Nano Mater. 2019, 2, 1072–1081. 10.1021/acsanm.8b02331. [DOI] [Google Scholar]
- Khashan M. A.; Nassif A. Y. Dispersion of the optical constants of quartz and polymethyl methacrylate glasses in a wide spectral range: 0.2–3 μm. Opt. Commun. 2001, 188, 129–139. 10.1016/S0030-4018(00)01152-4. [DOI] [Google Scholar]
- Manns F.; Milne P. J.; Gonzalez-Cirre X.; Denham D. B.; Parel J. M.; Robinson D. S. In situ temperature measurements with thermocouple probes during laser interstitial thermotherapy (LITT): quantification and correction of a measurement artifact. Lasers Surg. Med. 1998, 23, 94–103. . [DOI] [PubMed] [Google Scholar]
- Krishna V.; Singh A.; Sharma P.; Iwakuma N.; Wang Q.; Zhang Q.; Knapik J.; Jiang H.; Grobmyer S. R.; Koopman B.; Moudgil B. Polyhydroxy fullerenes for non-invasive cancer imaging and therapy. Small 2010, 6, 2236–2241. 10.1002/smll.201000847. [DOI] [PubMed] [Google Scholar]
- Grobmyer S. R.; Krishna V. Minimally invasive cancer therapy using polyhydroxy fullerenes. Eur. J. Radiol. 2012, 81, S51–S53. 10.1016/S0720-048X(12)70019-0. [DOI] [PubMed] [Google Scholar]
- Schena E.; Majocchi L. Assessment of temperature measurement error and its correction during Nd:YAG laser ablation in porcine pancreas. Int. J. Hyperthermia 2014, 30, 328–334. 10.3109/02656736.2014.928832. [DOI] [PubMed] [Google Scholar]
- Amjad M.; Jin H.; Du X.; Wen D. Experimental photothermal performance of nanofluids under concentrated solar flux. Sol. Energy Mater. Sol. Cells 2018, 182, 255–262. 10.1016/j.solmat.2018.03.044. [DOI] [Google Scholar]
- Georgieva A. T.; Pappu V.; Krishna V.; Georgiev P. G.; Ghiviriga I.; Indeglia P.; Xu X.; Fan Z. H.; Koopman B.; Pardalos P. M.; Moudgil B. Polyhydroxy fullerenes. J. Nanopart. Res. 2013, 15, 1690 10.1007/s11051-013-1690-6. [DOI] [Google Scholar]
Associated Data
This section collects any data citations, data availability statements, or supplementary materials included in this article.


