

Abstract
Objectives:
To perform a systematic review on ADC values of renal tumor subtypes and meta-analysis on the diagnostic performance of ADC for differentiation of localized clear cell renal cell carcinoma (ccRCC) from other renal tumor types.
Methods:
Medline, Embase, and the Cochrane Library databases were searched for studies published until May 1, 2019 that reported ADC values of renal tumors. Methodological quality was evaluated. For the meta-analysis on diagnostic test accuracy of ADC for differentiation of ccRCC from other renal lesions, we applied a bivariate random-effects model and compared two subgroups of ADC measurement with vs. without cystic and necrotic areas.
Results:
We included 48 studies (2588 lesions) in the systematic review and 13 studies (1126 lesions) in the meta-analysis. There was no significant difference in ADC of renal parenchyma using b-values of 0-800 vs. 0-1000 (p=0.08). ADC measured on selected portions (sADC) excluding cystic and necrotic areas differed significantly from whole lesion ADC (wADC) (p=0.002). Compared to ccRCC, minimal-fat angiomyolipoma, papillary RCC and chromophobe RCC showed significantly lower sADC while oncocytoma exhibited higher sADC. Summary estimates of sensitivity and specificity to differentiate ccRCC from other tumors were 80% (95% CI:0.76-0.88) and 78% (95% CI:0.64-0.89), respectively, for sADC, and 77% (95% CI:0.59-0.90) and 77% (95% CI:0.69-0.86), for wADC. sADC offered higher area under the receiver operating characteristic curve than wADC (0.852 vs. 0.785, p=0.02).
Conclusions:
ADC values of kidney tumors that exclude cystic or necrotic areas more accurately differentiate ccRCC from other renal tumor types than whole lesion ADC values.
Keywords: Diffusion weighted imaging, Apparent diffusion coefficient, Renal cell carcinoma, Clear cell renal cell carcinoma
Introduction
Diffusion-Weighted Imaging (DWI) has been studied for characterizing solid lesions according to their apparent diffusion coefficient (ADC) [1,2]. The literature on DWI for renal tumor characterization emphasizes the potential of a non-contrast technique for identifying important subtypes or tumor histologic grade. However, DWI parameters and techniques are non-standardized, and it is unclear if differences result in heterogeneous test performance for renal tumor subtype differentiation. While numerous studies have evaluated the use of ADC quantitatively in renal tumors, the method of measurement is inconsistent. Regions of Interests (ROIs) are drawn either on the whole lesion, sometimes including cystic, hemorrhagic and necrotic areas [3–5], or on a specific region of the tumor, especially on the solid portion, where a low ADC is visualized [6–8]. A uniform and reliable technique to derive the ADC is essential to advance its potential use in the clinical care of renal lesions.
Because of overlap in the appearance of benign and malignant enhancing tumors on imaging, the standard of care remains surgical resection [1,2,9]. Despite the statistical likelihood of malignancy in small kidney tumors of 75-80%, some cancer subtypes, including chromophobe and papillary RCC, tend to be indolent [9]. Clear cell RCC (ccRCC) is the most common subtype of kidney cancer, and accounts for most cases of metastatic tumors with a worse prognosis compared to other renal lesions [10,11]. Accurate identification of ccRCC may therefore guide treatment decisions toward initial definitive treatment rather than watchful waiting. ccRCC can appear as a solid, necrotic, or complex cystic mass on imaging [12]. Thus, ADC values for such lesions can vary if cysts and necrosis are included [13], and it is unclear whether this factor influences the performance of ADC for identification of ccRCC. One technique for ADC measurement may provide superior differentiation of ccRCC from other common kidney tumor types, or reported differentiation of ccRCC from other lesions could be an artifact of necrotic or cystic areas.
Furthermore, meta-analyses in the literature have examined the summary performance of DWI for characterization of focal renal lesions, specifically for differentiation of benign and malignant lesions [14–16] or between low- and high-grade ccRCC [17], but differences in diagnostic performance attributable to method of ADC calculation have not been investigated [14–18]. The primary purpose of this study was to compare ADC values of renal tumor subtypes according to b-value and method of measurement (with vs. without inclusion of cystic, hemorrhagic and necrotic areas). Second, we evaluated the diagnostic performance of ADC for differentiating localized ccRCC from other renal tumor types using meta-analysis, given that ccRCC is the renal cancer subtype most likely to metastasize.
Materials and Methods
This study was registered on PROSPERO (CRD42019130203). No ethics board approval was required. Methods were in accordance with the Cochrane Collaboration and reported using the PRISMA-DTA guidelines [19]-[20].
Literature search and study selection
Two extractors (one senior resident and one attending specialized in body imaging) performed an independent review of the literature on the three main databases: PubMed (U.S. National Library of Medicine), Embase, and the Cochrane Library. The literature search aimed to identify all relevant articles reporting the use of DWI to characterize renal lesions. Thus, the following search terms were used: “diffusion-weighted MRI” as both a medical subject heading (MeSH) term and as a term in the title or abstract or “apparent diffusion coefficient” in the title or abstract combined with a search for the MeSH term “renal cell carcinoma” or the terms “DWI renal cell carcinoma”, “ADC renal cell carcinoma” and “ADC renal lesion” for title and abstract. No beginning or end date limitations were specified. The search results were updated until May 1st,2019. All titles and abstracts along with full texts of potentially relevant studies were assessed. The Medline and Embase strategies were peer-reviewed by the second extractor using the PRESS standard [21].
Eligibility criteria
The systematic review included original studies that focused on use of DWI in patients with a pathological diagnosis of one of the five most frequent renal lesions: ccRCC, papillary RCC (pRCC), chromophobe RCC (chRCC), minimal-fat angiomyolipoma (mfAML) and oncocytoma. Studies involving differentiation of RCC from angiomyolipoma with bulk fat were not included since the diagnosis is reliably made on conventional imaging. Studies that did not report the distribution of ADC values (mean ± standard deviation or median ± interquartile range) of renal lesions were excluded. Articles studying DWI after the different treatments of the lesions (chemotherapy, radiofrequency, others) were also excluded, as well as case reports, and studies with no pathologically confirmed diagnosis or with duplicate data.
A meta-analysis was then performed on differentiation of ccRCC from the other lesions using the 2×2 table information based on use of an ADC threshold and, using subgroup analysis, to compare the diagnostic performance of the two different methods of measurement of ADC. For this meta-analysis, only articles providing enough information to extract the 2×2 table (sensitivity, specificity, prevalence) were included. Articles with duplicate data from another study were also excluded from this analysis and in case of overlapping cohorts, the largest of these studies was included.
Quality assessment
Quality was evaluated for each included study using the revised Quality Assessment of Diagnostic Accuracy Studies (QUADAS-2) [22]. Each domain was assessed by two independent reviewers (MT,VP). Specific points related to this study for the quality assessment were: 1) inadequate exclusion criteria described for the patient selection; 2) whether measurement of ADC (Index Test) was blinded from the pathologically-confirmed diagnosis; 3) if the pathological examination (Reference Standard) was performed on biopsy or on a surgical pathology specimen; 4)Studies that did not provide information about the dates of inclusion were evaluated as ‘High risk’ (Flow and Timing).
Data extraction and synthesis
The two extractors retrieved data from eligible studies in a standardized manner, including the study characteristics, magnet strength, b-values used for DWI, number of lesions (globally and for each histological type), ADC values of normal renal parenchyma (when provided) and of renal lesions, method of measurement of ADC. Demographic characteristics were also extracted. The studies were divided in 2 categories: the one reporting the ADC of the whole lesion (wADC) including cystic, hemorrhagic and necrotic components, either on one slice or on the entire segmented lesion, and the one reporting the ADC of selected solid regions of the tumor (sADC) excluding the cystic, necrotic and hemorrhagic areas. When measurements by two readers were given, the average was calculated. ADC threshold to differentiate ccRCC with the other lesions of interest as well as the test results, including sensitivity and specificity, were extracted to calculate the 2 × 2 contingency table. If the sensitivity and specificity were not available, efforts were made to contact the study authors and ask for the unpublished data. This approach resulted in complete data for three additional studies. Any disagreement between the two reviewers was resolved by rechecking the articles by a third reviewer (6 years of experience).
Data Analysis
ADC values of normal renal parenchyma were first compared according to the b-values (500/600,800 and 1000) in order to assess the underlying influence of the b-value on ADC values. One study reporting the values of only 5 controls was excluded. Studies were combined according to their maximum b-values (for example, a study with b-values of (50,400,800) was combined in the group (0,800)). The groups of maximal b-values=500 and 600 were also combined. Then, wADC and sADC of ccRCC (the most frequent lesion with the highest number of ADC values) were compared to determine if there was a statistical difference between both metrics. wADC of ccRCC were compared with wADC of the other lesions and sADC of ccRCC with sADC of the other lesions. To account for the varied sample sizes of studies, we used weighted averages for these comparisons. Meta-analysis was performed with a subgroup analysis between the two groups of interest: the one reporting diagnostic performance of sADC and the one reporting performance of wADC. A subgroup analysis was also performed according to the b-value (maximum b of 500/600 versus 800).
Statistical analysis
Means of ADC of normal renal parenchyma across the range of b-values were compared, using analysis of variance (ANOVA) test [23]. T-test [24] was used to compare the means of wADC and sADC of ccRCC. wADC and sADC values of ccRCC were compared with wADC and sADC values of the other lesions, respectively. These analyses were performed using SPSS (IBM Corp. Released 2017. IBM SPSS Statistics for Windows, Version 25.0. Armonk, NY: IBM Corp.). Review Manager (RevMan) (Version 5.3., The Cochrane Collaboration, 2014) and the Meta-Analysis of Diagnostic Accuracy (mada) package in R software (version 3.6.0, the R Foundation) were used for systematic review and meta-analysis. Statistical significance was defined as a p-value < 0.05 (two-tailed test). For each study included in the meta-analysis, sensitivity and specificity were extracted from the text (or calculated) for the detection of ccRCC. Pooled sensitivity, specificity along with 95% confidence intervals were calculated by combining data from the overall group of studies using the bivariate random-effects model [25]. The heterogeneity across the studies was explored with the Q statistic qualitatively and I2 quantitatively for the pooled estimates using DerSimonian-Laird random effect pooling method (with p<0.05 demonstrating statistically significant heterogeneity). The variations across studies caused by heterogeneity rather than by chance were estimated by calculating I2; I2 values were defined as not important(0-25%), low(25-50%), moderate(51-75%) or high(76-100%) [26]. Publication bias was assessed based on Deeks funnel plot as indicated by asymmetric appearance [27]. A summary receiver operating characteristic (sROC) curve was constructed for overall analysis. Test performance accuracy was categorized as low (AUC:0.5 to < 0.7), moderate (AUC:0.7 to < 0.9), or high (AUC:0.9-1.0) [28]. AUC of sADC and wADC were compared using the method presented by Hanley et al [29].
Results
Study Characteristics
107 studies were eligible for assessment. A total of 48 studies were included for the systematic review with 2450 patients and 2588 lesions (Figure 1). Thirteen studies focusing on the comparison between ccRCC and the other lesion of interest were used for the meta-analysis, including a sub-group analysis with 2 groups: 9 in the group using sADC (501 lesions) and 4 in the group reporting wADC (367 lesions). Another subgroup analysis was used to compare the influence of b-values on diagnostic performance, with 4 studies in the group b500-600 and 9 in the group b800.
Figure 1:
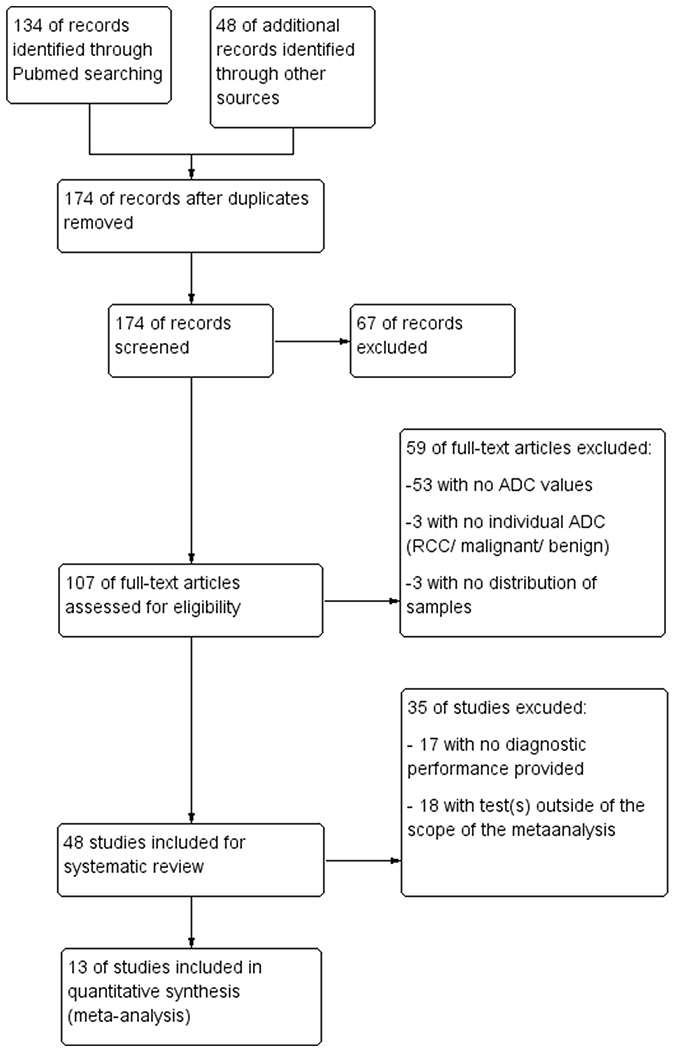
Flow diagram of studies included in the systematic review and the meta-analysis
Three studies were prospective and 10 were retrospective. Regarding technical parameters, 8 studies used 1.5T MRI and 5 studies reported a 3T scanner. Nine studies used 800 as the maximum b-value (5 used (0,800), 1 (0,250,800), 1(0,400,800) and 1 (50,400,800)). The four others used 500 or 600 (2 used (0,500), 1 used (0,600) and 1 (0,50,400,600)).
Influence of b-values on ADC
There was no statistically significant difference (p=0.08) between the ADC values of normal renal parenchyma between b-values of (0,500)-(0,600) (ADC=[2.33±0.13]×10−3 mm2/s), (0,800) (ADC=[2.10±0.19]×10−3 mm2/s) or (0,1000) (ADC=[1.95±0.20]×10−3 mm2/s) (Table 1). However, a non-significant decrease was noted as the highest b values increased (Table 1).
Table 1:
ADC values of normal renal parenchyma according to highest b-values.
| Author | Year | Highest b-value (mm2/s) | Field (T) | Number of Patients | Mean ADC of Normal renal parenchyma | STD |
|---|---|---|---|---|---|---|
| Zhang YL et al [71] | 2013 | 500 | 3 | 20 | 2.33 | 0.15 |
| Goyal A et al [31] | 2012 | 500 | 1.5 | 33 | 2.34 | 0.13 |
| Manenti G et al [72] | 2008 | 500 | 3 | 27 | 2.27 | 0.29 |
| Squillaci E et al [38] | 2004 | 500 | 1.5 | 20 | 2.23 | 0.2 |
| Zhang HM et al [33] | 2015 | 600 | 3 | 49 | 2.22 | 0.12 |
| Doganay S et al [73] | 2011 | 600 | 1.5 | 50 | 2.52 | 0.3 |
| Yano M et al [44] | 2019 | 800 | 1.5+3 | 98 | 2.17 | 0.41 |
| Mytsyk Y et al [74] | 2018 | 800 | 1.5 | 19 | 2.47 | 0.12 |
| Zhong Y et al [60] | 2017 | 800 | 1.5+3 | 48 | 2.14 | 0.16 |
| Hassassen O et al [6] | 2017 | 800 | 1.5 | 35 | 2.38 | 0.6 |
| Galmiche C et al [61] | 2017 | 800 | 3 | 42 | 2.1 | 0.28 |
| Mirka H et al [68] | 2015 | 800 | 3 | 139 | 1.83 | 0.12 |
| Choi YA et al [5] | 2014 | 800 | 3 | 77 | 2.04 | 0.32 |
| Rheinheimer S et al [75] | 2012 | 800 | 1.5 | 26 | 1.87 | 0.2 |
| Wang H et al [1] | 2010 | 800 | 3 | 83 | 2.3 | 0.17 |
| Taouli B et al [76] | 2009 | 800 | 1.5 | 64 | 2.16 | 0.37 |
| Ponhold L et al [7] | 2016 | 1000 | 3 | 39 | 1.77 | 0.17 |
| Sevcenco S et al [69] | 2014 | 1000 | 3 | 60 | 1.78 | 0.15 |
| Inci E et al [77] | 2012 | 1000 | 1.5 | 30 | 2.18 | 0.13 |
| Doganay S et al [73] | 2011 | 1000 | 1.5 | 50 | 2.16 | 0.43 |
| Kilickesmez O et al [78] | 2009 | 1000 | 1.5 | 50 | 2.08 | 0.22 |
| Summary of ADC According to Highest b-value and Field strength | ||||||
| 500-600 | 1.5 | 103 | 2.41 | 0.14 | ||
| 3 | 96 | 2.26 | 0.05 | |||
| 800 | 1.5 | 192 | 2.19 | 0.19 | ||
| 3 | 439 | 2.06 | 0.20 | |||
| 1000 | 1.5 | 100 | 2.12 | 0.06 | ||
| 3 | 99 | 1.78 | 0.01 | |||
Abbreviation: STD= standard deviation
Note: The range of the lowest b-values was [0-100], and all but 3 studies used 0 as the low b value.
Influence of Selection of Tissue Type for ROI Placement in the Systematic review
Table 2 presents ADC values of ccRCC found in the literature, classified as sADC or wADC. sADC differed significantly from wADC when we compared the ADC values of ccRCC (p=0.004): the mean value of sADC on 34 studies including 1217 lesions was [1.50±0.23]×10−3 mm2/s while the mean value of wADC on 20 studies with 670 ccRCC was [1.82±0.24]×10−3 mm2/s. Furthermore, for the other lesions of interest, sADC was always lower than wADC, except for mfAML ([1.30±0.29]×10−3 mm2/s and [1.24±0.18]×10−3 mm2/s respectively) for which values were similar.
Table 2:
Systematic review of the literature on ADC values of the 5 most renal lesions, and regarding the method of measurement between the ADC of the whole lesion (wADC) and from selected areas (sADC) without cyst and necrosis.
| Author | Ref | Type | Grade | Tumors | wADC (10−3mm2/s) | sADC (10−3mm2/s) |
|---|---|---|---|---|---|---|
| Moran K et al | [79] | ccRCC | Low | 38 | 1.58+/−0.29 | |
| ccRCC | High | 11 | 1.28+/−0.39 | |||
| Aslan A et al | [80] | ccRCC | Low | 37 | 1.95+/−0.4 | |
| ccRCC | High | 14 | 1.82+/−0.3 | |||
| Zhang H et al | [70] | ccRCC | NA | 186 | 1.15+/−0.22 | |
| Li H et al | [81] | ccRCC | NA | 113 | 1.91+/−0.42 | |
| mfAML | NA | 27 | 1.37+/−0.39 | |||
| Paschall AK et al | [4] | ccRCC | NA | 97 | 1.91+/−0.29 | |
| pRCC | NA | 29 | 1.16+/−0.34 | |||
| Onco | NA | 26 | 1.81+/−0.21 | |||
| Li A et al | [82] | ccRCC | NA | 38 | 1.77+/−0.32 | |
| pRCC | NA | 16 | 1.4+/−0.47 | |||
| chRCC | NA | 18 | 1.29+/−0.3 | |||
| mfAML | NA | 13 | 1.25+/−0.3 | |||
| Onco | NA | 7 | 1.51+/−0.34 | |||
| Mytsyk Y et al | [74] | ccRCC | NA | 55 | 1.82+/−0.32 | |
| pRCC | NA | 13 | 1.61+/−0.07 | |||
| chRCC | NA | 12 | 1.46+/−0.09 | |||
| Onco | NA | 11 | 2.26+/−0.06 | |||
| Zhong Y et al | [60] | ccRCC | NA | 10 | 1.4+/−0.22 | |
| chRCC | NA | 32 | 1.09+/−0.29 | |||
| Onco | NA | 16 | 1.59+/−0.21 | |||
| Shen L et al | [83] | ccRCC | NA | 33 | 1.75+/−0.25 | |
| Hassassen O et al | [6] | ccRCC | NA | 24 | 1.79+/−0.56 | |
| pRCC | NA | 9 | 1.03+/−0.34 | |||
| chRCC | NA | 5 | 1.19+/−0.44 | |||
| Parada VC et al | [13] | ccRCC | Low | 87 | 1.83+/−0.71 | |
| ccRCC | High | 42 | 1.31+/−0.55 | |||
| Ding Y et al | [34] | ccRCC | NA | 48 | 1.71+/−0.32 | |
| mfAML | NA | 12 | 1.1+/−0.21 | |||
| Park JJ et al | [84] | ccRCC | NA | 12 | 0.92+/−0.21 | |
| pRCC | NA | 22 | 0.82+/−0.36 | |||
| chRCC | NA | 5 | 0.87+/−0.21 | |||
| mfAML | NA | 17 | 1.16+/−0.21 | |||
| Yamamoto A et al | [30] | ccRCC | NA | 36 | 1.8+/−0.5 | |
| Ponhold L et al | [7] | ccRCC | NA | 21 | 1.27+/−0.45 | |
| pRCC | NA | 8 | 0.84+/−0.23 | |||
| chRCC | NA | 3 | 1.3+/−0.1 | |||
| Feng Q et al | [85] | ccRCC | NA | 30 | 1.12+/−0.26 | |
| mfAML | NA | 20 | 1.51+/−0.12 | |||
| Yuan Q et al | [86] | ccRCC | Low | 16 | 2.18+/−0.34 | |
| ccRCC | High | 7 | 1.99+/−0.4 | |||
| Zhang YD et al | [87] | ccRCC | Low | 33 | 2.18+/−0.47 | |
| ccRCC | High | 13 | 1.57+/−0.29 | |||
| Zhang HM et al | [33] | ccRCC | NA | 33 | 1.53+/−0.31 | |
| Mirka H et al | [68] | ccRCC | NA | 102 | 1.37+/−0.22 | |
| pRCC | NA | 14 | 1.01+/−0.41 | |||
| chRCC | NA | 8 | 1.07+/−0.23 | |||
| Onco | NA | 11 | 1.65+/−0.3 | |||
| Kierans AS et al | [88] | ccRCC | Low | 29 | 1.80+/−0.34 | |
| ccRCC | High | 33 | 1.77+/−0.29 | |||
| Mytsyk Y et al | [8] | ccRCC | Low | 5 | 2.22+/−0.4 | |
| ccRCC | High | 4 | 2.12+/−0.48 | |||
| Onco | NA | 5 | 2.75+/−0.27 | |||
| Choi YA et al | [5] | ccRCC | NA | 59 | 1.81+/−0.47 | |
| pRCC | NA | 12 | 1.29+/−0.57 | |||
| chRCC | NA | 7 | 1.55+/−0.49 | |||
| Sasamori H et al | [89] | ccRCC | NA | 20 | 1.42+/−0.27 | |
| pRCC | NA | 1 | 0.61 | |||
| mfAML | NA | 3 | 0.72+/−0.17 | |||
| Sevcenco S et al | [69] | ccRCC | NA | 29 | 1.38+/−0.57 | |
| pRCC | NA | 15 | 1.02+/−0.38 | |||
| chRCC | NA | 6 | 1.24+/−0.33 | |||
| Onco | NA | 10 | 1.6+/−0.64 | |||
| Cornelis F et al | [45] | ccRCC | NA | 57 | 1.51+/−0.57 | |
| pRCC | NA | 16 | 1+/−0.38 | |||
| chRCC | NA | 7 | 1.44+/−0.57 | |||
| mfAML | NA | 4 | 1.25+/−0.4 | |||
| Onco | NA | 16 | 1.67+/−0.51 | |||
| Maruyama M et al | [90] | ccRCC | Low | 34 | 1.65+/−0.26 | |
| ccRCC | High | 15 | 1.34+/−0.25 | |||
| Goyal A et al | [31] | ccRCC | NA | 32 | 1.62+/−0.36 | |
| pRCC | NA | 3 | 1.06+/−0.46 | |||
| chRCC | NA | 1 | 0.99 | |||
| Notohamiprodjo M et al al | [35] | ccRCC | NA | 12 | 1.45+/−0.16 | |
| pRCC | NA | 4 | 1.28+/−0.15 | |||
| Zhang YL et al | [71] | ccRCC | NA | 37 | 1.23+/−0.29 | |
| Yu X et al | [91] | ccRCC | NA | 112 | 1.47+/−0.42 | |
| pRCC | NA | 13 | 1.05+/−0.38 | |||
| chRCC | NA | 12 | 0.92+/−0.29 | |||
| Rheinheimer S et al | [75] | ccRCC | NA | 20 | 1.45+/−0.38 | |
| pRCC | NA | 1 | 1.13 | |||
| Onco | NA | 2 | 1.8+/−0.01 | |||
| Tanaka H et al | [92] | ccRCC | NA | 36 | 1.54+/−0.27 | |
| mfAML | NA | 5 | 0.8+/−0.07 | |||
| Razek AAKA et al | [93] | ccRCC | NA | 19 | 1.74+/−0.12 | |
| pRCC | NA | 6 | 1.65+/−0.26 | |||
| chRCC | NA | 8 | 1.44+/−0.11 | |||
| Onco | NA | 4 | 2.1+/−0.1 | |||
| Chandarana H et al | [32] | ccRCC | NA | 14 | 2.2+/−0.4 | |
| pRCC | NA | 4 | 1+/−0.2 | |||
| chRCC | NA | 5 | 1.9+/−0.3 | |||
| Rosenkrantz AB et al | [94] | ccRCC | Low | 31 | 1.85+/−0.4 | |
| ccRCC | High | 26 | 1.28+/−0.48 | |||
| Wang H et al | [1] | ccRCC | NA | 49 | 1.7+/−0.32 | |
| pRCC | NA | 22 | 0.88+/−0.15 | |||
| chRCC | NA | 14 | 1.14+/−0.16 | |||
| Sandrasegaran K et al | [95] | ccRCC | Low | 8 | 1.95+/−0.25 | |
| ccRCC | High | 9 | 1.77+/−0.20 | |||
| Paudyal B et al | [2] | ccRCC | NA | 25 | 1.59+/−0.55 | |
| Zhang J et al | [96] | ccRCC | NA | 10 | 2.03+/−0.1 | |
| pRCC | NA | 5 | 2.07+/−0.17 | |||
| chRCC | NA | 3 | 1.5+/−0.3 | |||
| Onco | NA | 2 | 2.16+/−0.02 | |||
| Manenti G et al | [72] | ccRCC | NA | 17 | 1.74+/−0.6 | |
| pRCC | NA | 4 | 1.81+/−0.4 | |||
| chRCC | NA | 3 | 1.74+/−0.7 | |||
| Squillaci E et al | [38] | ccRCC | NA | 9 | 1.5+/−0.8 | |
| Onco | NA | 2 | 1.71+/−0.3 | |||
| Yano M et al | [44] | pRCC | NA | 19 | 1.58+/−0.81 | |
| Doshi AM et al | [97] | pRCC 1 | NA | 21 | 1.1+/−0.37 | |
| pRCC 2 | NA | 17 | 1.21+/−0.43 | |||
| Taouli B et al | [76] | pRCC | NA | 12 | 1.12+/−0.18 | |
| Onco | NA | 6 | 1.91+/−0.97 | |||
| Galmiche C et al | [61] | chRCC | NA | 16 | 1.46+/−0.35 | |
| Onco | NA | 26 | 2.04+/−0.42 | |||
| Inci E et al* | [77] | Onco | NA | 2 | 1.61+/−0.1 | |
| Doganay S et al* | [73] | Onco | NA | 3 | 2.55+/−0.49 |
Aggregate values are reported, individual values of each histological type of lesions of interest were not given and are therefore not reported in this table
Weighted Average ADC Values of the Major Types of Renal Tumors
The lesions of interest had different mean ADC, as shown in Table 3. mfAML (101 lesions), pRCC (288 lesions) and chRCC (165 lesions) had significantly lower means ADC (for both wADC and sADC) compared to ccRCC (p-values presented in Table 3). However, the oncocytomas (149 lesions) had higher sADC values than ccRCC (p=0.02) but did not differ statistically with use of wADC (p=0.11).
Table 3:
Weighted means and standard deviations (STD) of whole lesion ADC (wADC) and selected ADC (sADC) for the five most frequent renal lesions.
| Type of lesions | Number of lesions | Global Mean (sADC+wADC) | Mean wADC | STD wADC | p-value wADC | Mean sADC | STD sADC | p-value sADC |
|---|---|---|---|---|---|---|---|---|
| ccRCC | 1887 | 1.64 | 1.82 | 0.24 | 1.50 | 0.23 | ||
| pRCC | 286 | 1.20 | 1.25 | 0.29 | 10−3 | 1.05 | 0.40 | 10−3 |
| chRCC | 165 | 1.31 | 1.41 | 0.24 | 0.01 | 1.17 | 0.33 | 10−3 |
| mfAML | 101 | 1.15 | 1.24 | 0.18 | 10−3 | 1.30 | 0.29 | 0.01 |
| Oncocytoma | 149 | 1.92 | 1.96 | 0.25 | 0.11 | 1.75 | 0.32 | 0.02 |
P-values are for comparisons (using two-tailed t-test) between wADC of ccRCC versus other lesions, and sADC of ccRCC versus other lesions
Assessment of study quality
The overall quality of the available literature was moderate (Figure 2). The patient selection was heterogeneous: some studies included only RCCs [1,5,6,30–32], one study excluded tumors larger than 4 cm [33] and one tumors smaller than 1 cm [34]. None of the included studies had risk of bias related to the reference standard as all studies used either biopsy or surgical pathology. One study did not specify the period of inclusion [35]).
Figure 2:
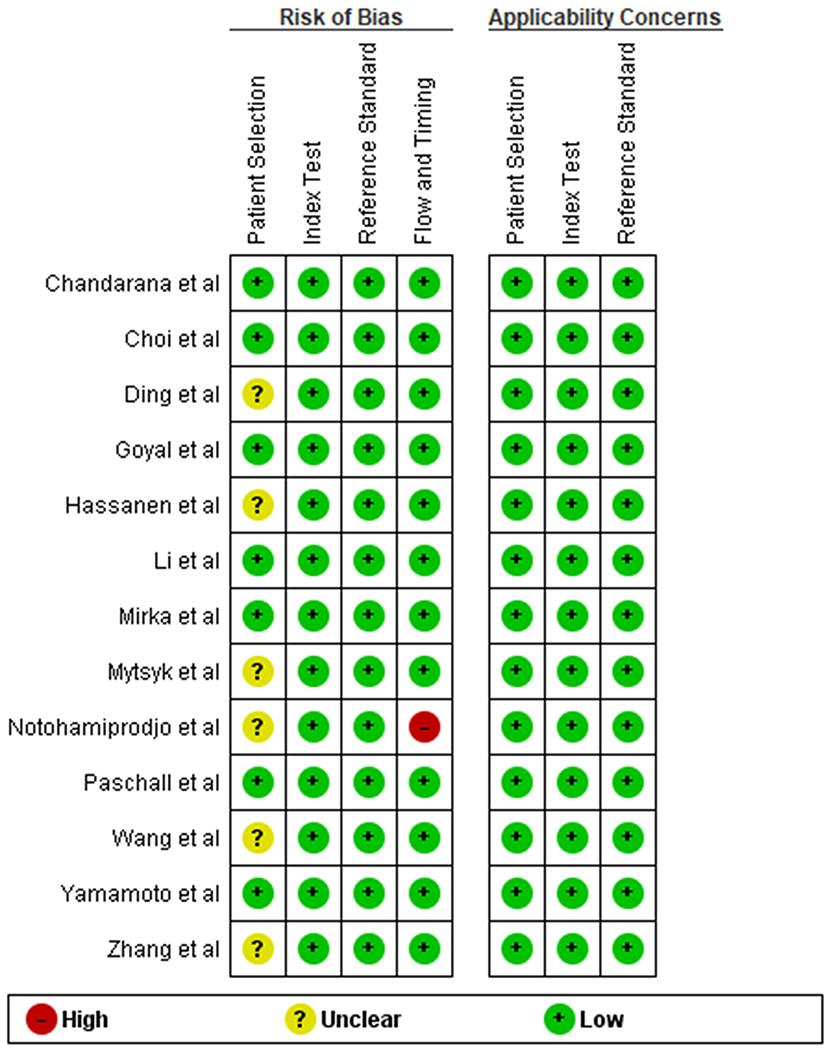
Risk of bias and applicability concerns summary: authors’ judgements about each domain for each included study
Assessment of Heterogeneity between Studies and Publication Bias
The thirteen studies included in this meta-analysis did not exhibit statistically significant heterogeneity using the Q statistic (Q=11.14; p=0.52) and I2 equal to 0%, indicating no significant heterogeneity across the studies quantitatively. Mild positive correlation was found between the sensitivity and false positive rate with ρ =0.351.
Performance of DWI for differentiation of ccRCC from other renal tumors
The forest plot (Figure 3) and the sROC curve (Figure 4) showed a range of diagnostic test characteristics but overall moderate performance of ADC in differentiation of ccRCC from other renal tumors. The global pooled sensitivity and specificity were of 0.79 (95% CI=0.72-0.85) and 0.77 (95% CI=0.70-0.83), with an area under the curve (AUC) of 0.84. The Deeks funnel plot exhibited no evidence of asymmetry (Figure 5).
Figure 3:
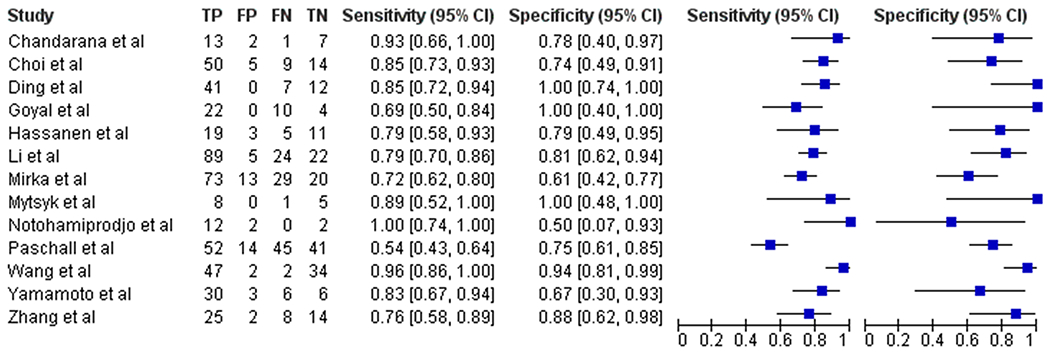
Forest plot of the studies included in the meta-analysis
Figure 4:
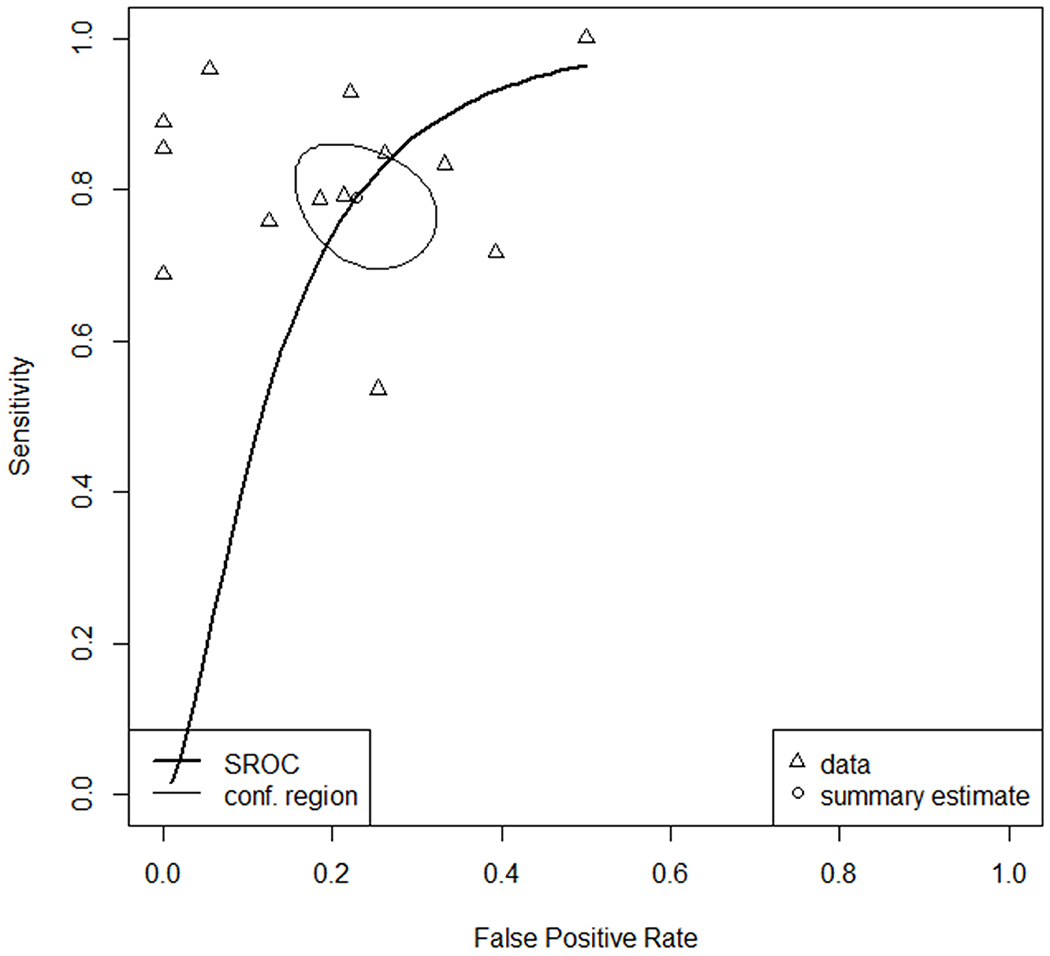
sROC curves of the analysis comparing ccRCC with other renal lesions for the 13 studies included.
Figure 5:
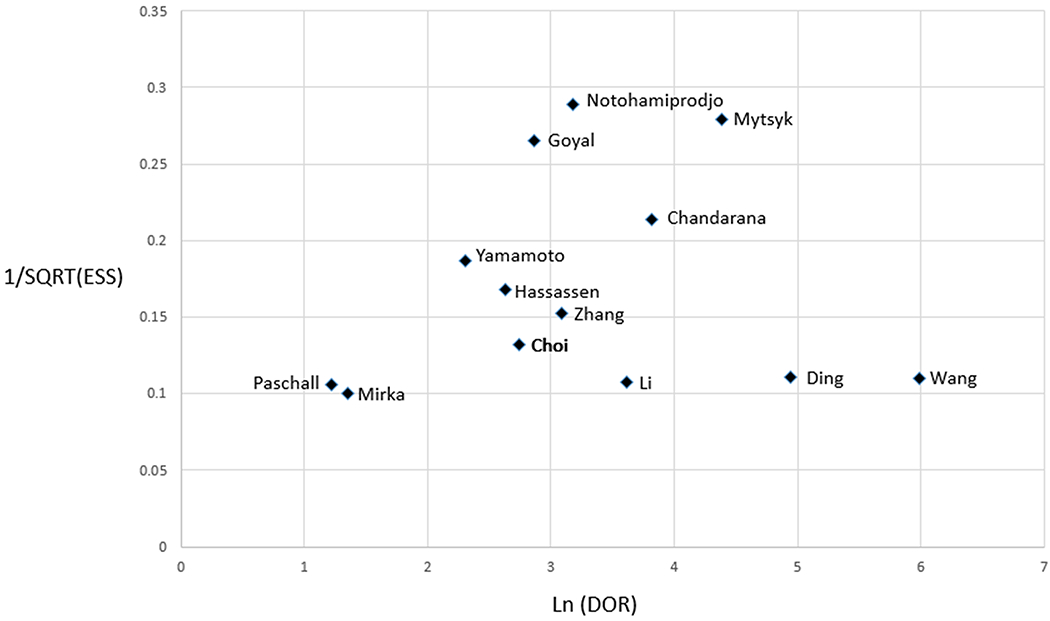
Funnel plot of the meta-analysis on differentiation of ccRCC from pRCC, chRCC, mfAML and oncocytoma
Subgroup analyses
The pooled sensitivity and specificity for the sADC group were respectively 0.80 (95% CI=0.73-0.85) and 0.78 (95% CI=0.65-0.87). For the wADC group, sensitivity and specificity were 0.77 (95% CI=0.68-0.89) and 0.77 (95% CI=0.68-0.84), respectively. AUCs differed statistically for sADC versus wADC, where sADC had an AUC of 0.852, compared with an AUC of 0.785 for wADC; p=0.02).
Sub-analysis was also performed for two groups determined by the highest b values. For the highest b value of 800, the sensitivity and specificity were 0.80 (95% CI=0.71-0.87) and 0.77 (95% CI=0.69-0.84), respectively, while for the highest b value of b500/600, sensitivity and specificity were 0.77 (95% CI=0.63-0.87) and 0.80 (95% CI=0.64-0.95), respectively. AUCs were also similar: the AUC for the b800 group was 0.845 versus 0.841 for the b500/600 group (p=0.91).
Discussion
In this meta-analysis, ADC values of specific regions of the tumor excluding cysts, necrosis, and hemorrhage differed from whole lesion ADC values, with an associated improvement in diagnostic performance for differentiation of ccRCC from other renal lesions. Meanwhile, across the three groups of highest b values (b500/600, b800,b1000), there was a non-significant ADC decrease in renal parenchyma with increasing b-values, and there was also no significant difference when comparing the AUC for detection of ccRCC across the three groups of highest b-values.
Necrotic, cystic, and hemorrhagic parts of tumors are very heterogeneous, and tend to mask ADC decrease related to cell proliferation [36]. Decrease in cell density and structural change that accompany cell death lead to reduced restriction of water diffusion in both intra and extracellular space [37]. Thus, the percentage of cystic, necrotic, or hemorrhagic component can mask the true underlying differences in tumor architecture of the solid components when compared with other solid masses, such as papillary RCC, which may also have cystic components. While conventional ccRCC usually forms homogeneous solid cell sheets, angiomyolipoma contains a collagenous interstitial stroma which reduces water diffusion velocity with lower ADC values [38].These differences in cellular architecture may be less likely to be captured if wADC technique is used; in this study, sADC of ccRCC differed significantly from oncocytoma while wADC did not.
Some studies have also described DWI techniques as heterogeneous depending on the MR system vendors or b-values [39], while other studies have reported comparable ADC between MR systems from different vendors and between different field strength [40]. This non-uniformity of ADC values within organs has been a source of concern for quantitative use of ADC with thresholds for test positivity [41]. Variability has been characterized using the same technical parameters, patients, and observer, with ADC values for healthy volunteers varying from 2-4%[42] to 7-15%[43]. We found that ADC values are not statistically different for the most commonly used b-values (maximum of 500 and 600 vs. 800 vs. 1000) on different scanner systems at different institutions. However, there was a trend of decreasing ADC values with increasing b-values. A few articles reported a relative ADC (ratio with renal parenchyma or spleen) [44–46]. In order to assess the reproducibility of ADC values more broadly, normalized ADC values may be of interest and require further study.
Prior meta-analyses have reported the diagnostic test accuracy of ADC for characterization of renal tumors [14–18]. Namely, Woo et al.[17] compared low-grade versus high-grade ccRCC, while Li et al.[15] analyzed ADC values of benign and malignant lesions. However, these studies and others did not consider the variability of the technique used to measure ADC. These prior studies also have not evaluated the performance of ADC for identification of ccRCC among tumor subtypes.
Clear cell RCC is the most common renal malignancy subtype [10,11,47], and its prognosis differs from others benign and malignant tumors, including pRCC, chRCC, mfAML and oncocytomas [48–53], as it accounts for most cases of metastatic disease [54]. MRI may serve as a valuable tool for noninvasively differentiating among some lesion types [55]. Studies have described the interest of multiple sequences to characterize renal lesions, including dynamic contrast-enhanced imaging and DWI [56,57]. We found that ADC values, whether obtained using solid components only or the whole lesion, provided moderate pooled sensitivity and specificity for identification of ccRCC and may be insufficient to rely upon as a single parameter or test for non-contrast lesion subtyping.
Still, DWI is as an ancillary clinical finding for renal mass assessment, and our analysis of the literature shows that solid regions of the tumors are favorable for use in multi-parametric prediction models, and that ADC values of ccRCC appear to differ from other types of renal cortical tumors, while these other types (pRCC, chRCC and mfAML) fall within a range of overlapping values. Oncocytomas exhibited statistically higher sADC values compared to ccRCC. The difference between chRCC and oncocytoma is striking given that they have both been depicted as oncocytic tumors [58]. Histologically, they both arise from intercalated cells of the collecting ducts and immunohistochemistry can be helpful for the differential diagnosis [59]. Previous studies focusing on the comparison of these lesions reported an ability of ADC to differentiate oncocytoma from chromophobes [60,61]. This difference could be explained by the fact that renal oncocytomas usually exhibit a hyalinized hypocellular stroma [62–64], with therefore higher ADC values compared to chRCC.
Multiphasic MRI parameters have also previously shown ability to discriminate among RCC subtypes. For example, the ratio of the percentage change in signal intensity from pre- to post-contrast imaging in the corticomedullary phase between the lesion and cortex differentiated ccRCC from other renal lesions with AUC of 0.87, using a threshold of 0.89, as reported by Young et al [65,66]. The combined performance of multiphasic MRI parameters inclusive of DWI requires further evaluation, as studies of the added value of each parameter are unavailable. Notably, one of the limiting factors in studies of multi-parametric MRI characterization of renal masses has been the inability to decide how to measure lesion ADC and whether ADC values from differing imaging techniques could be applied with the same threshold [67].
The retrospective nature of the included studies was one of the limitations of this work. There were small numbers of studies reporting the sensitivity and specificity of ADC values for separation of ccRCC from oncocytoma (4 studies) and mfAML (3 studies). The lack of such reported information may reflect reporting bias (against negative findings) or a lack of basis for hypothesizing that DWI could distinguish oncocytoma or mfAML from RCC when other conventional imaging features have been overall insufficient. Additional and/or larger studies may be helpful to define the performance of ADC in separating these lesions from other types of renal tumors. Another limitation for clinical applicability would be the potential variability of sADC measurement techniques with some degree of operator dependence. The inclusion of only the most common renal cortical tumor subtypes on the part of the literature may also be a limitation. Other renal lesions may occasionally be encountered in clinical practice where ccRCC is in the differential diagnosis, including urothelial carcinomas or rare subtypes of renal cell carcinoma [68–70].
In conclusion, sADC offers significantly better accuracy overall than wADC for identification of ccRCC among other renal tumor subtypes, including better differentiation of ccRCC from oncocytoma. Though sADC values still provide moderate accuracy for identification of ccRCC despite improved performance compared with wADC, exclusion of cysts/necrosis from ADC measurements should be preferred in clinical practice and for future evaluation of multi-parametric evaluation or other predictive modeling for renal tumor characterization.
Table 4:
Characteristics of Studies Included in Meta-analysis
| First Author | b-value | ADC | Lesions (Total N) | ccRCC (N) | Other (N) | Type of comparator | Cutoff | Se | Spe |
|---|---|---|---|---|---|---|---|---|---|
| Ding Y et al [34] | 0,800 | sADC | 83 | 48 | 35 | mfAML | >1.39 | 0.85 | 1 |
| Goyal A et al [31] | 0,500 | sADC | 36 | 32 | 4 | pRCC, chRCC | >1.49 | 0.69 | 1 |
| Hassassen et al [6] | 0,800 | sADC | 38 | 24 | 14 | pRCC, chRCC | >1.31 | 0.79 | 0.79 |
| Mirka H et al [68] | 50,400, 800 | sADC | 135 | 102 | 33 | pRCC, chRCC, oncocytoma | [1.1-1.59] | 0.72 | 0.61 |
| Notohamiprodjo M et al [35] | 0,500 | sADC | 16 | 12 | 4 | pRCC | >1.1 | 1 | 0.5 |
| Wang H et al [1] | 0,800 | sADC | 85 | 49 | 36 | pRCC, chRCC | >1.28 | 0.96 | 0.94 |
| Yamamoto A et al [30] | 0,800 | sADC | 45 | 36 | 9 | pRCC, chRCC | >1.2 | 0.91 | 0.5 |
| Zhang HM et al [33] | 0,50, 400,600 | sADC | 49 | 33 | 16 | mfAML, oncocytoma | >1.36 | 0.76 | 0.88 |
| Mytsyk Y et al [8] | 0,600 | sADC | 14 | 9 | 5 | oncocytoma | <1.59 | 0.89 | 1 |
| Li H et al [81] | 0,800 | wADC | 140 | 113 | 27 | mfAML | >2.19 | 0.79 | 0.82 |
| Paschall AK et al [4] | 0,250, 800 | wADC | 126 | 97 | 55 | pRCC, oncocytoma | [1.67-3.5] | 0.54 | 0.74 |
| Choi YA et al [5] | 0,800 | wADC | 78 | 59 | 19 | pRCC, chRCC | >1.4 | 0.85 | 0.73 |
| Chandarana H et al [32] | 0,400, 800 | wADC | 23 | 14 | 9 | pRCC, chRCC | >1.85 | 0.93 | 0.78 |
Key Points.
Selective ADC of renal tumors, excluding cystic and necrotic areas, provides better discriminatory ability than whole lesion ADC to differentiate clear cell RCC from other renal lesions, with area under the receiver operating characteristic curve (AUC) of 0.852 vs. 0.785, respectively (p=0.02).
Selective ADC of renal masses provides moderate sensitivity and specificity of 80% and 78%, respectively, for differentiation of clear cell renal cell carcinoma (RCC) from papillary RCC, chromophobe RCC, oncocytoma, and minimal-fat angiomyolipoma.
Selective ADC excluding cystic and necrotic areas are preferable to whole lesion ADC as an additional tool to multiphasic MRI to differentiate clear cell RCC from other renal lesions whether the highest b-value is 800 or 1000.
Acknowledgements:
We acknowledge Dr Mirka, Dr Mytsyk and Dr Cornelis for their help. Agence Regionale de Santé (ARS Ile de France; Mickael Tordjman) is also acknowledged as sources of funding. Dr. Kang is supported by Award Number K07CA197134 from the National Cancer Institute (P.I. Stella Kang, MD, MSc). The content is solely the responsibility of the authors and does not necessarily represent the official views of the National Cancer Institute or the National Institutes of Health.
Abbreviations:
- DWI
Diffusion Weighted Imaging
- ADC
Apparent Diffusion Coefficient
- ccRCC
Clear cell renal cell carcinoma
- pRCC
Papillary renal cell carcinoma
- chRCC
Chromophobe renal cell carcinoma
- mfAML
Minimal-fat angiomyolipoma
- wADC
ADC of the whole lesion
- sADC
ADC of selected region of the tumor (excluding cystic, hemorrhagic and necrotic areas)
References:
- 1.Wang H, Cheng L, Zhang X, et al. (2010) Renal cell carcinoma: diffusion-weighted MR imaging for subtype differentiation at 3.0 T. Radiology 257:135–143. 10.1148/radiol.10092396 [DOI] [PubMed] [Google Scholar]
- 2.Paudyal B, Paudyal P, Tsushima Y, et al. (2010) The role of the ADC value in the characterisation of renal carcinoma by diffusion-weighted MRI. Br J Radiol 83:336–343. 10.1259/bjr/74949757 [DOI] [PMC free article] [PubMed] [Google Scholar]
- 3.Li H, Liu L, Ding L, et al. (2018) Quantitative Assessment of Bladder Cancer Reflects Grade and Recurrence: Comparing of Three Methods of Positioning Region of Interest for ADC Measurements at Diffusion-weighted MR Imaging. Acad Radiol. 10.1016/j.acra.2018.10.016 [DOI] [PubMed] [Google Scholar]
- 4.Paschall AK, Mirmomen SM, Symons R, et al. (2018) Differentiating papillary type I RCC from clear cell RCC and oncocytoma: application of whole-lesion volumetric ADC measurement. Abdom Radiol (NY) 43:2424–2430. 10.1007/s00261-017-1453-4 [DOI] [PMC free article] [PubMed] [Google Scholar]
- 5.Choi YA, Kim CK, Park SY, et al. (2014) Subtype differentiation of renal cell carcinoma using diffusion-weighted and blood oxygenation level-dependent MRI. AJR Am J Roentgenol 203:W78–84. 10.2214/AJR.13.11551 [DOI] [PubMed] [Google Scholar]
- 6.Hassanen O, Ghieda U, Eltomey MA (2017) Contrast enhanced MRI and Diffusion Weighted Imaging (DWI) in the evaluation of renal cell carcinoma and differentiation of its subtypes. The Egyptian Journal of Radiology and Nuclear Medicine 48:1117–1123. 10.1016/j.ejrnm.2017.03.024 [DOI] [Google Scholar]
- 7.Ponhold L, Javor D, Heinz-Peer G, et al. (2016) Inter-observer variation and diagnostic efficacy of apparent diffusion coefficient (ADC) measurements obtained by diffusion-weighted imaging (DWI) in small renal masses. Acta Radiol 57:1014–1020. 10.1177/0284185115610934 [DOI] [PubMed] [Google Scholar]
- 8.Mytsyk Y, Borys Y, Komnatska I, et al. (2014) Value of the diffusion-weighted MRI in the differential diagnostics of malignant and benign kidney neoplasms - our clinical experience. Pol J Radiol 79:290–295. 10.12659/PJR.890604 [DOI] [PMC free article] [PubMed] [Google Scholar]
- 9.Cheville JC, Lohse CM, Zincke H, et al. (2003) Comparisons of outcome and prognostic features among histologic subtypes of renal cell carcinoma. Am J Surg Pathol 27:612–624 [DOI] [PubMed] [Google Scholar]
- 10.Libertino JA (2013) Renal Cancer: Contemporary Management. Springer Science & Business Media [Google Scholar]
- 11.Jonasch E, Gao J, Rathmell WK (2014) Renal cell carcinoma. BMJ 349:. 10.1136/bmj.g4797 [DOI] [PMC free article] [PubMed] [Google Scholar]
- 12.Zhang J, Lefkowitz RA, Bach A (2007) Imaging of Kidney Cancer. Radiologic Clinics of North America 45:119–147. 10.1016/j.rcl.2006.10.011 [DOI] [PubMed] [Google Scholar]
- 13.Parada Villavicencio C, Mc Carthy RJ, Miller FH (2017) Can diffusion-weighted magnetic resonance imaging of clear cell renal carcinoma predict low from high nuclear grade tumors. Abdom Radiol (NY) 42:1241–1249. 10.1007/s00261-016-0981-7 [DOI] [PubMed] [Google Scholar]
- 14.Lassel EA, Rao R, Schwenke C, et al. (2014) Diffusion-weighted imaging of focal renal lesions: a meta-analysis. Eur Radiol 24:241–249. 10.1007/s00330-013-3004-x [DOI] [PubMed] [Google Scholar]
- 15.Li Y, Wang Y, Qin J, et al. (2018) Meta-analysis of diffusion-weighted imaging in the differential diagnosis of renal lesions. Clin Imaging 52:264–272. 10.1016/j.clinimag.2018.08.010 [DOI] [PubMed] [Google Scholar]
- 16.Kang SK, Zhang A, Pandharipande PV, et al. (2015) DWI for Renal Mass Characterization: Systematic Review and Meta-Analysis of Diagnostic Test Performance. AJR Am J Roentgenol 205:317–324. 10.2214/AJR.14.13930 [DOI] [PubMed] [Google Scholar]
- 17.Woo S, Suh CH, Kim SY, et al. (2017) Diagnostic Performance of DWI for Differentiating High- From Low-Grade Clear Cell Renal Cell Carcinoma: A Systematic Review and Meta-Analysis. AJR Am J Roentgenol 209:W374–W381. 10.2214/AJR.17.18283 [DOI] [PubMed] [Google Scholar]
- 18.Chiarello MA, Mali RD, Kang SK (2018) Diagnostic Accuracy of MRI for Detection of Papillary Renal Cell Carcinoma: A Systematic Review and Meta-Analysis. American Journal of Roentgenology 211:812–821. 10.2214/AJR.17.19462 [DOI] [PMC free article] [PubMed] [Google Scholar]
- 19.McInnes MDF, Moher D, Thombs BD, et al. (2018) Preferred Reporting Items for a Systematic Review and Meta-analysis of Diagnostic Test Accuracy Studies: The PRISMA-DTA Statement. JAMA 319:388–396. 10.1001/jama.2017.19163 [DOI] [PubMed] [Google Scholar]
- 20.Higgins JPT, Green S Cochrane Handbook for Systematic Reviews of Interventions Version 5.1.0 [updated March 2011]. The Cochrane Collaboration, 2011. Available from http://handbook.cochrane.org. [Google Scholar]
- 21.McGowan J, Sampson M, Salzwedel DM, et al. (2016) PRESS Peer Review of Electronic Search Strategies: 2015 Guideline Statement. J Clin Epidemiol 75:40–46. 10.1016/j.jclinepi.2016.01.021 [DOI] [PubMed] [Google Scholar]
- 22.Whiting PF, Rutjes AWS, Westwood ME, et al. (2011) QUADAS-2: a revised tool for the quality assessment of diagnostic accuracy studies. Ann Intern Med 155:529–536. 10.7326/0003-4819-155-8-201110180-00009 [DOI] [PubMed] [Google Scholar]
- 23.Fisher RA (1919) XV.—The Correlation between Relatives on the Supposition of Mendelian Inheritance. Earth and Environmental Science Transactions of The Royal Society of Edinburgh 52:399–433. 10.1017/S0080456800012163 [DOI] [Google Scholar]
- 24.Student (1908) The Probable Error of a Mean. Biometrika 6:1–25. 10.2307/2331554 [DOI] [Google Scholar]
- 25.Reitsma JB, Glas AS, Rutjes AWS, et al. (2005) Bivariate analysis of sensitivity and specificity produces informative summary measures in diagnostic reviews. J Clin Epidemiol 58:982–990. 10.1016/j.jclinepi.2005.02.022 [DOI] [PubMed] [Google Scholar]
- 26.Higgins JPT, Thompson SG, Deeks JJ, Altman DG (2003) Measuring inconsistency in meta-analyses. BMJ 327:557–560. 10.1136/bmj.327.7414.557 [DOI] [PMC free article] [PubMed] [Google Scholar]
- 27.Deeks JJ, Macaskill P, Irwig L (2005) The performance of tests of publication bias and other sample size effects in systematic reviews of diagnostic test accuracy was assessed. J Clin Epidemiol 58:882–893. 10.1016/j.jclinepi.2005.01.016 [DOI] [PubMed] [Google Scholar]
- 28.Swets JA (1988) Measuring the accuracy of diagnostic systems. Science 240:1285–1293. 10.1126/science.3287615 [DOI] [PubMed] [Google Scholar]
- 29.Hanley JA, McNeil BJ (1982) The meaning and use of the area under a receiver operating characteristic (ROC) curve. Radiology 143:29–36. 10.1148/radiology.143.1.7063747 [DOI] [PubMed] [Google Scholar]
- 30.Yamamoto A, Tamada T, Ito K, et al. (2017) Differentiation of subtypes of renal cell carcinoma: dynamic contrast-enhanced magnetic resonance imaging versus diffusion-weighted magnetic resonance imaging. Clin Imaging 41:53–58. 10.1016/j.clinimag.2016.10.001 [DOI] [PubMed] [Google Scholar]
- 31.Goyal A, Sharma R, Bhalla AS, et al. (2012) Diffusion-weighted MRI in renal cell carcinoma: a surrogate marker for predicting nuclear grade and histological subtype. Acta Radiol 53:349–358. 10.1258/ar.2011.110415 [DOI] [PubMed] [Google Scholar]
- 32.Chandarana H, Kang SK, Wong S, et al. (2012) Diffusion-weighted intravoxel incoherent motion imaging of renal tumors with histopathologic correlation. Invest Radiol 47:688–696. 10.1097/RLI.0b013e31826a0a49 [DOI] [PubMed] [Google Scholar]
- 33.Zhang H- M, Wu Y- H, Gan Q, et al. (2015) Diagnostic Utility of Diffusion-weighted Magnetic Resonance Imaging in Differentiating Small Solid Renal Tumors (≤ 4 cm) at 3.0T Magnetic Resonance Imaging. Chin Med J 128:1444–1449. 10.4103/0366-6999.157648 [DOI] [PMC free article] [PubMed] [Google Scholar]
- 34.Ding Y, Zeng M, Rao S, et al. (2016) Comparison of Biexponential and Monoexponential Model of Diffusion-Weighted Imaging for Distinguishing between Common Renal Cell Carcinoma and Fat Poor Angiomyolipoma. Korean J Radiol 17:853–863. 10.3348/kjr.2016.17.6.853 [DOI] [PMC free article] [PubMed] [Google Scholar]
- 35.Notohamiprodjo M, Staehler M, Steiner N, et al. (2013) Combined Diffusion-Weighted, Blood Oxygen Level–Dependent, and Dynamic Contrast-Enhanced MRI for Characterization and Differentiation of Renal Cell Carcinoma. Academic Radiology 20:685–693. 10.1016/j.acra.2013.01.015 [DOI] [PubMed] [Google Scholar]
- 36.Le Bihan D (2013) Apparent Diffusion Coefficient and Beyond: What Diffusion MR Imaging Can Tell Us about Tissue Structure. Radiology 268:318–322. 10.1148/radiol.13130420 [DOI] [PubMed] [Google Scholar]
- 37.Tourell MC, Shokoohmand A, Landgraf M, et al. (2017) The distribution of the apparent diffusion coefficient as an indicator of the response to chemotherapeutics in ovarian tumour xenografts. Scientific Reports 7:42905 10.1038/srep42905 [DOI] [PMC free article] [PubMed] [Google Scholar]
- 38.Squillaci E, Manenti G, Cova M, et al. (2004) Correlation of diffusion-weighted MR imaging with cellularity of renal tumours. Anticancer Res 24:4175–4179 [PubMed] [Google Scholar]
- 39.Jafar MM, Parsai A, Miquel ME (2016) Diffusion-weighted magnetic resonance imaging in cancer: Reported apparent diffusion coefficients, in-vitro and in-vivo reproducibility. World J Radiol 8:21–49. 10.4329/wjr.v8.i1.21 [DOI] [PMC free article] [PubMed] [Google Scholar]
- 40.Donati OF, Chong D, Nanz D, et al. (2013) Diffusion-weighted MR Imaging of Upper Abdominal Organs: Field Strength and Intervendor Variability of Apparent Diffusion Coefficients. Radiology 270:454–463. 10.1148/radiol.13130819 [DOI] [PubMed] [Google Scholar]
- 41.Schmeel FC (2019) Variability in quantitative diffusion-weighted MR imaging (DWI) across different scanners and imaging sites: is there a potential consensus that can help reducing the limits of expected bias? Eur Radiol 29:2243–2245. 10.1007/s00330-018-5866-4 [DOI] [PubMed] [Google Scholar]
- 42.Winfield JM, Collins DJ, Priest AN, et al. (2016) A framework for optimization of diffusion-weighted MRI protocols for large field-of-view abdominal-pelvic imaging in multicenter studies. Medical Physics 43:95–110. 10.1118/1.4937789 [DOI] [PubMed] [Google Scholar]
- 43.Bilgili MYK (2012) Reproductibility of apparent diffusion coefficients measurements in diffusion-weighted MRI of the abdomen with different b values. European Journal of Radiology 81:2066–2068. 10.1016/j.ejrad.2011.06.045 [DOI] [PubMed] [Google Scholar]
- 44.Yano M, Fowler KJ, Srisuwan S, et al. (2018) Quantitative multiparametric MR analysis of small renal lesions: correlation with surgical pathology. Abdom Radiol (NY) 43:3390–3399. 10.1007/s00261-018-1612-2 [DOI] [PubMed] [Google Scholar]
- 45.Cornelis F, Tricaud E, Lasserre AS, et al. (2014) Routinely performed multiparametric magnetic resonance imaging helps to differentiate common subtypes of renal tumours. Eur Radiol 24:1068–1080. 10.1007/s00330-014-3107-z [DOI] [PubMed] [Google Scholar]
- 46.Kim BR, Song JS, Choi EJ, et al. (2018) Diffusion-Weighted Imaging of Upper Abdominal Organs Acquired with Multiple B-Value Combinations: Value of Normalization Using Spleen as the Reference Organ. Korean J Radiol 19:389–396. 10.3348/kjr.2018.19.3.389 [DOI] [PMC free article] [PubMed] [Google Scholar]
- 47.Eble JN, Weltgesundheitsorganisation, International Agency for Research on Cancer (2006) Pathology and genetics of tumours of the urinary system and male genital organs: ... editorial and consensus conference in Lyon, France, December 14 – 18, 2002, Reprint. IARC Press, Lyon [Google Scholar]
- 48.Jiang H- M, Wei J- H, Zhang Z- L, et al. (2016) Does chromophobe renal cell carcinoma have better survival than clear cell renal cell carcinoma? A clinical-based cohort study and meta-analysis. Int Urol Nephrol 48:191–199. 10.1007/s11255-015-1161-3 [DOI] [PubMed] [Google Scholar]
- 49.Wagener N, Edelmann D, Benner A, et al. (2017) Outcome of papillary versus clear cell renal cell carcinoma varies significantly in non-metastatic disease. PLoS ONE 12:e0184173 10.1371/journal.pone.0184173 [DOI] [PMC free article] [PubMed] [Google Scholar]
- 50.Zimpfer A, Glass Ä, Zettl H, et al. (2019) Histopathologische Diagnose und Prognose des Nierenzellkarzinoms im Kontext der WHO-Klassifikation 2016. Urologe. 10.1007/s00120-019-0952-z [DOI] [PubMed] [Google Scholar]
- 51.Capitanio U, Bensalah K, Bex A, et al. (2019) Epidemiology of Renal Cell Carcinoma. European Urology 75:74–84. 10.1016/j.eururo.2018.08.036 [DOI] [PMC free article] [PubMed] [Google Scholar]
- 52.Keegan KA, Schupp CW, Chamie K, et al. (2012) Histopathology of surgically treated renal cell carcinoma: survival differences by subtype and stage. J Urol 188:391–397. 10.1016/j.juro.2012.04.006 [DOI] [PMC free article] [PubMed] [Google Scholar]
- 53.Leibovich BC, Lohse CM, Crispen PL, et al. (2010) Histological subtype is an independent predictor of outcome for patients with renal cell carcinoma. J Urol 183:1309–1315. 10.1016/j.juro.2009.12.035 [DOI] [PubMed] [Google Scholar]
- 54.Daugherty M, Sedaghatpour D, Shapiro O, et al. (2017) The metastatic potential of renal tumors: Influence of histologic subtypes on definition of small renal masses, risk stratification, and future active surveillance protocols. Urol Oncol 35:153.e15–153.e20. 10.1016/j.urolonc.2016.11.009 [DOI] [PubMed] [Google Scholar]
- 55.Kang SK, Chandarana H (2012) Contemporary imaging of the renal mass. Urol Clin North Am 39:161–170, vi 10.1016/j.ucl.2012.01.002 [DOI] [PubMed] [Google Scholar]
- 56.Hötker AM, Mazaheri Y, Wibmer A, et al. (2017) Differentiation of Clear Cell Renal Cell Carcinoma From Other Renal Cortical Tumors by Use of a Quantitative Multiparametric MRI Approach. AJR Am J Roentgenol 208:W85–W91. 10.2214/AJR.16.16652 [DOI] [PMC free article] [PubMed] [Google Scholar]
- 57.Wang H- Y, Su Z- H, Xu X, et al. (2017) Dynamic Contrast-enhanced MRI in Renal Tumors: Common Subtype Differentiation using Pharmacokinetics. Sci Rep 7:3117 10.1038/s41598-017-03376-7 [DOI] [PMC free article] [PubMed] [Google Scholar]
- 58.Abrahams NA, Tamboli P (2005) Oncocytic Renal Neoplasms: Diagnostic Considerations. Clinics in Laboratory Medicine 25:317–339. 10.1016/j.cll.2005.01.006 [DOI] [PubMed] [Google Scholar]
- 59.Ng KL, Morais C, Bernard A, et al. (2016) A systematic review and meta-analysis of immunohistochemical biomarkers that differentiate chromophobe renal cell carcinoma from renal oncocytoma. Journal of Clinical Pathology 69:661–671. 10.1136/jclinpath-2015-203585 [DOI] [PubMed] [Google Scholar]
- 60.Zhong Y, Wang H, Shen Y, et al. (2017) Diffusion-weighted imaging versus contrast-enhanced MR imaging for the differentiation of renal oncocytomas and chromophobe renal cell carcinomas. Eur Radiol 27:4913–4922. 10.1007/s00330-017-4906-9 [DOI] [PubMed] [Google Scholar]
- 61.Galmiche C, Bernhard J- C, Yacoub M, et al. (2017) Is Multiparametric MRI Useful for Differentiating Oncocytomas From Chromophobe Renal Cell Carcinomas? AJR Am J Roentgenol 208:343–350. 10.2214/AJR.16.16832 [DOI] [PubMed] [Google Scholar]
- 62.Krishnan B, Truong LD (2002) Renal epithelial neoplasms: The diagnostic implications of electron microscopic study in 55 cases. Human Pathology 33:68–79. 10.1053/hupa.2002.30210 [DOI] [PubMed] [Google Scholar]
- 63.Perez-Ordonez B, Hamed G, Campbell S, et al. (1997) Renal oncocytoma: a clinicopathologic study of 70 cases. Am J Surg Pathol 21:871–883 [DOI] [PubMed] [Google Scholar]
- 64.Patel HD, Druskin SC, Rowe SP, et al. (2017) Surgical histopathology for suspected oncocytoma on renal mass biopsy: a systematic review and meta-analysis. BJU International 119:661–666. 10.1111/bju.13763 [DOI] [PubMed] [Google Scholar]
- 65.Vargas HA, Chaim J, Lefkowitz RA, et al. (2012) Renal cortical tumors: use of multiphasic contrast-enhanced MR imaging to differentiate benign and malignant histologic subtypes. Radiology 264:779–788. 10.1148/radiol.12110746 [DOI] [PMC free article] [PubMed] [Google Scholar]
- 66.Young JR, Coy H, Kim HJ, et al. (2017) Performance of Relative Enhancement on Multiphasic MRI for the Differentiation of Clear Cell Renal Cell Carcinoma (RCC) From Papillary and Chromophobe RCC Subtypes and Oncocytoma. AJR Am J Roentgenol 208:812–819. 10.2214/AJR.16.17152 [DOI] [PubMed] [Google Scholar]
- 67.Canvasser NE, Kay FU, Xi Y, et al. (2017) Diagnostic Accuracy of Multiparametric Magnetic Resonance Imaging to Identify Clear Cell Renal Cell Carcinoma in cT1a Renal Masses. J Urol 198:780–786. 10.1016/j.juro.2017.04.089 [DOI] [PMC free article] [PubMed] [Google Scholar]
- 68.Mirka H, Korcakova E, Kastner J, et al. (2015) Diffusion-weighted Imaging Using 3.0 T MRI as a Possible Biomarker of Renal Tumors. Anticancer Res 35:2351–2357 [PubMed] [Google Scholar]
- 69.Sevcenco S, Heinz-Peer G, Ponhold L, et al. (2014) Utility and limitations of 3-Tesla diffusion-weighted magnetic resonance imaging for differentiation of renal tumors. European Journal of Radiology 83:909–913. 10.1016/j.ejrad.2014.02.026 [DOI] [PubMed] [Google Scholar]
- 70.Zhang H, Pan J, Shen Y, et al. (2019) High signal renal tumors on DWI: the diagnostic value of morphological characteristics. Abdom Radiol 44:239–246. 10.1007/s00261-018-1728-4 [DOI] [PubMed] [Google Scholar]
- 71.Zhang Y- L, Yu B- L, Ren J, et al. (2013) EADC Values in Diagnosis of Renal Lesions by 3.0 T Diffusion-Weighted Magnetic Resonance Imaging: Compared with the ADC Values. Appl Magn Reson 44:349–363. 10.1007/s00723-012-0376-z [DOI] [PMC free article] [PubMed] [Google Scholar]
- 72.Manenti G, Di Roma M, Mancino S, et al. (2008) Malignant renal neoplasms: correlation between ADC values and cellularity in diffusion weighted magnetic resonance imaging at 3 T. Radiol Med 113:199–213. 10.1007/s11547-008-0246-9 [DOI] [PubMed] [Google Scholar]
- 73.Doğanay S, Kocakoç E, Ciçekçi M, et al. (2011) Ability and utility of diffusion-weighted MRI with different b values in the evaluation of benign and malignant renal lesions. Clin Radiol 66:420–425. 10.1016/j.crad.2010.11.013 [DOI] [PubMed] [Google Scholar]
- 74.Mytsyk Y, Dutka I, Yuriy B, et al. (2018) Differential diagnosis of the small renal masses: role of the apparent diffusion coefficient of the diffusion-weighted MRI. Int Urol Nephrol 50:197–204. 10.1007/s11255-017-1761-1 [DOI] [PubMed] [Google Scholar]
- 75.Rheinheimer S, Stieltjes B, Schneider F, et al. (2012) Investigation of renal lesions by diffusion-weighted magnetic resonance imaging applying intravoxel incoherent motion-derived parameters--initial experience. Eur J Radiol 81:e310–316. 10.1016/j.ejrad.2011.10.016 [DOI] [PubMed] [Google Scholar]
- 76.Taouli B, Thakur RK, Mannelli L, et al. (2009) Renal Lesions: Characterization with Diffusion-weighted Imaging versus Contrast-enhanced MR Imaging. Radiology 251:398–407. 10.1148/radiol.2512080880 [DOI] [PubMed] [Google Scholar]
- 77.Inci E, Hocaoglu E, Aydin S, Cimilli T (2012) Diffusion-weighted magnetic resonance imaging in evaluation of primary solid and cystic renal masses using the Bosniak classification. Eur J Radiol 81:815–820. 10.1016/j.ejrad.2011.02.024 [DOI] [PubMed] [Google Scholar]
- 78.Kilickesmez O, Inci E, Atilla S, et al. (2009) Diffusion-weighted imaging of the renal and adrenal lesions. J Comput Assist Tomogr 33:828–833. 10.1097/RCT.0b013e31819f1b83 [DOI] [PubMed] [Google Scholar]
- 79.Moran K, Abreu-Gomez J, Krishna S, et al. (2019) Can MRI be used to diagnose histologic grade in T1a (< 4 cm) clear cell renal cell carcinomas? Abdom Radiol (NY). 10.1007/s00261-019-02018-y [DOI] [PubMed] [Google Scholar]
- 80.Aslan A, İnan İ, Aktan A, et al. (2018) The utility of ADC measurement techniques for differentiation of low- and high-grade clear cell RCC. Pol J Radiol 83:e446–e451. 10.5114/pjr.2018.80207 [DOI] [PMC free article] [PubMed] [Google Scholar]
- 81.Li H, Li A, Zhu H, et al. (2019) Whole-Tumor Quantitative Apparent Diffusion Coefficient Histogram and Texture Analysis to Differentiation of Minimal Fat Angiomyolipoma from Clear Cell Renal Cell Carcinoma. Academic Radiology 26:632–639. 10.1016/j.acra.2018.06.015 [DOI] [PubMed] [Google Scholar]
- 82.Li A, Xing W, Li H, et al. (2018) Subtype Differentiation of Small (≤ 4 cm) Solid Renal Mass Using Volumetric Histogram Analysis of DWI at 3-T MRI. AJR Am J Roentgenol 211:614–623. 10.2214/AJR.17.19278 [DOI] [PubMed] [Google Scholar]
- 83.Shen L, Zhou L, Liu X, Yang X (2017) Comparison of biexponential and monoexponential DWI in evaluation of Fuhrman grading of clear cell renal cell carcinoma. Diagn Interv Radiol 23:100–105. 10.5152/dir.2016.15519 [DOI] [PMC free article] [PubMed] [Google Scholar]
- 84.Park JJ, Kim CK (2017) Small (< 4 cm) Renal Tumors With Predominantly Low Signal Intensity on T2-Weighted Images: Differentiation of Minimal-Fat Angiomyolipoma From Renal Cell Carcinoma. AJR Am J Roentgenol 208:124–130. 10.2214/AJR.16.16102 [DOI] [PubMed] [Google Scholar]
- 85.Feng Q, Ma Z, Zhang S, Wu J (2016) Usefulness of diffusion tensor imaging for the differentiation between low-fat angiomyolipoma and clear cell carcinoma of the kidney. Springerplus 5:12 10.1186/s40064-015-1627-x [DOI] [PMC free article] [PubMed] [Google Scholar]
- 86.Yuan Q, Kapur P, Zhang Y, et al. (2016) Intratumor Heterogeneity of Perfusion and Diffusion in Clear Cell Renal Cell Carcinoma: Correlation with Tumor Cellularity. Clin Genitourin Cancer 14:e585–e594. 10.1016/j.clgc.2016.04.007 [DOI] [PMC free article] [PubMed] [Google Scholar]
- 87.Zhang Y-D, Wu C- J, Wang Q, et al. (2015) Comparison of Utility of Histogram Apparent Diffusion Coefficient and R2* for Differentiation of Low-Grade From High-Grade Clear Cell Renal Cell Carcinoma. AJR Am J Roentgenol 205:W193–201. 10.2214/AJR.14.13802 [DOI] [PubMed] [Google Scholar]
- 88.Kierans AS, Rusinek H, Lee A, et al. (2014) Textural differences in apparent diffusion coefficient between low- and high-stage clear cell renal cell carcinoma. AJR Am J Roentgenol 203:W637–644. 10.2214/AJR.14.12570 [DOI] [PubMed] [Google Scholar]
- 89.Sasamori H, Saiki M, Suyama J, et al. (2014) Utility of apparent diffusion coefficients in the evaluation of solid renal tumors at 3T. Magn Reson Med Sci 13:89–95 [DOI] [PubMed] [Google Scholar]
- 90.Maruyama M, Yoshizako T, Uchida K, et al. (2015) Comparison of utility of tumor size and apparent diffusion coefficient for differentiation of low- and high-grade clear-cell renal cell carcinoma. Acta Radiol 56:250–256. 10.1177/0284185114523268 [DOI] [PubMed] [Google Scholar]
- 91.Yu X, Lin M, Ouyang H, et al. (2012) Application of ADC measurement in characterization of renal cell carcinomas with different pathological types and grades by 3.0T diffusion-weighted MRI. Eur J Radiol 81:3061–3066. 10.1016/j.ejrad.2012.04.028 [DOI] [PubMed] [Google Scholar]
- 92.Tanaka H, Yoshida S, Fujii Y, et al. (2011) Diffusion-weighted magnetic resonance imaging in the differentiation of angiomyolipoma with minimal fat from clear cell renal cell carcinoma. Int J Urol 18:727–730. 10.1111/j.1442-2042.2011.02824.x [DOI] [PubMed] [Google Scholar]
- 93.Razek AAKA, Farouk A, Mousa A, Nabil NN (2011) Role of diffusion-weighted magnetic resonance imaging in characterization of renal tumors. J Comput Assist Tomogr 35:332–336. 10.1097/RCT.0b013e318219fe76 [DOI] [PubMed] [Google Scholar]
- 94.Rosenkrantz AB, Niver BE, Fitzgerald EF, et al. (2010) Utility of the apparent diffusion coefficient for distinguishing clear cell renal cell carcinoma of low and high nuclear grade. AJR Am J Roentgenol 195:W344–351. 10.2214/AJR.10.4688 [DOI] [PubMed] [Google Scholar]
- 95.Sandrasegaran K, Sundaram CP, Ramaswamy R, et al. (2010) Usefulness of Diffusion-Weighted Imaging in the Evaluation of Renal Masses. American Journal of Roentgenology 194:438–445. 10.2214/AJR.09.3024 [DOI] [PubMed] [Google Scholar]
- 96.Zhang J, Tehrani YM, Wang L, et al. (2008) Renal masses: characterization with diffusion-weighted MR imaging--a preliminary experience. Radiology 247:458–464. 10.1148/radiol.2472070823 [DOI] [PubMed] [Google Scholar]
- 97.Doshi AM, Ream JM, Kierans AS, et al. (2016) Use of MRI in Differentiation of Papillary Renal Cell Carcinoma Subtypes: Qualitative and Quantitative Analysis. AJR Am J Roentgenol 206:566–572. 10.2214/AJR.15.15004 [DOI] [PubMed] [Google Scholar]