Abstract
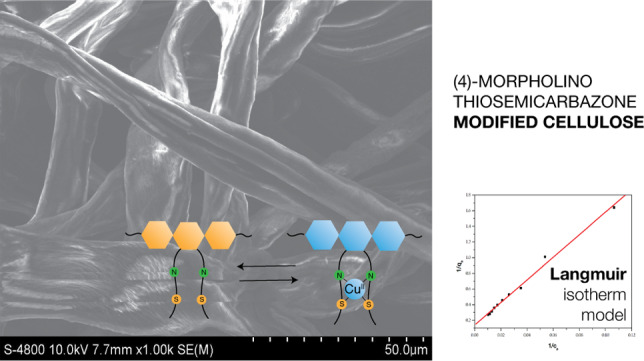
Thiosemicarbazide-modified cellulose (MTC) has been studied for removing heavy metals in the water source or for extracting some precious metals. The conditions of synthesis of MTC and Cu(II) removal were optimized by single-variable analysis through oxidation–reduction on titration and photometry. The results of Fourier-transform infrared spectroscopy, Brunauer–Emmett–Teller, and thermogravimetric analyses show that MTC exists in the thioketone form with a high surface area and heat durability. The Cu(II) removal was of pseudo-second order and the isotherm equation correlated best with the Langmuir equation. MTC has the maximum capacity of adsorption, which is qm = 106.3829 mg g–1. Furthermore, MTC can be regenerated without the loss of adsorption efficiency after ten cycles of adsorption and desorption.
1. Introduction
Heavy metal pollution has caused lots of adverse impacts on the sustainable development of aquatic flora and fauna near polluted zones. It has led to the development of dangerous diseases in humans. Using contaminated water for irrigation, aquaculture, and daily activities leads to accumulation of ion Cu(II) in plants and aquatic animals, which results in copper toxicity in human beings.1−4 Frequently, copper accumulated in the liver is one of the key reasons for symptoms such as headache, nausea, anemia, renal and liver failure, stomach bleeding, and death.2−8
Using materials available in nature such as cellulose9−14 and chitosan15−20 to address environmental issues has become currently more popular because they are abundantly available from waste products of agricultural activities, they are preliminary clean and nontoxic to human health, and are ecofriendly. Moreover, they are not very expensive and not vulnerable to changes in their physical and chemical properties during transportation. Cellulose and chitosan are different from other materials in that they have an OH group to synthesize different derivates, such as ester, carbamate, and ether.13,14,21 Cellulose is used more frequently than chitosan because its raw material can be easily obtained from plants, cotton, and so on, while chitosan is often extracted from crust, crab shells, and so on. This extraction requires the consumption of more raw chitosan than raw cellulose. Cellulose has two adjacent OH groups at the two carbons C2 and C3 (Scheme 1), which facilitates the binding of heavy metal ions, while the structure of chitosan has separated OH groups, which forms less stable complexes.13 In terms of cellulose, OH groups are modified with organic derivatives, which enable them to coordinate with heavy metal ions. Thus, it can be said that modified cellulose is capable of effectively removing metallic cations from polluted water. Cellulose-based materials are also compared to quantum dots (QDs). Unlike QDs, cellulose-based materials are insoluble in solvents, so cellulose-based materials are easy to reuse many times after filtration and desorption using simple techniques. Moreover, cellulose-based materials can be activated even at room temperature without the support of exciting light, while QDs absorb the appropriate bands to accelerate the interaction of the grafted ligands and the cores with cations.4 Cellulose is more biodegradable than QDs due to its organic nature.
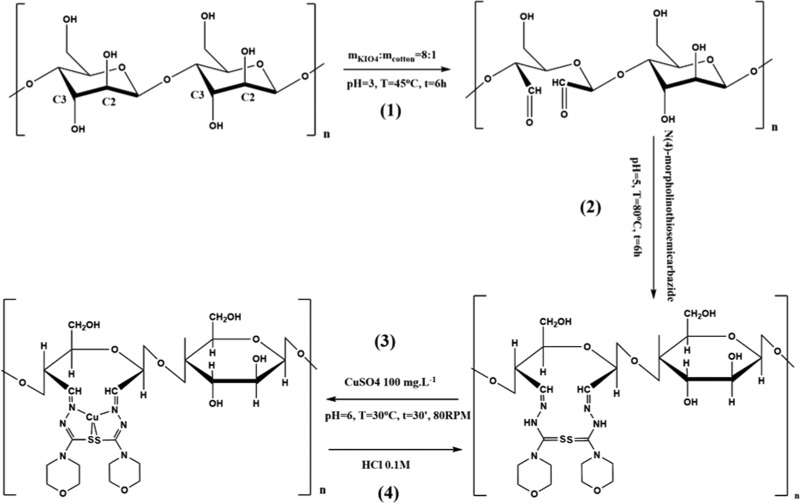
Scheme 1. Synthetic Process and the Adsorption of MTC.
(1) Oxidized TCR; (2) TC condensed with N(4)-morpholinothiosemicarbazide (MTC); (3) MTC adsorbed with 100 mg L–1 CuSO4 solution; and (4) desorption and reuse of MTC.
The adsorption of cellulose can be improved by condensation with nonsubstituted thiosemicarbazide (TSC)22−25 and phenyl group-substituted ones.26 In Vietnam, many studies showed the modified cellulose possessed the greater adsorption performance than activated carbons, zeolites, for removing heavy metal ions.13,14 In this research, cotton from India (Gossypium hirsutum L.) was the main raw material that was collected from the GLE Logistics warehouse. The cotton was cleaned, oxidized, and condensed with N(4)-morpholinothiosemicarbazide to form modified cellulose, which can remove Cu(II). Besides, there has been no research about N(4)-morpholinothiosemicarbazide with oxidized cotton. The statistical data of titration and UV–vis spectrometry were analyzed to estimate the optimal conditions for some processes in our study. To obtain more details, FT-IR, XRD, SEM, TGA/DSC, Brunauer–Emmett–Teller (BET), and EDX were integrated to observe the change in structural, physical, and chemical properties of the raw material cotton (TCR). The cotton was oxidized with KIO4 (TC), the TC was then condensed with N(4)-morpholinothiosemicarbazide (MTC), after which MTC could adsorb the Cu(II) ion (MTC-Cu). In this study, we focused on the investigation of the adsorption ability of MTC to remove Cu(II) in a standard solution. Two-variable analysis of variance (ANOVA) of with replicates was applied to assess the interaction of the pair of factors to the removal process. We also studied the role of N(4)-substitutes on the adsorption ability of MTC (Schemes 1 and 2).
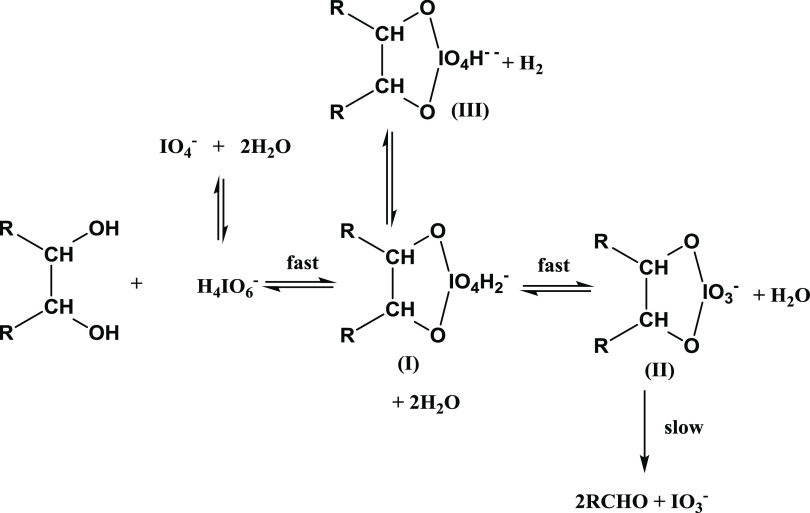
Scheme 2. Complexes of Cellulose–KIO4 at Different pH Values.
2. Results and Discussion
2.1. Optimal Conditions
2.1.1. Optimal Conditions for Process (1)
pH is observed to affect the reaction of cellulose and KIO4. When the pH of the solution reaches over 7.0, the equilibrium shifts to the direction where complex (III) is favored. It results in nondegradation of IO4– to IO3–, and the transformation of the OH to CHO group cannot take place. So, the pH of the solution is kept under 7.0 to form a complex (II). Complexes (II) rearrange the charges to decompose to aldehyde and IO3–.27 Thereupon, pH was investigated at several values, namely, 2.0, 2.5, 3.0, 3.5, 4.0, 4.5, and 5.0. The transition complex formation is a reversible reaction in which the forwarding direction is exothermic. The increase in temperature enables the increase in rate and a gradual shift to the inverse direction. The electrolyte is also one of the factors affecting the yield of cellulose oxidation by KIO4, which is related to the amount of CHO of TC. Cellulose (cotton) becomes a semipermeable membrane in a strong electrolyte solution. When the solution contains strong electrolytes, it causes a Donnan semipermeable membrane that changes the rate of cellulose oxidation by KIO4.27 All reactions took place in the dark. When reactions are exposed to light, the rate of the oxidized reaction is expected to increase. It results in byproducts such as chains of polymers hindering the formation of CHO group. An excessive amount of KIO4 was added into the solution to avoid this side effect.27
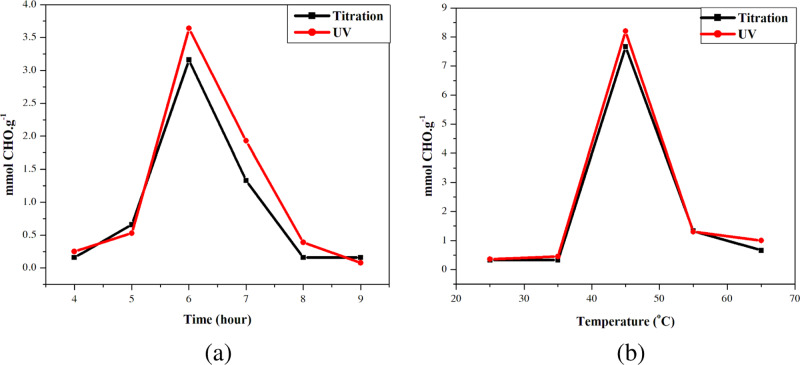
The Fisher (F) and Student (t) coefficients were used to evaluate the accuracy and the precision of data carried out by two analytical methods. Process (1) was carried out under optimal conditions: a CH3COOH/CH3COONa buffer solution (pH = 3.0); time, 6.0 h (t); temperature, 45 °C; mass ratio of TCR/KIO4, 1:8; NaCl concentration, 0.20 M; and a dark environment. Two analysis methods (titration and photometry) were compared based on the Fisher coefficient (F) (Fo = 19) and the Student coefficient (t) (to = 2.447). All studied data satisfied the following conditions: F < Fo and t < to. It proved that the data from two analysis methods in each of the batch experiments were insignificantly different. They are the same accuracy with the confidence of 95% (Figure 1). The differences among the samples could be due to random factors.
Figure 1.
Effects of factors on the number of CHO groups, which were analyzed by titration (black line) and spectrophotometry (red line): (a) oxidized time and (b) temperature.
2.1.2. Optimal Conditions for Processes (2) and (3)
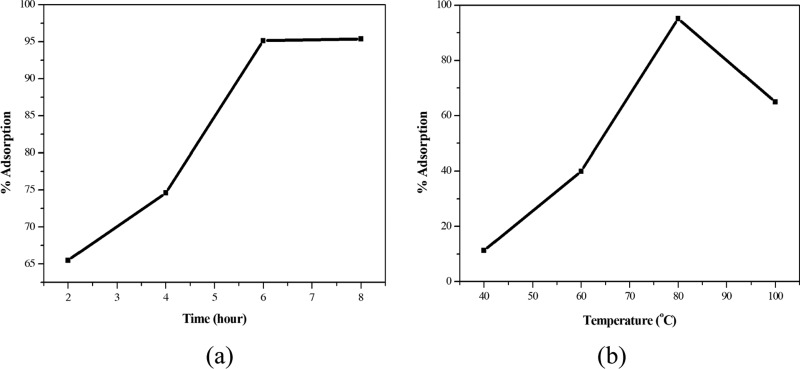
The optimal conditions for the condensation between TC and N(4)-morpholinothiosemicarbazide were as follows: pH of solution, 5.0; reaction temperature T, 80 °C; (2) was refluxed for 6 h with the mass ratio of TC/N(4)-morpholinothiosemicarbazide being 1:2 (Figure 2).
Figure 2.
Graphs of single-variable survey: (a) condensation time and (b) condensation temperature.
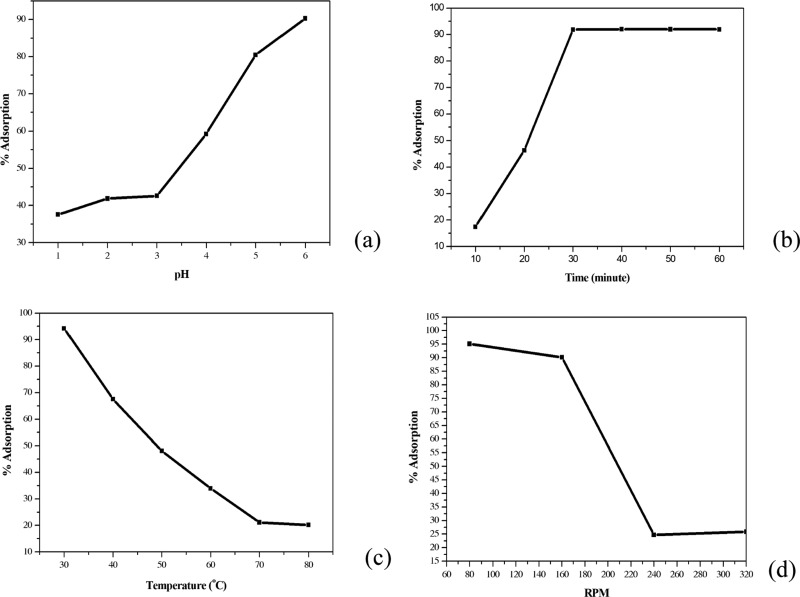
In general, an increase in the pH value and time of adsorption led to an increase in the removal performance of MTC, while an increase in temperature of the solution and speed of the centrifugal shaker decreased the removal performance of MTC. As can be seen from graph (3a), for pH values from 1 to 3, the performance was lower than 75% due to the protonation of the thioketone group, which reduced the probability of Cu(II) ions binding to thioketone. From pH 4 to 6, the performance increased dramatically to reach the highest point at pH 6.0 (92%). At higher pH, hydroxides were formed (Ksp of Cu(OH)2 is 1.6 × 10⁻¹⁹).28 To avoid this drawback, the optimal pH was chosen at 6.0. Second, the maximum time that could be seen on the graph was 30 min, and for longer durations, the performance remained unchanged. Thus, the optimal time for this process was chosen as 30 min. Third, the performance of the removal of MTC decreased steadily from 30 to 70 °C because the adsorption was a reversible process. The rise in temperature from 30 to 70 °C leads to an equilibrium, which favors the desorption direction. Therefore, the optimal temperature of this process was 30 °C. The effect of speed was the same as that of temperature. The much faster (≥160 RPM) or the lower the speed (≤80 RPM) was, the less effective was the coordination due to less probability of successful collisions. In conclusion, the optimal conditions of process (3) were as follows: pH, 6.0; temperature T, 30 °C; adsorption time, 30 min; and speed, 80 RPM (Figure 3).
Figure 3.
Graphs of single-variable survey: (a) pH of solution, (b) adsorption time, (c) solution temperature, and (d) speed of centrifugal shaker.
2.2. Effects of Factors on the Performance of Adsorption
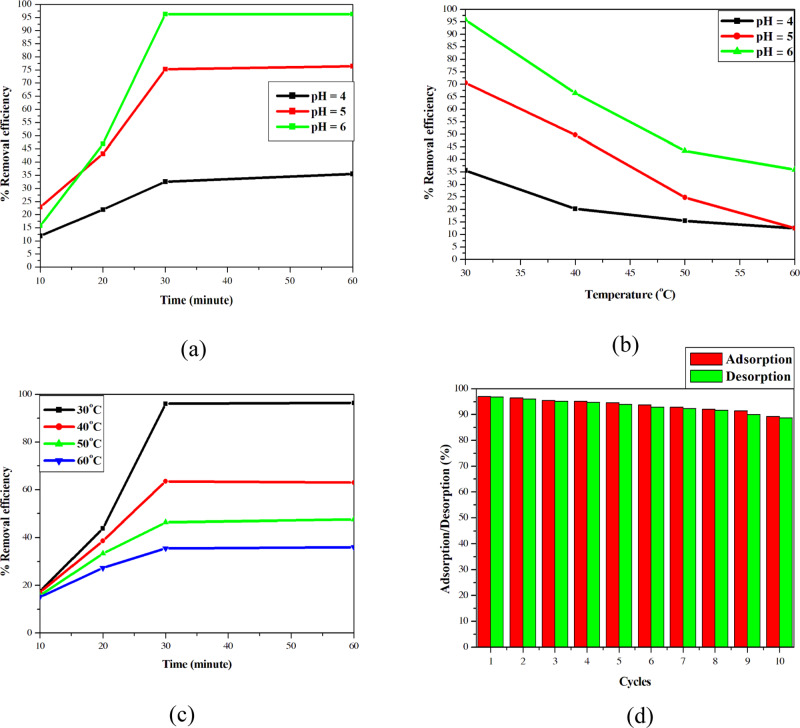
Two-variable ANOVA with replicates was used to evaluate the interaction of factors in each pair of factors (pH–temperature, pH–time, and time–temperature) and provide a comprehensive view about the effect of these factors on the performance of Cu(II) removal by MTC. Using two-variable ANOVA with replicates, the pairs of pH–time, pH–temperature, and time–temperature were investigated to determine their effect on the performance of the adsorption of MTC. For the pair of pH and time, the highest performance was at 30 min and pH was 6.0. When the pH was changed from 6.0 to 5.0, the performance decreased from 95 to 75%. At the beginning point, for pH 6.0, when the time was changed from 30 to 20 min, the performance decreased from 95 to 50%. By combining the F statistical distribution, FA = 102773.9 > F2,24,0.95 = 3.40 (i.e., pH had a significant effect on the results of the removal performance), FB = 124767.2 > F3,24,0.95 = 3.01 (i.e., time had a significant effect on the results of the removal performance), and FAB = 13482.0 > F6,24,0.95 = 2.51 (i.e., the interaction of two factors on the performance was considerable), we could conclude that the time and pH interacted with each other and affected the removal performance. For the pair of pH and temperature, at pH 6 and T of 30 °C, the performance was the highest. When pH value was decreased or the temperature was increased, the performance showed a decreasing tendency. By combining the F statistical, FA = 2.68 × 10⁸ > F2,24,0.95 = 3.40 (i.e., pH had a significant effect on the results of the removal performance), FB = 2.2 × 10⁸ > F3,24,0.95 = 3.01 (i.e., temperature had a significant effect on the results of the removal performance), and FAB = 16 593 125 > F6,24,0.95 = 2.51 (i.e., the interaction of two factors on the performance was considerable), we could conclude that pH and temperature interacted with each other and affected the removal performance of MTC. Finally, for the pair of temperature and time, at the beginning point, if the temperature was increased, the removal performance decreased (similar to the pair of pH and temperature), while if the time was increased, the performance increased. By combining the F statistical, FA = 8616299 > F3,32,0.95 = 2.92 (i.e., temperature had a significant effect on the results of removal performance), FB = 16561113 > F3,32,0.95 = 2.92 (i.e., time had a significant effect on the results of removal performance), and FAB = 1499828 > F9,32,0.95 = 2.21 (i.e., the interaction of two factors on the performance was considerable), we could conclude that time and temperature interacted with each other and affected the removal performance of MTC. Compared to the optimal conditions of process (3), these conditions still replicated exactly the optimal conditions (Figure 4).
Figure 4.
Pairs of factors affecting the adsorption of thiosemicarbazide-modified cellulose (MTC): (a) pair of pH and time, (b) pair of pH and temperature, and (c) pair of temperature and time. (d) Times of removal (green column) and reuse (red column).
2.3. FT-IR, TGA/DSC, XRD, SEM, EDX, and BET Analyses
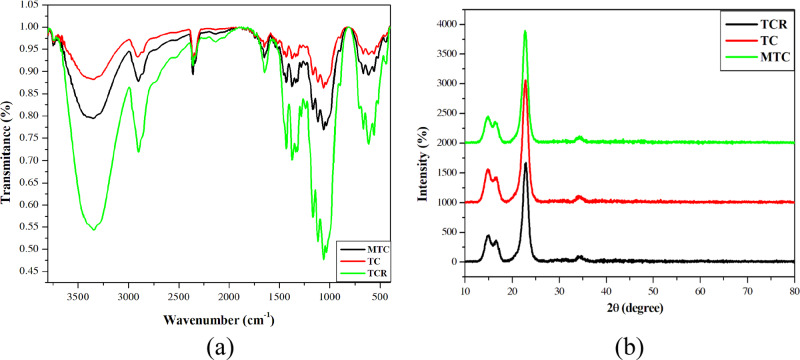
The FT-IR spectroscopy analysis of TCR showed a broad absorption at 3600–3000 cm–1 presenting the vibration of the O–H bond, indicating the O–H group of cellulose chains. The sharp absorption at 1150–1070 cm–1 indicated the stretching vibration of C–O, and the other one at 1740–1725 cm–1 was assigned to the vibration of the aldehyde group. This proved that the oxidation of TCR was successful, which converted the OH group of C2–C3 into the CHO group. For FT-IR spectroscopy of MTC, the signal at 1740–1725 cm–1 still appeared, but its intensity decreased. These proved that the number of CHO groups had decreased in the condensation process. At 2500 cm–1, the vibration of the S–H bond could not be recorded using FT-IR spectroscopy, and the appearance of absorption at 1400–1300 cm–1 was attributed to the vibration of the C=S group. To conclude, thiosemicarbazide existed as thioketone in samples.
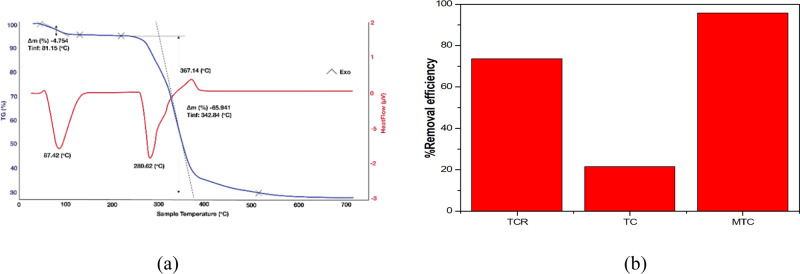
For TGA/DSC, TCR, TC, MTC, and MTC-Cu samples were conducted to determine the durability of each material. Generally, for all samples, there was a loss of mass at temperatures from 50 to 130 °C (Figure 6). This indicated the mass loss of adsorbed water. The next peak of mass loss was in the range 250–380 °C due to the combustion of materials to release CO2 and CO. This oxidation lasted up to 500 °C, which resulted in carbon powder. The MTC-Cu was the most heat-durable material (520 °C), which was because CuS in the final loss step was stable in the studied analysis. This striking pattern indicated that MTC coordinated to the Cu(II) ion.
Figure 6.
(a) Thermogravimetric analysis/differential scanning calorimetry (TGA/DSC) curves of MTC-Cu. (b) Adsorption performances of TCR, TC, and MTC.
For XRD spectroscopy, TCR, TC, and MTC samples were analyzed to determine the change in crystals. According to the observation of XRD spectroscopy of TCR, two broad diffraction peaks at 15.07 and 16.62° and a sharp peak at 22.84° identified the crystal of cotton fiber.29,30 In general, the difference among TCR, TC, and MTC was insignificant although there was a change in the 2θ values at the above points. For instance, peaks appeared at 15.01, 16.58, and 22.82° in the TC data; for MTC, peaks appeared at 15.09; 16.43, and 22.73° with different intensities. Thereupon, XRD spectroscopy showed that the structure of cotton was not broken completely by oxidation and condensation taking place in some identified sites, especially on the surface of modified cellulose. The crystallinity index (CI) value of cellulose can prove the crystallinity of TCR, TC, and MTC. The CI value can be obtained with eq 1.
| 1 |
where I002 is the height of the 002 peak and Iam is the height of the minimum peak between the 002 and 101 peaks. The 002 peaks of TCR, TC, and MTC were at 22.84, 22.82, and 22.73°, respectively, and the minimum peaks of TCR, TC, and MTC were at 18.43, 18.74, and 18.70°, respectively. The CI values of TCR, TC, and MTC were 99.34, 99.90, and 99.84%, respectively. This proves that the oxidation and the adsorption did not affect the structure of the cellulose crystalline structure. To sum up, these processes could occur on the surface of the materials (Figure 5).
Figure 5.
(a) Fourier-transform infrared (FT-IR) spectra of TCR (green line), TC (red line), and MTC (black line). (b) X-ray diffraction (XRD) patterns of TCR (black line), TC (red line), and MTC (green line).
Based on SEM pictures (Figure 7), in general, the cellulose surface was smooth and glossy. After TCR was oxidized, the SEM picture of TC demonstrated some white spots on the surface. It could indicate that the oxidation caused the sloughing surface of the material to form the white spots. Regarding the condensation process, the MTC possessed many patterns on the surface that resembled the surface of the raw material. This indicated that in the condensation process, thiosemicarbazide molecules connected with the CHO group, and the imine group C=N was formed, filling the sloughing surface with white spots.
Figure 7.
Scanning electron microscope (SEM) pictures of (a) TCR, (b) TC, and (c) MTC.
For EDX spectra (Figure 8), MTC and MTC-Cu samples were analyzed to determine the adsorption of MTC. From the results of EDX spectroscopy of MTC-Cu, the appearance of the Cu peak indicated that MTC adsorbed the Cu(II) ion in solution. However, the EDX spectrum of MTC did not show any peak of the sulfur element, while the MTC-Cu spectrum showed a signal. This was because the high-energy X-rays interacted with the sulfur atom, which led to the destruction of sulfur. So EDX spectrometry could not record the signal of the sulfur atom. However, in the MTC-Cu sample, bond formation between the Cu2+ ion and S of the thioketone group was established due to the soft acid–soft base interaction, and this stable interaction was not broken by X-rays. Data of MTC and MTC-Cu did not record the signal of nitrogen because nitrogen is a light atom, compared to carbon and oxygen.
Figure 8.
Energy-dispersive X-ray (EDX) spectra of (a) MTC and (b) MTC-Cu.
For BET measurement, TCR, TC, and MTC samples were measured to determine the surface area. The results from BET showed that TCR, TC, and MTC had surface areas of 300.046, 0.000, and 677.940 m2 g–1, respectively. The BET values were used to predict whether oxidation and condensation occurred and whether those processes affected the characteristic surface of materials. The BET values and the % removal efficiencies of TCR, TC, and MTC had the same trend. Surveys for the Cu(II) removal of TCR, TC, and MTC were performed. As can be seen from graph Figure 6b, TC had the lowest removal performance, whereas MTC possessed the highest removal performance. It could be explained by the fact that adjacent OH groups of TCR helped it form a complex with the Cu(II) ion. Besides, there were pores on the surface, which acted as adsorption sites. For TC, although the surface area of TC was 0.000 m2 g–1, TC can adsorb Cu(II) ions due to the number of OH groups that remained after oxidization. Finally, the MTC material containing the imine group and the sulfur atom could combine with Cu(II) ions to form Cu–S. The white spots disappeared on the surface of MTC, and its surface area increased, which indicated that MTC had the highest removal performance.
2.4. Isotherms, Thermodynamic, and the Kinetic Equation for Process (3)
2.4.1. Isotherm Equations
The Langmuir isotherm equation (eq 2) is used for describing quantitatively the formation of a monolayer adsorbate on the outer surface of adsorbents, with each adsorption center attaching one molecule. The surface is homogeneous at every site, and the adsorption is reversible.31
| 2 |
where Ce is the equilibrium concentration of the adsorbate (mg L–1), qe is the amount of metal adsorbed of the adsorbent at equilibrium (mg g–1), qm is the maximum monolayer coverage capacity (mg g–1), and KL is the Langmuir isotherm constant (L mg–1).
The Freundlich isotherm equation (eq 3) is used for describing the adsorption characteristics on a heterogeneous surface.31
| 3 |
where Ce is the equilibrium concentration of the adsorbate (mg L–1), qe is the amount of metal adsorbed of the adsorbent at equilibrium (mg g–1), n is the adsorption intensity, and KF is the Freundlich isotherm constant.
The Temkin isotherm equation (eq 4) considers the interaction of the material and the adsorption subject by ignoring the too high or too low concentration. It just considers the adsorption heat (heat function) of all molecules on the layer that is linearly reduced.31
| 4 |
where Ce is the equilibrium concentration of the adsorbate (mg L–1), qe is the amount of metal adsorbed of the adsorbent at equilibrium (mg g–1), AT is the Temkin isotherm equilibrium binding constant (L g–1), bT is the Temkin isotherm constant, R is the universal gas constant 8.314 (J mol–1 K–1), and T is the temperature at 298 K.
The Dubinin–Radushkevich isotherm equation (eq 5) shows the mechanism of adsorption with the Gaussian energy distribution on the nonhomogeneous surface of a material. It is usually applied for good active substances.31
| 5 |
where qe is the amount of adsorbed metal in the adsorbent at equilibrium (mg g–1), qs is the theoretical isotherm saturation capacity (mg g–1), Kad is the adsorption equilibrium constant (mol2 kJ–2), and ε is the Dubinin–Radushkevich isotherm constant.
The Langmuir isotherm model was the best design for depicting the Cu(II) removal of MTC because its R2 is larger than that of the Freundlich, Temkin, and Dubinin–Radushkevich equations. Besides, χ2, sum of absolute error (SAE), sum of square of error (SSE), and Δqe values of the Langmuir equation were smaller than the other three (Table 1).
Table 1. Coefficients of Isotherm Equations.
| Langmuir
isotherm equation | |||||||
|---|---|---|---|---|---|---|---|
|
y = 0.0688x – 0.0094 |
R2 = 0.9922 |
||||||
| qm (mg g–1) | KL (L mg–1) | R2 | χ2 | SAE | SSE | Δqe | RL |
| 106.3829 | 0.13663 | 0.9922 | 1.174 | 23.90252 | 2.9435 | 3.1028 | 0.0638 |
| Freundlich isotherm equation | |||||||
|---|---|---|---|---|---|---|---|
|
y = 1.339x + 2.7694 |
R2 = 0.9702 |
||||||
| KF (L mg–1) | N | R2 | χ2 | SAE | SSE | Δqe | |
| 15.94906 | 0.74682 | 0.9702 | 4.267 | 37.4018 | 4.6074 | 3.1030 | |
| Temkin
isotherm equation | |||||||
|---|---|---|---|---|---|---|---|
|
y = 49.674x + 15.736 |
R2 = 0.8605 |
||||||
| AT (L mg–1) | bT (J mol–1) | R2 | χ2 | SAE | SSE | Δqe | |
| 1.3727 | 49.8766 | 0.8605 | 57.753 | 88.3214 | 10.2657 | 10.82099 | |
| Dubinin–Radushkevich isotherm equation | ||||||
|---|---|---|---|---|---|---|
|
y = −4 ×10⁻⁷x + 4.3589 |
R2 = 0.8758 |
|||||
| qs (mg g–1) | Kad (mol2 kJ–2) | R2 | χ2 | SAE | SSE | Δqe |
| 78.1711 | 4 × 10⁻⁷ | 0.8758 | 30.797 | 108.0721 | 13.4445 | 14.17179 |
With the Langmuir isotherm equation (Figure 9), the qm coefficient could prove that the maximum adsorption capacity with which MTC could remove the Cu(II) ion from the solution was 106.3829 mg g–1. The RL value of 0 < RL < 1 shows that the adsorption was spontaneous. From Tables 1, 2, and 3, it can be seen that the adsorption process of the above adsorbents almost obeyed the Langmuir isotherm and the pseudo-second-order equation. MTC had the lowest adsorption time (for 30 min) with the capacity of 106.3829 mg g–1, which was lower than only thiosemicarbazide carboxymethyl cellulose. Under the same conditions, there was no significant difference in the adsorption capacity of MTC compared to the N(4)-nonsubstituted TSC cellulose.22−25 Therefore, it can be concluded that the heterocyclic substitute as the morpholine moiety at the N(4) position of thiosemicarbazide does not affect the adsorption capacity of TSC cellulose.
Figure 9.
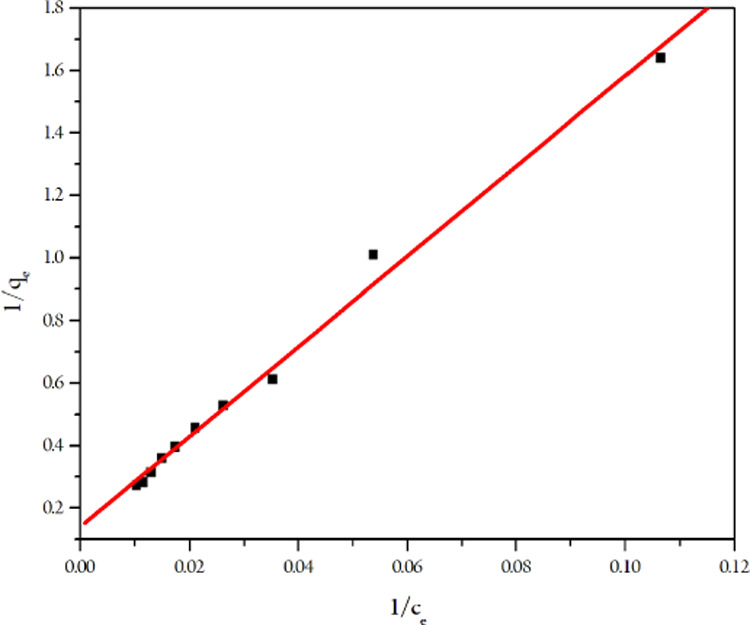
Paradigm of the Langmuir isotherm equation.
Table 2. Comparison of Different Adsorbents.
| adsorbent | metal ion | time | capacity (mg g–1) | isotherm | order of reaction | ref |
|---|---|---|---|---|---|---|
| chitosan-coated cotton fiber | Cu(II) | 15 h | 24,78 | L, F | (30) | |
| chitosan/perlite | Cu(II) | 24 h | 104.0 | L | (31) | |
| wood pulp citric acid | Cu(II) | 2 h | 23.70 | L | (32) | |
| sunflower stalk acrylonitrile | Cu(II) | 2 h | 39.0 | F | (33) | |
| carboxymethyl cellulose-based Na montmorillonite thermoresponsive nanocomposite hydrogel | Cu(II) | 48 h | 2.23 | pseudo-second | (34) | |
| carboxymethyl cellulose-based thermoresponsive nanocomposite hydrogel | Cu(II) | 48 h | 2.14 | pseudo-second | (34) | |
| chitosan/zeolite composite | Cu(II) | 1 h | 25.88 | L | pseudo-second | (35) |
| thiosemicarbazide carboxymethyl cellulose | Cu(II) | 30 min | 144.90 | L | pseudo-second | (13) |
| MTC | Cu(II) | 30 min | 106.3829 | L | pseudo-second | present work |
L, Langmuir; F, Freundlich.
Table 3. Kinetic Constants of Adsorption.
| no | concentration (mol L–1) | k1 | k2 | qe cal | R2 | SSE | SAE | χ2 | Δq |
|---|---|---|---|---|---|---|---|---|---|
| Pseudo-First Order Equation 6 | |||||||||
| 1 | 100 | 0.1298 | 25.647 | 0.8324 | 72.751 | 270.318 | 1274.101 | 81.3383 | |
| 2 | 75 | 0.1364 | 24.944 | 0.9048 | 75.014 | 276.173 | 1213.522 | 83.8687 | |
| 3 | 50 | 0.1502 | 24.567 | 0.9467 | 84.774 | 308.472 | 1241.545 | 94.7802 | |
| Pseudo-Second Order Equation 7 | |||||||||
| 1 | 100 | 0.00023 | 78.740 | 0.9967 | 0.573 | 2.245 | 0.028 | 0.6403 | |
| 2 | 75 | 0.00020 | 86.206 | 0.9978 | 0.608 | 1.869 | 0.023 | 0.6803 | |
| 3 | 50 | 0.00020 | 86.956 | 0.9998 | 0.275 | 0.986 | 0.004 | 0.3071 | |
2.4.2. Kinetic Investigation
The increase in the rate of the adsorption process is due to the presence of many vacant sites. Compared with other adsorbents,32,33,35 MTC shows a greater rate. The fast adsorption is attributed to amine and sulfur groups present in the MTC, which have a high affinity to the Cu(II) ion. The kinetic equation of adsorption of the Cu(II) ion by MTC was developed based on the Lagergren equation.36
| 6 |
| 7 |
where qe is the adsorption capacity (mg g–1), qt is the adsorption at t (min), and k1 and k2 are the rate constants.
The regression coefficient R2 of eq 7 was greater than that of eq 6, and the error values (SSE, SAE, χ2, Δq) of eq 7 were less than those of eq 6. Therefore, the adsorption of MTC was of pseudo-second order. Its order was independent of the concentration of the Cu(II) solution. The pseudo-second-order and the adsorption data showed that the adsorption process of the Cu(II) ion by MTC was a chemical reaction (chemical adsorption, the Cu(II) ion forms bonds with the S and N atoms of MTC) but not a physical adsorption.13,37
2.4.3. Thermodynamic Parameters of the Adsorption
The endothermic or exothermic adsorption can be concluded by analyzing the enthalpy (ΔH°) and standard free energy (ΔG°), respectively. Equations 8–10 were used to obtain the different thermodynamic parameters.
| 8 |
| 9 |
| 10 |
where R is the gas constant (8.314 J K–1 mol–1), T is the temperature (K), Kc is the thermodynamic equilibrium constant, qe is the solid-phase equilibrium concentration (mg g–1), Ce is the equilibrium concentration of the solution (mg L–1), and ΔS° is the randomness of the system (J mol–1 K–1), which was obtained from the linear equation from Figure 10.
Figure 10.
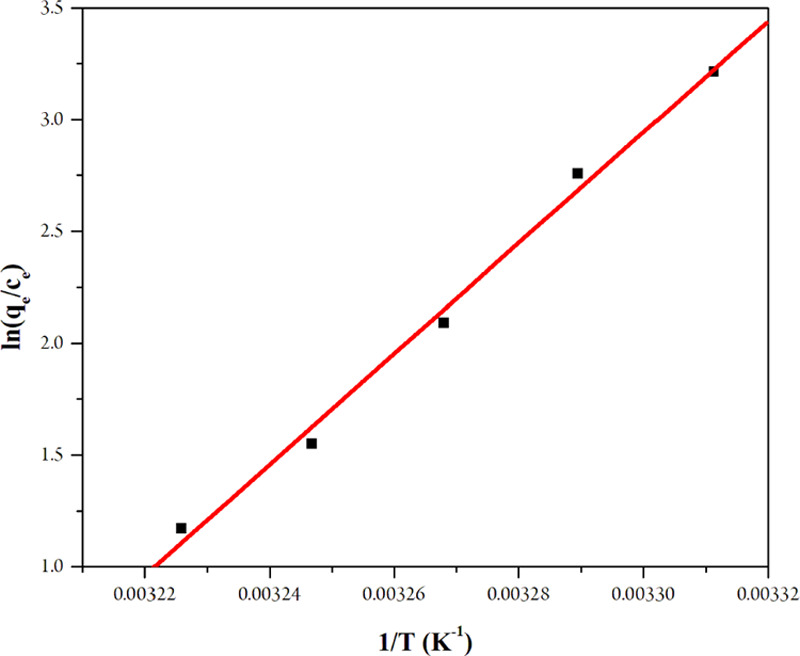
Graph of the van’t Hoff equation for the adsorption of MTC.
The linear equation was established as follows: y = 6125.3x – 17.261 with R2 = 0.9903. As a result, ΔH° was −50.9257 kJ mol–1 and ΔS° was −143.5079 J mol–1 K–1. The ΔG° values showed that the adsorption process of MTC was spontaneous in the temperature range of 302–310 K. The ΔH° value showed that the process was exothermic. The MTC showed the cellulose structure to be fiber (the same as the Au-C-fiber) (Table 5), which endowed MTC with the advantage of keeping the Cu(II) ions without heating. So when the temperature increases, the fiber structure expands and Cu(II) ions on the surface might become loose and fall out of the fiber. The thermodynamic values supported the results of the single-variable survey (T = 30 °C) that the rise in temperature decreased the performance gradually.38 The ΔS° value showed that the randomness of the system decreased. It is because when adsorption occurred, the number of ions in the final solution decreased compared to the original solution (Table 4).
Table 5. Thermodynamic Values of the Other Adsorbents.
| adsorbent | ΔH° (kJ mol–1) | ΔS° (J mol–1 K–1) | ref |
|---|---|---|---|
| Au-C-PTS fibers | -53.12 | –109.62 | (39) |
| Ni-C-PTS fibers | –13.39 | –8.17 | (39) |
| TSC-NH3-OCS Ag(I) unary | 12.78 | 74.96 | (40) |
| TSC-NH3-OCS Ag(I)–Cu(II)–Ni(II) tertnary | –43.42 | –126.22 | (40) |
| thiosemicarbazide carboxymethyl cellulose | 1.101 | 30.95 | (13) |
| MTC | –50.9257 | –143.5079 | this study |
Table 4. Thermodynamic Values of Adsorption.
| temperature (K) | ΔG° (kJ mol–1) | ΔH° (kJ mol–1) | ΔS° (J mol–1 K–1) |
|---|---|---|---|
| 302 | –7.586 | –50.9257 | –143.5079 |
| 304 | –7.299 | ||
| 306 | –7.012 | ||
| 308 | –6.725 | ||
| 310 | –6.438 |
2.5. Desorption and Reuse
Desorption was used with 0.1 M HCl. With the first adsorption, the removal was about 97%. The change was clear in the tenth adsorption with 90% Cu(II) removed. The percentages of desorption and adsorption were very close. This proved that the adsorption of the MTC material was reversible.
Compared to the other adsorbents,8,13,41−43 the performance of MTC on the fourth reuse was 95.15% and on the fifth reuse it was 94.62%, proving that MTC had equivalent performance to the others. MTC could be reused efficiently 10 times because it possessed the removal performance of 90%. Thus, it is promising to use MTC in the removal of Cu(II) ions in contaminated water sources (Figure 4d).
3. Conclusions
By the single-variable analysis, the optimal conditions for the oxidation process were determined. Cotton was oxidized in a CH3COOH/CH3COONa buffer solution (pH 3.0) at 45 °C for 6.0 h with the mass ratio of TCR/KIO4 of 1:8 and in a dark condition. The optimal condition for the condensation process was also estimated: mass ratio of TC/N(4)-morpholinothiosemicarbazide, 1:2; pH of the solution, 5.0; reaction time, 6.0 h; and temperature, 80 °C. The removal was processed in pH 6.0 at 30 °C for 30 min with 80 RPM. With two-variable ANOVA with replicates, pairs of factors were seen to affect the performance of adsorption of MTC: pH–time, pH–temperature, and time–temperature. The adsorption was of pseudo-second order; the isotherm equation correlated best with the Langmuir equation with the estimated thermodynamic values (ΔH° was −50.9257 kJ mol–1 and ΔS° was −143.5079 J mol–1 K–1). All of the data showed that the adsorption process was spontaneous at room temperature. The adsorption capacity of TSC cellulose depends on the number of active sites such as oxygen atoms of hydroxyl groups, sulfur atoms of thioketone, and nitrogen atoms of imine groups. The substitute as morpholine at the N(4) position does not support the adsorption capacity. Desorption of MTC occurred in 0.1 M HCl and could be reused 10 times. MTC can be used to treat wastewater from industrial factories due to its ability of Cu(II) removal, which can adsorb 95–97% of Cu(II) ions in polluted water. Based on the results of this study, in our next work, we expect to transform MTC into a stationary phase in ion-exchange chromatography.
4. Materials and Methods
4.1. General
Chemicals: Sodium hydroxide, hydrogen peroxide 30%, hydrochloric acid 36.5%, potassium iodide, potassium permanganate, potassium hydroxide, sodium hydroxide, sodium chloride, starch, sodium thiosulfate pentahydrate, boric acid (solid), concn acetic acid, concn phosphoric acid, concn sulfuric acid, carbon disulfide, ammonia, hydrazine hydrate, ethanol, copper sulfate pentahydrate, and ethyl acetate were purchased from Xilong, China; potassium iodate was from BDH-England; and morpholine and sodium chloroacetate were from Sigma-Aldrich-America. Cotton was collected from GLE Logistics warehouse, Ho Chi Minh City, Vietnam.
Equipment: The structural analyses of TCR, TC, and MTC were carried out by FT-IR in the scan range of 4000–450 cm–1 (TENSOR 27-BRUCKER with compressed KBr pellets). Changes in crystallinity were determined using D8 Advance Eco (Bruker AXS-German) with a Cu target ƛ = 0.154 nm at 40 kV and 2θ of 10°–80°. Adsorption data were obtained with the help of UV photometry (Perkin-Elmer Lamda 25 UV–vis spectrum; wavelength 200–800 nm). The pH was monitored by a pH calorimeter (Winlab). Surface area data of TCR, TC, and MTC were studied by operating Nova Station A, Quantachrome. The surface morphologies were observed by SEM HITACHI S-4800 (HI-9039–0006). The elemental composition was analyzed by EDX 2800 (Skyray). Thermal stabilities of TCR, TC, and MTC were tested in a nitrogen environment in the range of 50–700 °C and heating speed of 10 °C min–1 (Labys Evo TG-DSC-1600 °C).
4.2. Synthesis Process and Adsorption of Modified Cellulose (MTC)
The process of cleaning raw cotton was based on a traditional method.39 To synthesize KIO4, 10 g of KI and 20 g of KOH were added into a 100 mL beaker containing 60 mL of water and then stirred with a magnetic stirrer. The chlorine generated by the reaction between KMnO4 and concn HCl was bubbled to the alkaline iodide solution for 3 h. The precipitate was filtered and dried at 70 °C. N(4)-Morpholinothiosemicarbazide was prepared by the traditional method.43
TCR and KIO4 were mixed in a 100 mL Erlenmeyer flask with the mass ratio TCR/KIO4 of 1:8 in an acetic buffer solution (pH = 3.0) at 45 °C for 6 h and kept without sunlight. The product was filtered, washed with water, and dried at 70 °C, which led to the obtaining of oxidized cotton (TC).13 TC was condensed with N(4)-morpholinothiosemicarbazide with the mass ratio of 1:2 and pH 5.0. The solution was heated at 80 °C for 6 h. After that, the product was filtered, washed with hot ethanol, and dried at 70 °C, which led to the obtaining of condensed cotton (MTC).
First, 0.05 g of MTC was added into a 50 mL Erlenmeyer flask containing 100 mg L–1 CuSO4, with the pH of the solution adjusted to 6.0, temperature at 30 °C, and the removal proceeded in 30 min at the speed of 80 RPM.
4.3. Investigation of the Optimal Conditions
4.3.1. Optimal Conditions for Process (1)
All single-variable samples had a blank sample to compare; samples were measured at wavelength 287.80 nm.44 All single-variable conditions for the investigation of the process (1) are listed in Table 6.
Table 6. Single-Variable Conditions for Investigation of Optimal Conditions of Process (1).
| buffer solutions | H2SO4 | H3PO4 | CH3COOH | ||||
|---|---|---|---|---|---|---|---|
| pH buffer solutions | 2.0 | 2.5 | 3.0 | 3.5 | 4.0 | 4.5 | 5.0 |
| oxidized time (h) | 4.0 | 5.0 | 6.0 | 7.0 | 8.0 | 9.0 | |
| temperature (°C) | 25 | 35 | 45 | 55 | 65 | ||
| mass ratio TCR/KIO4 | 1:1 | 1:2 | 1:4 | 1:8 | 1:10 | ||
| concentration of NaCl (mol L–1) | 0.05 | 0.10 | 0.15 | 0.20 | 0.25 | ||
4.3.2. Optimal Conditions for Process (2)
MTC adsorbed Cu(II) ions, and the solution after removal was compared to the initial CuSO4 solution to calculate the performance of the removal of MTC. The solution was measured at wavelength 800.0 nm. All single-variable conditions for the investigation of process (2) are listed in Table 7.
Table 7. Single-Variable Conditions for Investigation of Optimal Conditions of Process (2).
| condensation time (h) | 2 | 4 | 6 | 8 |
| condensation temperature (°C) | 40 | 60 | 80 |
4.3.3. Optimal Conditions for Process (3)
MTC adsorbed Cu(II) ions, and the solution after removal was compared to the initial CuSO4 solution to calculate the performance of the removal of MTC. The solution was measured at wavelength 800.0 nm. All single-variable conditions for the investigation of process (3) are listed in Table 8.
Table 8. Single-Variable Conditions for Investigation of Optimal Conditions of Process (3).
| pH of solution | 1.0 | 2.0 | 3.0 | 4.0 | 5.0 | 6.0 |
| removal time (min) | 10 | 20 | 30 | 40 | 50 | 60 |
| solution temperature (°C) | 30 | 40 | 50 | 60 | 70 | 80 |
| speed (RPM) | 80 | 160 | 240 | 320 | ||
4.4. Isotherm, Thermodynamic, and Kinetic Equations for the Adsorption Process of MTC
MTC (0.05 g) adsorbed Cu(II) ions with the solution pH of 6.0 at speed 80 RPM and different conditions, which are listed in Table 9.13,29
Table 9. Investigation Conditions of Kinetic, Thermodynamic, and Isotherm Equations.
| kinetic equation | thermodynamic equation | isotherm equation | |
|---|---|---|---|
| time (min) | 15, 20, 25, 30 min | 30 min | 30 min |
| concentration of Cu(II) (mg L–1) | 100, 75, 50 mg L–1 | 100 mg L–1 | 10–100 mg L–1 (the difference in concentration in each experiment was 10 mg L–1) |
| temperature (°C) | 30 °C | 29, 31, 33, 35, 38 °C | 30 °C |
4.5. Factors Affecting Removal Efficiency of Cu(II)
MTC (0.05 g) adsorbed Cu(II) ions at the concentration of 100 mg L–1 at 80 RPM and with different pairs of elements (Table 10).
Table 10. Effect of Pair of Factors on Removal Efficiency of Cu(II).
| temperature-time | pH solution-time | pH solution-temperature | |
|---|---|---|---|
| temperature (°C) | 30, 40, 50, 60 °C | 30 °C | 30, 40, 50, 60 °C |
| time (min) | 10, 20, 30, 60 min | 10, 20, 30, 60 min | 30 min |
| pH solution | 6.0 | 4.0, 5.0, 6.0 | 4.0, 5.0, 6.0 |
4.6. Desorption and Reuse
Desorption: MTC (0.05 g) was added in a beaker containing 50 mL of 0.1 M HCl and stirred for 10 min. The solution was used to measure absorption to determine the desorption percentage of MTC.13
Reuse: After desorption, MTC was added into a beaker containing 0.1 M NaOH solution for neutralization; then, MTC was washed with water many times, dried at 70 °C, and could be reused.
4.7. Error Analysis
For the comparison of models in kinetic and isothermal equations, error analysis was carried out. The error functions are the sum of square of errors (SSEs) (eq 11), sum of absolute errors (SAEs) (eq 12), Chi-square (χ2) (eq 13), and standard deviation Δq (%) (eq 14), which were estimated from experimental and calculated values.
| 11 |
| 12 |
| 13 |
| 14 |
where qe,exp and qe,cal correspond to experimental and calculated adsorption capacities, respectively (mg g–1). n is the number of measurements.
For accuracy and precision of the two methods (titration and UV–vis) in the process (1), error analysis was also carried out. The error functions, which are the Student coefficient (t) (eq 15) and the Fisher coefficient (F) (eq 16), were evaluated.
| 15 |
| 16 |
where sd is the relative standard deviation; di and dtb are the differences of titration and UV–vis value and the average of di values, respectively; s is the standard deviation; xi and x̅ are the values in each experiment of titration/UV–vis and the average of xi values; ε is the absolute error; and CV is the coefficient of variation.
4.8. Analysis of Cu(II) Concentration
For analysis of Cu(II) concentration, experiments are described in Tables 11 and 12. For the preparation of the standard CuSO4 solution, it was acidified by 50 mL of 1 M H2SO4 solution before it was diluted to 1 L. The maximum absorption of the standard CuSO4 solution is observed at a wavelength of 800 nm. Therefore, the absorption values of the samples were measured at 800 nm. The functions of the absorption values versus Cadd were plotted. The regression equation for each case was built up, and its x-intercept was calculated where the linear line crossed the x-axis (at the point y = 0). The Cu(II) concentration is the absolute value of the x-intercept.
Table 11. Investigation of Optimal Conditions of Processes (2) and (3).
| no. | 1 | 2 | 3 | 4 | 5 | 6 | 7 | 8 | 9 | 10 |
|---|---|---|---|---|---|---|---|---|---|---|
| V1 (mL) | 2 | 2 | 2 | 2 | 2 | 2 | 2 | 2 | 2 | 2 |
| V2 (mL) | 26 | 28 | 30 | 32 | 34 | 36 | 38 | 40 | 42 | 44 |
| Diluted to 100 mL | ||||||||||
| Cadd (mg L–1) | 1664 | 1792 | 1920 | 2048 | 2176 | 2304 | 2432 | 2560 | 2688 | 2816 |
Table 12. Investigation of Thermodynamic, Kinetic, and Isotherm Experiments, and Effect of Factors on Adsorption, Desorption, and Reusability.
| no. | 1 | 2 | 3 | 4 | 5 |
|---|---|---|---|---|---|
| V1 (mL) | 2 | 2 | 2 | 2 | 2 |
| V2 (mL) | 30 | 32 | 34 | 36 | 38 |
| Diluted to 100 mL | |||||
| Cadd (mg L–1) | 1920 | 2048 | 2176 | 2304 | 2432 |
Here, V1 is the volume of the solution after adsorption (mL), V2 is the volume of the additional standard solution (mL), and Cadd is the additional concentration (mg L–1).
Acknowledgments
The authors are grateful to Nguyen Hoang Minh, Deputy Director of GLE Logistics, Vietnam. He helped in providing cotton resources. The authors are also grateful to the boards of HCMUE, TDTU, DTU, and Le Hong Phong High School for facilitating the experiments.
Supporting Information Available
The Supporting Information is available free of charge at https://pubs.acs.org/doi/10.1021/acsomega.0c01129.
Details and further data describing the error in titration and the UV–vis method of single-variable survey; kinetic, thermodynamic, and isotherm equations; and two-factor ANOVA with replication (PDF)
Author Contributions
The manuscript was written through contributions of all authors. All authors have given approval to the final version of the manuscript. These authors contributed equally. The authors declare that they have no conflict of interests that could influence this work.
This research could be carried out thanks to the fund raised from Ho Chi Minh City University of Education.
The authors declare no competing financial interest.
Supplementary Material
References
- Gupta V. K.; Ali I. Utilisation of bagasse fly ash (a sugar industry waste) for the removal of copper and zinc from wastewater. Sep. Purif. Technol. 2000, 18, 131–140. 10.1016/s1383-5866(99)00058-1. [DOI] [Google Scholar]
- Flemming C. A.; Trevors J. T. Copper Toxicity and Chemistry in the Environment: A Review. Water, Air, Soil Pollut. 1989, 44, 143–158. 10.1007/bf00228784. [DOI] [Google Scholar]
- Gaetke L. M.; Chow C. K. Copper toxicity, oxidative stress, and antioxidant nutrients. Toxicology. 2003, 189, 147–163. . [DOI] [PubMed] [Google Scholar]
- Ben Brahim N. B.; Poggi M.; Lambry J. C.; Mohamed N. B. H.; Chaâbane R. B.; Nergerie M. Density of grafted chains in thioglycerol-capped CdS quantum dots determines their interaction with aluminum (III) in water. Inorg. Chem. 2018, 57, 4979–4988. 10.1021/acs.inorgchem.7b03254. [DOI] [PubMed] [Google Scholar]
- Puntarulo S. Iron, oxidative stress and human health. Mol. Aspects Med. 2005, 26, 299–312. 10.1016/j.mam.2005.07.001. [DOI] [PubMed] [Google Scholar]
- Fraga C. G. Relevance, essentiality and toxicity of trace elements in human health. Mol. Aspects Med. 2005, 26, 235–244. 10.1016/j.mam.2005.07.013. [DOI] [PubMed] [Google Scholar]
- Parlak E.; Arar Ö. Removal of copper (Cu2+) from water by sulfonated cellulose. J. Dispersion Sci. Technol. 2018, 39, 1403–1408. 10.1080/01932691.2017.1405818. [DOI] [Google Scholar]
- Tang Y.; Ma Q.; Luo Y.; Zhai L.; Che Y.; Meng F. Improved synthesis of a branched poly(ethylene imine)-modified cellulose-based adsorbent for removal and recovery of Cu(II) from aqueous solution. J. Appl. Polym. Sci. 2013, 129, 1799–1805. 10.1002/app.38878. [DOI] [Google Scholar]
- Abdulkhani A.; Hosseinzadeh J.; Ashori A.; Dadashi S.; Takzare Z. Preparation and characterization of modified cellulose nanofibers reinforced polylactic acid nanocomposite. Polym. Test. 2014, 35, 73–79. 10.1016/j.polymertesting.2014.03.002. [DOI] [Google Scholar]
- Bereznitski Y.; et al. Mechanistic Aspects of Chiral Discrimination on an Amylose Tris(3,5-dimethylphenyl)carbamate. Enantiomer 2002, 7, 305–315. 10.1080/10242430215711. [DOI] [PubMed] [Google Scholar]
- Bondeson D.; Oksman K. Dispersion and characteristics of surfactant modified cellulose whiskers nanocomposites. Compos. Interfaces 2007, 14, 617–630. 10.1163/156855407782106519. [DOI] [Google Scholar]
- Phisalaphong M.; Jatupaiboon N. Biosynthesis and characterization of bacteria cellulose-chitosan film. Carbohydr. Polym. 2008, 74, 482–488. 10.1016/j.carbpol.2008.04.004. [DOI] [Google Scholar]
- Ahmad M.; Manzoor K.; Ahmad S.; Ikram S. Preparation, Kinetics, Thermodynamics, and Mechanism Evaluation of Thiosemicarbazide Modified Green Carboxymethyl Cellulose as an Efficient Cu(II) Adsorbent. J. Chem. Eng. Data 2018, 63, 1905–1916. 10.1021/acs.jced.7b01008. [DOI] [Google Scholar]
- O’Connell D. W.; Birkinshaw C.; O’Dwyer T. F. Heavy metal adsorbents prepared from the modification of cellulose: A review. Bioresour. Technol. 2008, 99, 6709–6724. 10.1016/j.biortech.2008.01.036. [DOI] [PubMed] [Google Scholar]
- Paulino A. T.; Santos L. B.; Nozaki J. Removal of Pb2+, Cu2+, and Fe3+ from battery manufacture wastewater by chitosan produced from silkworm chrysalides as a low-cost adsorbent. React. Funct. Polym. 2008, 68, 634–642. 10.1016/j.reactfunctpolym.2007.10.028. [DOI] [Google Scholar]
- Nomanbhay S. M.; Palanisamy K. Removal of heavy metal from industrial wastewater using chitosan coated oil palm shell charcoal. Electron. J. Biotechnol. 2005, 8, 43–53. 10.2225/vol8-issue1-fulltext-7. [DOI] [Google Scholar]
- Nair V.; Panigrahy A.; Vinu R. Development of novel chitosan-lignin composites for adsorption of dyes and metal ions from wastewater. Chem. Eng. J. 2014, 254, 491 10.1016/j.cej.2014.05.045. [DOI] [Google Scholar]
- Liu T.; Yang X.; Wang Z. L.; Yan X. Enhanced chitosan beads-supported Fe0-nanoparticles for removal of heavy metals from electroplating wastewater in permeable reactive barriers. Water Res. 2013, 47, 6691–6700. 10.1016/j.watres.2013.09.006. [DOI] [PubMed] [Google Scholar]
- Benavente M.; Moreno L.; Martinez J. Sorption of heavy metals from gold mining wastewater using chitosan. J. Taiwan Inst. Chem. Eng. 2011, 42, 976–988. 10.1016/j.jtice.2011.05.003. [DOI] [Google Scholar]
- Babel S.; Kurniawan T. A. Cr(VI) removal from synthetic wastewater using coconut shell charcoal and commercial activated carbon modified with oxidizing agents and/or chitosan. Chemosphere 2004, 54, 951–967. 10.1016/j.chemosphere.2003.10.001. [DOI] [PubMed] [Google Scholar]
- Aloulou F.; Boufi S.; Labidi J. Modified cellulose fibres for adsorption of organic compound in aqueous solution. Sep. Purif. Technol. 2006, 52, 332–342. 10.1016/j.seppur.2006.05.008. [DOI] [Google Scholar]
- Ahmad M.; Ahmed S.; Swami B. L.; Ikram S. Preparation and characterization of antibacterial thiosemicarbazide chitosan as efficient Cu(II) adsorbent. Carbohydr. Polym. 2015, 132, 164–172. 10.1016/j.carbpol.2015.06.034. [DOI] [PubMed] [Google Scholar]
- Yokota S.; Kitaoka T.; Wariishi H. Biofunctionality of self-assembled nanolayers composed of cellulosic polymers. Carbohydr. Polym. 2008, 74, 666–672. 10.1016/j.carbpol.2008.04.027. [DOI] [Google Scholar]
- Xiong Y.; et al. Selective recovery of Ag(I) coordination anion from simulate nickel electrolyte using corn stalk based adsorbent modified by ammonia-thiosemicarbazide. J. Hazard. Mater. 2016, 301, 277–285. 10.1016/j.jhazmat.2015.09.003. [DOI] [PubMed] [Google Scholar]
- Temerdashev Z. A.; Konshina D. N.; Logacheva E. Y.; Konshin V. V. Sorption properties of cellulose filters with covalently immobilized thiosemicarbazide. J. Anal. Chem. 2011, 66, 930–936. 10.1134/s1061934811100157. [DOI] [Google Scholar]
- Monier M.; Akl M. A.; Ali W. Preparation and characterization of selective phenyl thiosemicarbazide modified Au(III) ion-imprinted cellulosic cotton fibers. J. Appl. Polym. Sci. 2014, 131, 9277–9287. 10.1002/app.40769. [DOI] [Google Scholar]
- Nevell T. P. The mechanism of the oxidation of cellulose by periodate. J. Text. Inst. Trans. 1957, 48, T484–T494. 10.1080/19447025708660110. [DOI] [Google Scholar]
- Zumdahl S. S.; Zumdahl S. A.; DeCoste D. J.. Chemistry, 10th ed.; Cengage Learning, 2018; p A25. [Google Scholar]
- Monier M.; Akl M. A.; Ali W. M. Modification and characterization of cellulose cotton fibers for fast extraction of some precious metal ions. Int. J. Biol. Macromol. 2014, 66, 125–134. 10.1016/j.ijbiomac.2014.01.068. [DOI] [PubMed] [Google Scholar]
- Preda N.; Enculescu M.; Zgura I.; Socol M.; Matei E.; Vasilache V.; Enculescu I. Superhydrophobic properties of cotton fabrics functionalized with ZnO by electroless deposition. Mater. Chem. Phys. 2013, 138, 253–261. 10.1016/j.matchemphys.2012.11.054. [DOI] [Google Scholar]
- Dada A. O. Langmuir, Freundlich, Temkin and Dubinin–Radushkevich Isotherms Studies of Equilibrium Sorption of Zn 2+ Unto Phosphoric Acid Modified Rice Husk. IOSR J. Appl. Chem. 2012, 3, 38–45. 10.9790/5736-0313845. [DOI] [Google Scholar]
- Yang Z.; Peng H.; Wang W.; Liu T. Crystallization behavior of poly(ε-caprolactone)/layered double hydroxide nanocomposites. J. Appl. Polym. Sci. 2010, 116, 2658–2667. 10.1002/app.31787. [DOI] [Google Scholar]
- Hasan S.; Ghosh T. K.; Viswanath D. S.; Boddu V. M. Dispersion of chitosan on perlite for enhancement of copper(II) adsorption capacity. J. Hazard. Mater. 2008, 152, 826–837. 10.1016/j.jhazmat.2007.07.078. [DOI] [PubMed] [Google Scholar]
- K S. L.; C K. L.; Mak S. M. Chitosan(Chitin)/Cellulose Composite Biosorbents Prepared Using Ionic Liquid for Heavy Metal Ions Adsorption. Wood Sci Technol. 2004, 38, 629–640. 10.1002/aic.11797. [DOI] [Google Scholar]
- Hashem A. Amidoximated sunflower stalks (ASFS) as a new adsorbent for removal of Cu (II) from aqueous solution. Polym.-Plast. Technol. Eng. 2006, 45, 35–42. 10.1080/03602550500371620. [DOI] [Google Scholar]
- Shahwan T. Lagergren equation: Can maximum loading of sorption replace equilibrium loading?. Chem. Eng. Res. Des. 2015, 96, 172–176. 10.1016/j.cherd.2015.03.001. [DOI] [Google Scholar]
- Nabi S. A.; Shahadat M.; Shalla A. H.; Khan A. M. T. Removal of heavy metals from synthesis mixture as well as pharmaceutical sample via cation exchange resin modified with rhodamine B: Its thermodynamic and kinetic studies. Clean: Soil, Air, Water 2011, 39, 1120–128. 10.1002/clen.201000314. [DOI] [Google Scholar]
- Wada M. Lateral thermal expansion of cellulose Iβ and IIII polymorphs. J. Polym. Sci., Part B: Polym. Phys. 2002, 40, 1095–1102. 10.1002/polb.10166. [DOI] [Google Scholar]
- Fras L.; Stana-Kleinschek K. Quantitative determination of carboxyl groups in cellulose by complexometric titration. Lenzinger 2002, 81, 80–88. 10.1080/14328917.2004.11784850. [DOI] [Google Scholar]
- Özkahraman B.; Acar I.; Emik S. Removal of Cu 2+ and Pb 2+ Ions Using CMC Based Thermoresponsive Nanocomposite Hydrogel. Clean: Soil, Air, Water 2011, 39, 658–664. 10.1002/clen.201000553. [DOI] [Google Scholar]
- Das P.; Saikia C. N.; Dass N. N. Thermal behavior of some homogeneously polymethyl methacrylate (PMMA)-grafted high α-cellulose products. J. Appl. Polym. Sci. 2004, 92, 3471–3478. 10.1002/app.20339. [DOI] [Google Scholar]
- Zhou Y.; Hu X.; Zhang M.; Zhou X.; Niu J. Preparation and Characterization of Modified Cellulose for Adsorption of Cd(II), Hg(II), and Acid Fuchsin from Aqueous Solutions. Ind. Eng. Chem. Res. 2013, 52, 876–884. 10.1021/ie301742h. [DOI] [Google Scholar]
- Tran Buu D. T.; et al. Synthesis and redetermination of the crystal structure of salicylaldehyde N(4)-morpholinothiosemicarbazone. Acta Crystallogr., Sect. E: Crystallogr. Commun. 2019, 75, 1389–1393. 10.1107/s2056989019011812. [DOI] [PMC free article] [PubMed] [Google Scholar]
- Garcia-arrona R.; Arranz M.; Bordagaray A.; Millán E. Practical Activity for Development and Validation of a Simple UV-Spectroscopic Method for Iodate Determination in Table Salt. J. Lab. Chem. Educ. 2017, 5, 26–31. 10.1080/19447025708660110. [DOI] [Google Scholar]
Associated Data
This section collects any data citations, data availability statements, or supplementary materials included in this article.


