Abstract
Introduction:
Inadequate validation, floor/ceiling effects, and time constraints limit utilization of standardized patient-reported outcome measures. We aimed to validate Patient-reported Outcomes Measurement Information System (PROMIS) computer adaptive tests (CATs) for patients treated surgically for a lumbar disk herniation.
Methods:
PROMIS, CATs, Oswestry Disability Index, and Short Form-12 measures were administered to 78 patients treated with lumbar microdiskectomy for symptomatic disk herniation with radiculopathy.
Results:
PROMIS CATs demonstrated convergent validity with legacy measures; PROMIS scores were moderately to highly correlated with the Oswestry Disability Index and Short Form-12 physical component scores (r = 0.41 and 0.78, respectively). PROMIS CATs demonstrated similar responsiveness to change compared with legacy measures. On average, the PROMIS CATs were completed in 2.3 minutes compared with 5.7 minutes for legacy measures.
Discussion:
The PROMIS CATs demonstrate convergent and known groups’ validity and are comparable in responsiveness to legacy measures. These results suggest similar utility and improved efficiency of PROMIS CATs compared with legacy measures.
Levels of Evidence:
Level II
Delivery of health care has changed dramatically over the past several decades, with an increased interest in the assessment of the clinical outcomes of medical care. Advancements in technology and surgical techniques require feedback from patients to define effectiveness and value. To comprehensively evaluate the effect of care, there exists a need for reliable, valid, and efficient measures. Typically, treatment outcomes in patients undergoing spine surgery have relied on clinical data such as range of motion, muscle strength, and neurologic deficits.1 Although these measurements provide valuable information, they do not include the patient’s point of view concerning his or her physical function, pain, and quality of life. As the US healthcare system places an increasing focus on the value of delivered care, clinicians require improved patient outcome metrics that provide more accurate patient-centered functional assessments to both demonstrate the value and justify the costs for our clinical interventions.2
Recent developments in health care have called for a greater emphasis on evidence-driven, patient-centered care.3 Patient-reported outcome (PRO) instruments are widely used to capture the patients’ health perception, well-being, quality of life, physical function, pain, and satisfaction with care.4 The most commonly used legacy PRO measures in the lumbar spine population include the Oswestry Disability Index (ODI), the Swiss Spinal Stenosis Questionnaire, the Oxford Spinal Stenosis Questionnaire, and the Maine-Seattle Back Questionnaire.1 These traditional paper-based PRO measures have drawbacks for everyday clinical use because they are time consuming, demonstrate disease bias, and may display inaccuracies when testing patients with either severe functional disability or extreme functional ability (ie, floor and ceiling effects, respectively).2 The floor limitations of traditional PRO measures remain of great concern given the severe disability that is typically encountered with surgical spine patients. Ineffectively differentiating patients with severe pain and disability has impaired surgeons’ ability to capture meaningful differences in clinical outcomes.
The Patient-reported Outcomes Measurement Information System (PROMIS) developed a psychometrically sound and validated system of PRO measures for respondents with a wide range of chronic diseases and demographic characteristics.2 PROs assess subjective experience in ways distinct from physiologic outcomes.5 Furthermore, to shorten the time needed to complete data collection, PROMIS uses computer adaptive tests (CATs), which allow for precise and valid scores with a small subset of questions from a large collection (ie, item banks). This approach greatly reduces the time needed to complete a measure, thereby potentially increasing their utilization.1,6–11
The utility and validity of PROMIS CATs have been demonstrated in a variety of medical and surgical fields, displaying reliability, validity, flexibility, and inclusiveness in conditions such as depression, cancer, chronic obstructive pulmonary disease, and heart failure, among other pathologies.2,12–16 The PROMIS CATs have not been validated in patients with surgical lumbar disk herniation.3 Accordingly, we sought to evaluate the validity (ie, convergent validity, known groups’ validity, and responsiveness to change) of PROMIS CATs in patients receiving surgical management for symptomatic lumbar disk herniation.
Methods
Design
After obtaining the appropriate institutional approvals, all surgical patients with a symptomatic, radiographically confirmed lumbar disk herniation with radiculopathy between the age of 18 and 95 years and the ability to read and speak English were invited to participate. Any patients who presented for revision surgery, with tumors, trauma, or an infection were excluded from the study. Included patients underwent surgical management for their lumbar disk herniation (subtotal diskectomy). Each patient who agreed to participate in the study provided informed consent and thereafter invited to complete the PRO assessment with a wireless Internet-enabled iPad. Assessment Center an online data collection tool was used for data collection (www.assessmentcenter.net).
Assessments were administered preoperatively (visit 1) and postoperatively at 6 weeks (visit 2) and 3 months (visit 3) using a secure individually assigned login and password. Participants completed their baseline assessment within the clinic, whereas all postoperative assessments were completed over the phone or through Internet. Patients unable to (eg, limited hand mobility) or uncomfortable using the iPad were given the option to have the study coordinator read questions out loud and enter the participant’s response.
Measures
All three assessments included the PRO measures as described below in addition to a global rating of change and a question regarding any effective comorbid conditions.
Oswestry Disability Index
The ODI, version D17 is a self-administered questionnaire designed to assess limitations of various activities of daily living. It consists of 10 sections, each of which is scored on a 0-to-5 scale, five representing the greatest disability. The index score is calculated by dividing the summed score by the total possible score, which is then multiplied by 100 and expressed as a percentage.
Twelve-Item Short Form Survey
The 12-item Short Form survey (SF-12) is a 12-item measure that assesses physical, social, and mental function. It is summarized into a physical component (PCS) and mental component score (MCS). The SF-12 scale uses a population mean of 50 with a SD of 10, with higher scores indicating better health. A meaningful health state classification SF-6D utility score was calculated based on the SF-12 score. Individual respondents can be classified on any of four to six levels of functioning or limitations for each of six domains.
Patient-reported Outcomes Measurement Information System Physical Function, Pain Interference, and Pain Behavior Computer Adaptive Test
PROMIS CATs are administered using an algorithm that uses previous question responses to prompt subsequent targeted, relevant questions to determine the patient’s level of function or symptomatology. The measure ends when a specified level of measurement precision (standard error < 3.0) or 12 items have been answered. Reported scores use a T-score metric, with a score of 50 points reflecting the general population mean (SD = 10). The PROMIS Physical Function (PF) CAT v1.2 is administered from a bank of 121 potential items and assesses self-reported capability for physical activities. Higher scores indicate better physical functioning. The PROMIS Pain Interference (PI) CAT v1.0 measures the degree to which pain interferes with a range of activities. The item bank includes 41 items. The PROMIS Pain Behavior (PB) CAT v1.0 (item bank = 39 items) assesses the self-reported expression of pain (eg, verbal and nonverbal indications of pain). For each PROMIS pain CAT, higher scores indicate more pain.
Effective Comorbid Conditions
The effective comorbid conditions question assesses the effect of other health conditions on physical function and pain. The question “Are your answers to today’s questions being affected by any conditions (ie, arthritis, knee pain, heart disease, lung disease) other than what you are being seen for today?” is answered yes/no.
Global Rating of Change
The Global Rating of Change question assesses one’s perception of change between assessments (“How is your neck or back condition since your last visit with us?”). Responses were “much better,” “slightly better,” “about the same,” “slightly worse,” and “much worse.” This question was used to evaluate responsiveness.
Statistical Analysis
PROMIS CAT scores were exported directly from the Assessment Center system. SF-12 PCS, MCS were calculated using the QualityMetric Health Outcomes Scoring Software 4.5. ODI scores were calculated according to developers’ instructions as the percentage of total possible points. For some analyses, ODI scores were grouped in quintiles and classified into levels of disability: zero to 20% minimal disability, 21% to 40% moderate disability, 41% to 60% severe disability, 61% to 80% extreme disability, and 81% to 100% bed-bound.
Descriptive statistics were calculated for all scores at baseline to examine the level of impairment. Floor and ceiling effects were examined by determining the percentage of patients who scored at the upper and lower limits for the respective outcome instrument (Figures 1–3). Assessment time was calculated by summing the response time for each item within a measure. This time was automatically captured by Assessment Center. Convergent validity was evaluated using Pearson correlation coefficients between PROMIS CATs, the ODI, and SF-12 at baseline. Correlation values of 0.0 to 0.19, 0.20 to 0.39, 0.40 to 0.59, 0.60 to 0.79, and 0.80 to 1.0 are described as very weak, weak, moderate, strong, and very strong, respectively.
Figure 1.
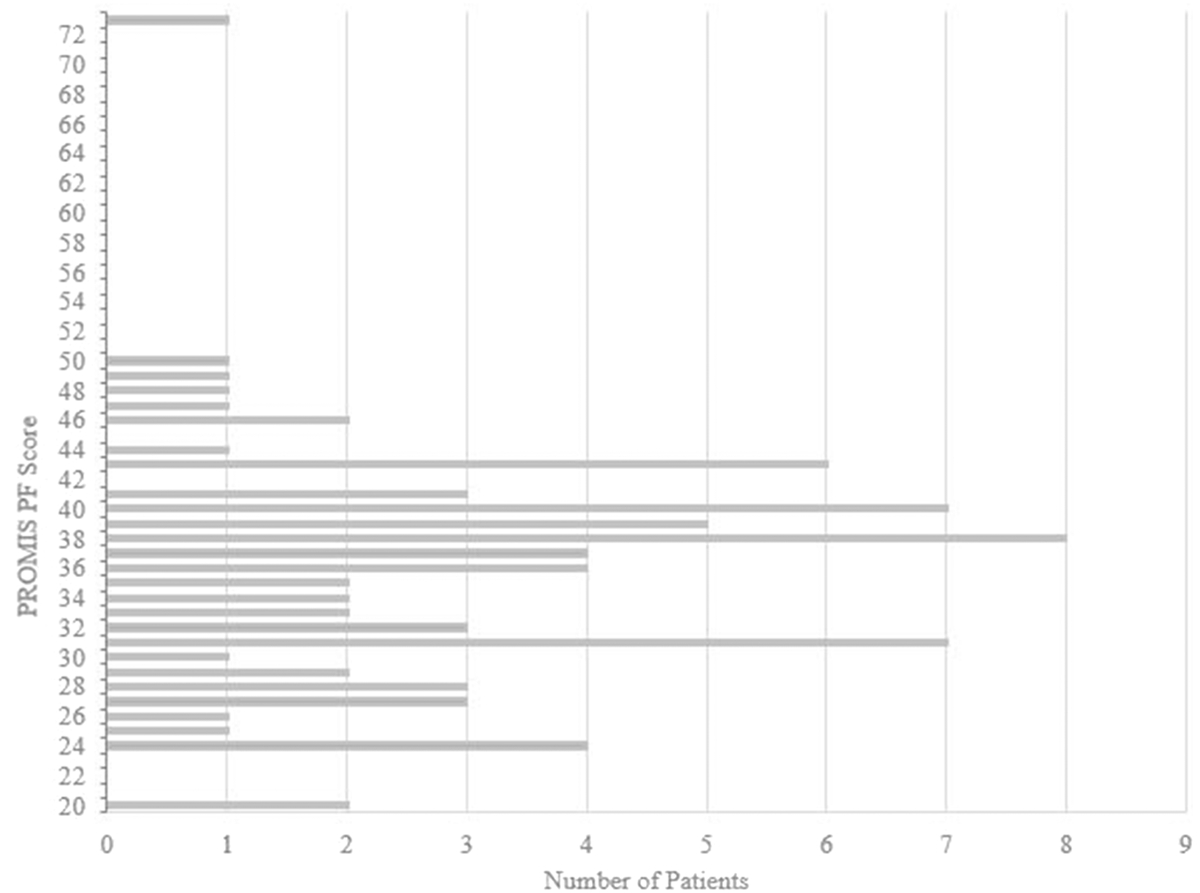
Graph showing the distribution of PROMIS PF scores aggregate across time points. PF = physical function, PROMIS = Patient-reported Outcomes Measurement Information System
Figure 3.
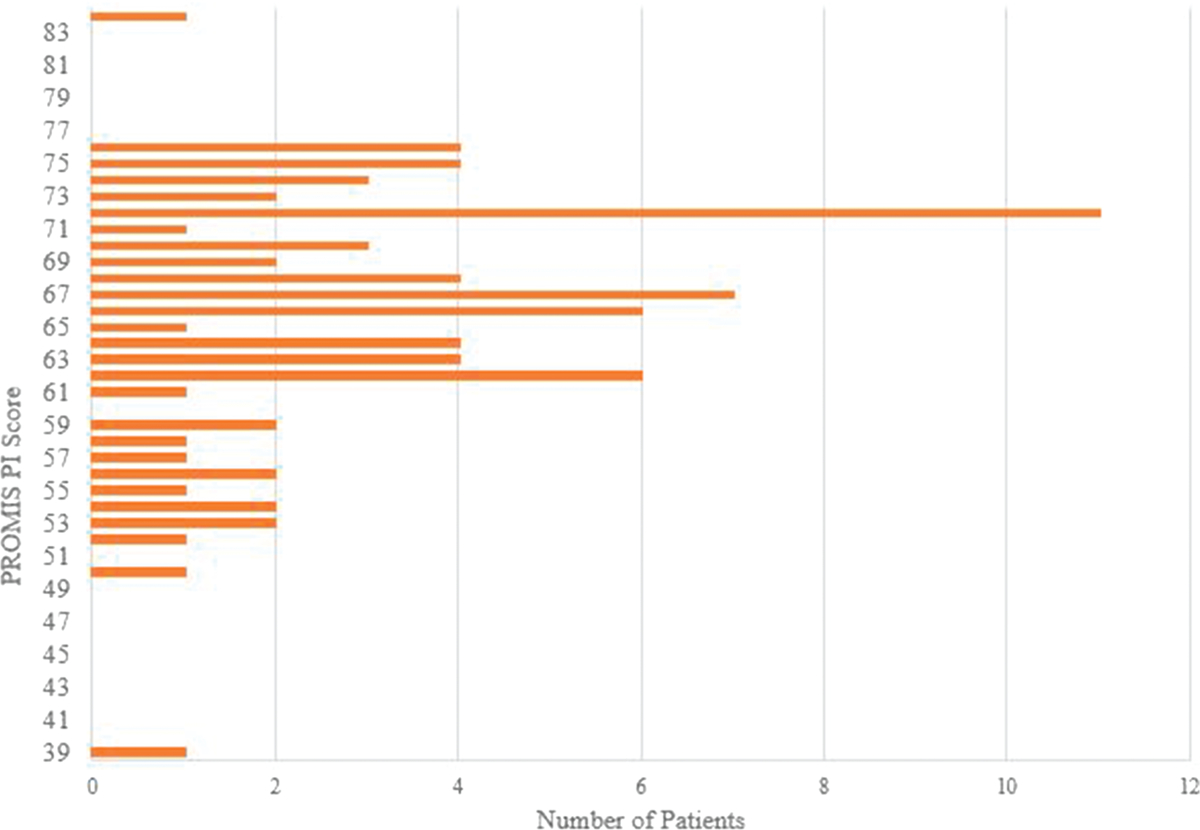
Graph showing the distribution of PROMIS PI scores aggregate across time points. PI = pain interference, PROMIS = Patient-reported Outcomes Measurement Information System
To test discriminant (known-groups) validity, patients were grouped by disease severity at baseline as measured by the ODI. PROMIS and SF-12 scores were compared between groups using 2-sample t-tests.
To evaluate responsiveness, the PROMIS CAT and legacy measures were compared across time. Changes in scores were calculated between each assessment point for all measures, and the statistical significance was evaluated using paired t-tests. Pearson correlation coefficients were also calculated using the change scores to evaluate validity over time. Changes were interpreted relative to minimal clinically important difference (MCID) thresholds reported in the literature. Although there exist few publications for MCIDs for PROMIS PB, PI, and PF measures, Amtmann et al15 recently reported that an MCID of 3.5 to 5.5 points in PROMIS PI scores may be considered meaningful in the low-back-pain patient population. Similarly, few publications review MCIDs for legacy PROs for lumbar disk herniations, so surrogate values were drawn from previously described thoracolumbar spine conditions. Available thoracolumbar spine literature reports a range of 6.8 to 14.9 point decrease in ODI as an MCID18–20 and SF-12 PCS and MCS improvement of 2.5 to 6.1 and 10.1, respectively, as an MCID.21,22 Because of variability in deriving and reporting MCID thresholds, clinicians should interpret reaching MCID thresholds in isolation with caution.23 Although no validated MCID for PROMIS measures for spine pathology have been published, an acceptable estimate currently used is 50% of the reported SD.24,27
Although we report MCIDs for legacy measures, the use of MCIDs was to attribute clinical correlation to the size of the clinical effect reported by the outcome measures. The aim of this study was not to evaluate the participants’ function and symptoms but to evaluate the performance of PROMIS measures in comparison with legacy measures.
Responsiveness to clinical change was further evaluated by stratifying patients by self-evaluation of postoperative improvements in symptom relief. The ability of outcome metrics to appropriately distinguish between patients who reported feeling “much better” against all other patient-reported changes was evaluated. The mean change from baseline scores was tested using paired t-tests. The standardized response mean = mean change/SD of change was calculated to quantify the relative level of change within these groups.
Results
Of the 78 patients enrolled (mean age = 41.6; SD = 13.4; 62% male; Table 1), 83% completed the 6-week postoperative assessment and 62% completed the 3-month postoperative assessment. Patients largely denied concomitant pathologies affecting their reported pain and function outcomes, with 95% and 83% reporting no other conditions affecting their answers on outcome measures at baseline and 3 month assessments, respectively. At baseline, patients demonstrated impairments in physical function and pain on all measures including PROMIS PF (mean = 35.9; SD = 8.0), ODI (mean = 42.4; SD = 19.0), SF-12 PCS (mean = 34.5; SD = 8.8), PROMIS PI (mean = 66.1; SD = 7.6), and PROMIS PB (mean = 60.2; SD = 6.2). Additionally, nearly half of the patients’ (48%) scores were in the crippled or severely disabled range on the ODI (Table 1).
Table 1.
Patient Characteristics (n = 78)
| Factor | Mean (SD) | Median (Range) |
|---|---|---|
| Age (yr) | 41.6 (13.4) | 39 (20–72) |
| Sex (no. of pts) | ||
| Male | 48 | 62% |
| Female | 30 | 38% |
| Race (no. of pts) | ||
| Not provided | 9 | 12% |
| White | 56 | 72% |
| Black | 4 | 5% |
| Asian | 3 | 4% |
| Other | 6 | 8% |
| Ethnicity (no. of pts) | ||
| Not provided | 9 | 12% |
| Not Hispanic or Latino | 67 | 86% |
| Hispanic or Latino | 2 | 3 |
| Baseline ODI (n = 1 missing) | ||
| No. of pts with minimal disability (0%−20%) | 10 | 13% |
| No. of pts with moderate disability (21%−40%) | 30 | 39% |
| No. of pts with severe disability (41%−60%) | 21 | 27% |
| No. of pts crippled (61%−80%) | 16 | 21% |
ODI = Oswestry Disability Index
The three PROMIS instruments took an average of 2.3 minutes in total to complete, with individual CAT completion times of 0.9 minutes for PB (SD = 1.0), 0.6 minutes for PI (SD = 0.6), and 0.8 minutes for PF (SD = 0.8). These data compare favorably with the completion times for the ODI and SF-12, which took an average of 5.7 minutes in total to complete, with individual completion times of 2.7 and 3.0 minutes, respectively (Table 2). PROMIS outcome measures demonstrated minimal floor and ceiling effects at baseline (Figure 4). The ODI and SF-12 exhibited minimal ceiling effects in this sample as well (Figure 5).
Table 2.
Time to Complete in Minutes
| Completion time (min) | ||||
|---|---|---|---|---|
| Factor | N | Mean | SD | Median |
| PROMIS PB | 76 | 0.9 | 1.0 | 1.0 |
| PROMIS PI | 78 | 0.6 | 0.6 | 1.0 |
| PROMIS PF | 78 | 0.8 | 0.7 | 1.0 |
| Oswestry Disability Index | 71 | 2.7 | 1.3 | 2.0 |
| SF-12 | 75 | 3.0 | 1.8 | 3.0 |
PB = pain behavior, PF = physical function, PI = pain interference, PROMIS = Patient-reported Outcomes Measurement Information System, SF = Short Form
Figure 4.
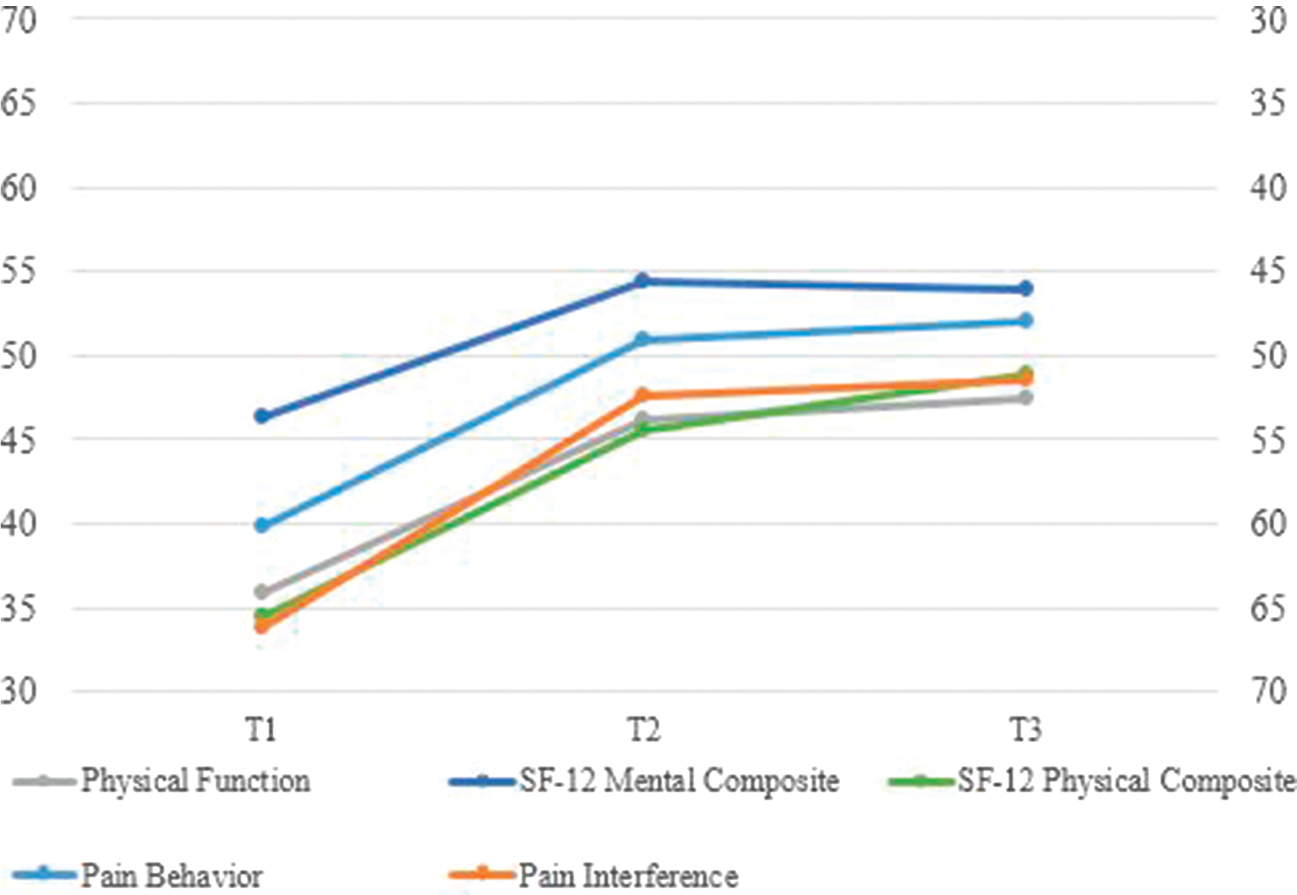
Graph showing the change in Patient-reported Outcomes Measurement Information System T-Scores and SF physical component score and mental component score composite score over time. SF = Short Form
Figure 5.
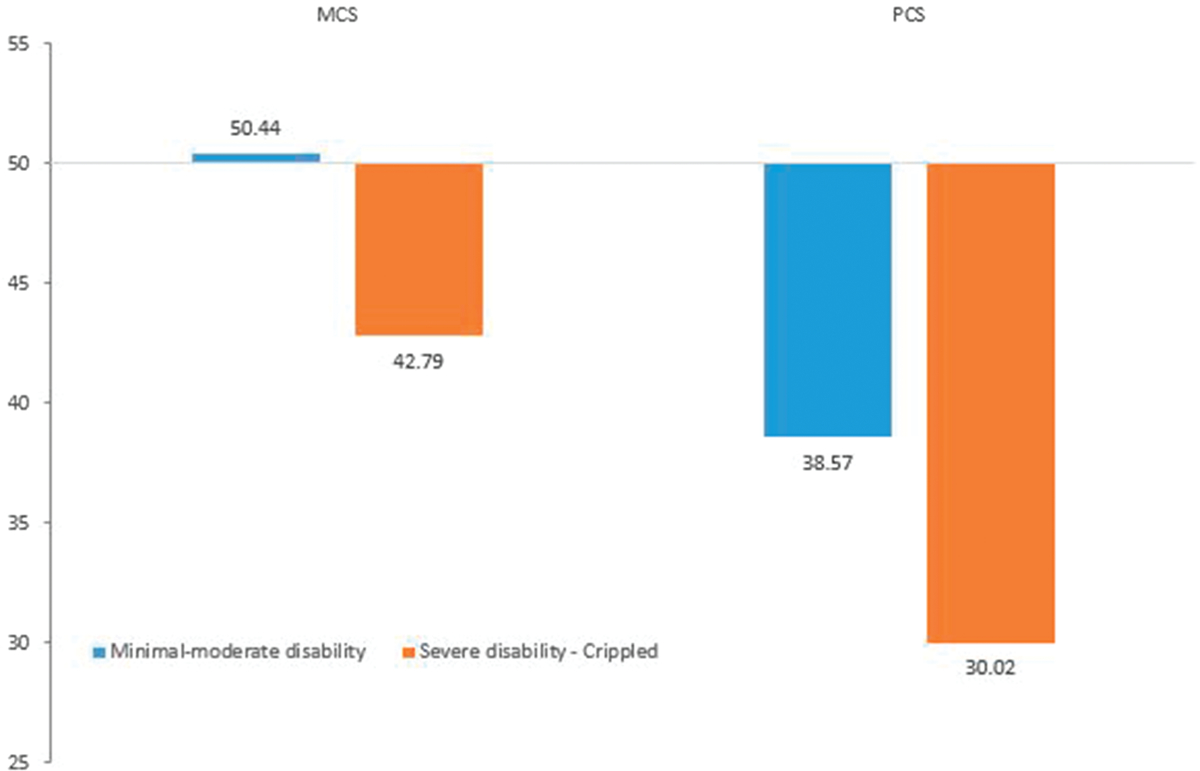
Graph showing the Short Form-12 scores by Oswestry Disability Index severity groups. MCS = mental component score, PCS = pain behavior score
Convergent validity was supported with moderate to strong correlations in the expected direction at baseline between PROMIS CATs and legacy measures. PROMIS PF, PI, and PB correlated strongly with ODI scores (r = −0.78, r = 0.78, and r = 0.58, respectively, each P < 0.01). Similarly, SF-12 PCS was strongly correlated with PROMIS PF (r = 0.61; P < 0.01). SF-12 MCS had a moderate correlation with PROMIS PB and PI as well (r = −0.47 and r = −0.47, respectively; each P < 0.01). Correlations were of similar magnitude when examining the change from baseline to month 3 (Table 3).
Table 3.
Pearson Correlation Coefficients Between Measures
| Factor | PROMIS PB | PROMIS PI | PROMIS PF |
|---|---|---|---|
| Baseline | |||
| ODI score | 0.58a | 0.78a | −0.78a |
| SF-12 PCS | −0.41a | −0.59a | 0.61a |
| SF-12 MCS | −0.47a | −0.47a | 0.38a |
| SF-6D utility | −0.63a | −0.80a | 0.73a |
| Change from baseline to month 3 | |||
| ODI score | 0.60a | 0.73a | −0.66a |
| SF-12 PCS | −0.60a | −0.77a | 0.56a |
| SF-12 MCS | −0.20 | 0.05 | 0.17 |
| SF-6D utility | −0.61a | −0.70a | 0.63a |
MCS = mental component score, ODI = Oswestry Disability Index, PB = pain behavior, PCS = physical component score, PF = physical function, PI = pain interference, PROMIS = Patient-reported Outcomes Measurement Information System, SF = Short Form
P < 0.01.
This disk herniation patient population reported a substantial number of individuals with severe disability as determined by the baseline ODI score (severe disability 27% and crippled 21%). To test discriminant (known-groups) validity, patients were grouped by disease severity at baseline as measured by the ODI. Patients who were severely or extremely disabled reported worse PROMIS, SF-12, and ODI scores compared with patients with minimal-moderate disability (Table 4, all P < 0.01). Effect sizes were large and ranged from 0.77 (MCS) to 1.60 (PROMIS PI).
Table 4.
PROMIS and SF-12 Scores at Baseline by Oswestry Disability Index Severity Group
| Factor | Minimal-moderate Disability n = 40 Mean (SD) |
Severe Disability or Crippled n = 37 Mean (SD) |
P Value | Mean Difference | Effect Size |
|---|---|---|---|---|---|
| PROMIS | |||||
| PB | 57.2 (6.9) | 63.2 (3.2) | <0.001 | 5.9 | 1.09 |
| PI | 61.5 (6.9) | 70.7 (4.2) | <0.001 | 9.2 | 1.60 |
| PF | 40.4 (7.4) | 31.1 (5.6) | <0.001 | −9.4 | −1.42 |
| SF-12 | |||||
| MCS | 50.4 (9.6) | 42.8 (10.3) | 0.001 | −7.6 | −0.77 |
| PCS | 38.6 (8.1) | 30.0 (7.5) | <0.001 | −8.6 | −1.10 |
| SF-6D | 0.63 (0.11) | 0.50 (0.07) | <0.001 | −0.13 | −1.36 |
MCS = mental component score, PB = pain behavior, PCS = physical component score, PF = physical function, PI = pain interference, PROMIS = Patient-reported Outcomes Measurement Information System, SF = Short Form Effect size = mean difference/pooled SD.
After surgical management of the lumbar disk herniation(s), 85% and 94% of patients reported ODI score decreases of at least 10 points from baseline by the 6-week and 3-month postoperative time points, respectively, with most improvements in pain, disability, and function appearing early in the postoperative course and plateauing by the 3-month follow-up (Figures 4, 6). Physical function and pain also improved after surgery across all measures as expected. Change scores for PROMIS PB and PI had decreases of 13.1 and 16.5, respectively, between baseline and 3-month postoperative follow-up (each P < 0.001), whereas PROMIS PF increased 12.3 points over the same period (P < 0.001). The other legacy measures demonstrated score changes consistent with the observed trend seen with PROMIS CATs. ODI scores decreased an average of −33.4 points. SF-12 PCS increased 14.5 and MCS increased 8.6 points (each P < 0.001). These observed improvements in PROMIS and legacy measure scores are clinically relevant as well, with each of the PROMIS subscores and the SF-12 PCS and ODI legacy measures exceeding reported MCID thresholds.
Figure 6.
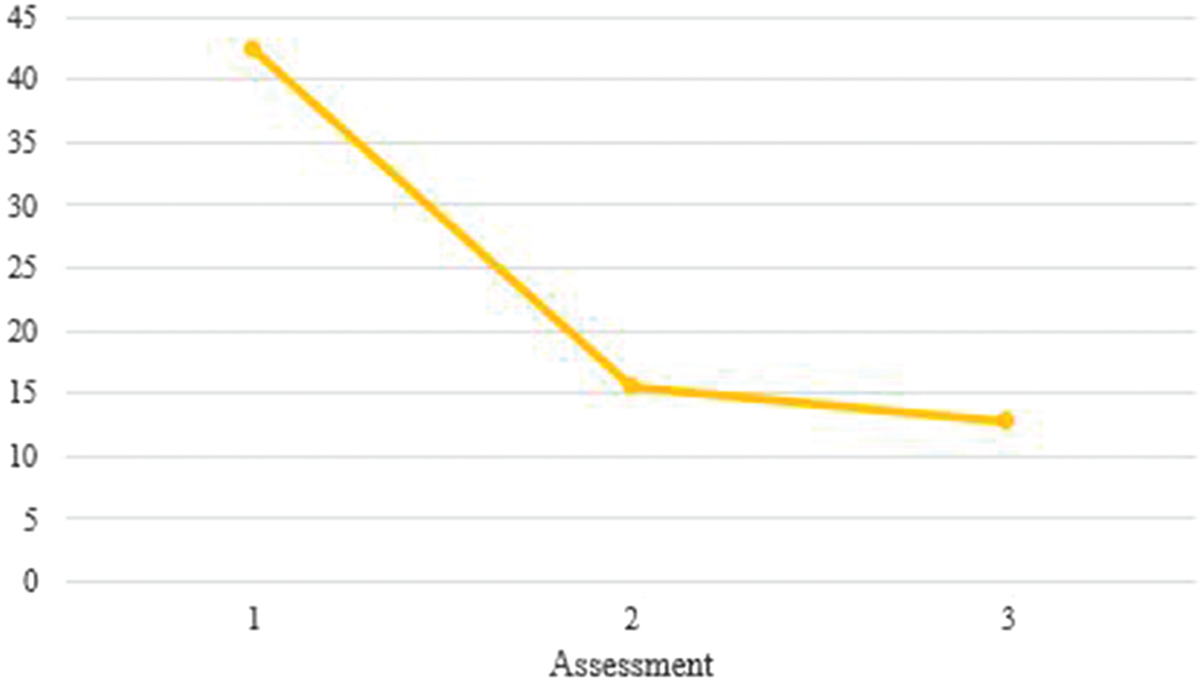
Graph showing the change in the Oswestry Disability Index over time.
The sample was divided into subgroups based on self-reported change (“much better” versus all others). Comparing baseline with 6-week follow-up (visit 1 versus visit 2), the improved group reported improvement in PROMIS PB, PI, and PF (–13.0, –16.3, and 12.1, respectively) and in SF-12 PCS (13.5), SF-12 MCS (10.0), and ODI (–34.4; SD 19.6) (see Table 5, Supplemental Digital Content 1, http://links.lww.com/JAAOS/A135). Standardized response means ranged from 0.94 (MCS) to 2.03 (PI) for this group, and from 0.53 (MCS) to 1.34 (PCS) for the group of patients who were only slightly better, unchanged, or worse. The difference in change scores was statistically significant (P < 0.05) only for PROMIS PI and PF and ODI, although sample sizes were small.
Discussion
This study demonstrates convergent validity, responsiveness, and known groups’ validity of the PROMIS PF, PI, and PB CATs in patients undergoing a lumbar disk herniation surgery through strong correlations with other measures of the same constructs, ability to distinguish those with notable clinical improvement from others, and ability to distinguish diagnostic groups. To our knowledge, this is also the first assessment of the validity of PROMIS CATs for PF, PI, and PB in patients with lumbar disk herniation who were treated surgically.
The PROMIS CAT allows efficient and precise PRO measurements by eliminating irrelevant or redundant items.8 Unlike the classical test theory that requires respondents to complete all (or most) questions to determine a test score, the PROMIS CATs are able to obtain a patient’s responses based on their function or symptom level by customizing the items that are administered.14 On average, the three PROMIS CATs were obtained in 2.3 minutes compared with 5.7 minutes for the two legacy measures (Table 2). The notable reduction in time to complete the PROMIS CATs is most likely due to the fewer number of questions that are administered (range, 4 to 12 per CAT; median, 4) compared with the legacy measures (range, 10 to 12). These findings are strongly supported by two publications by Papuga et al25 and Brodke et al.26 The study by Papuga et al25 demonstrated a strong correlation of PROMIS CATs with ODI scores in a population presenting for routine clinic visits. Furthermore, they showed a markedly decreased time to complete the PROMIS CATs compared with the legacy measures. Brodke et al26 in a study of over 1,600 patients presenting for a clinic visit also demonstrated a significant correlation of PROMIS CATs with ODI and SF-36 scores as well as less time to complete the CATs.
The PROMIS tools were also able to accurately capture the patient’s physical and pain health status while avoiding floor and ceiling effects. This ability is particularly important in the patient population we studied because nearly half of the sample (48%) were crippled or severely disabled (Table 1). Using a website-based data collection model for PROMIS instruments allows for tracking completion times, time and date stamps on responses, immediate scoring, and automated tracking of missing data. Although CATs require a computer for administration, their advantage in speed and measurement precision facilitate making self-reported health status information available in real time during a clinical encounter. This information can be used by healthcare providers to facilitate assessment of the patient, treatment evaluation, or planning. Patients could also use PRO information to track their personal health and facilitate communications with their surgeon.
Although using PROMIS has several benefits, our study also had limitations. First, the small sample size limits rigorous subgroup analysis. However, we think that the statistically significant correlations found between multiple PROMIS and legacy PROs as well as the responsiveness seen with PROMIS measures within the patient self-rated function groups are clinically relevant. Furthermore, all website-based administrations of the PROMIS CATs require the patient to have computer to complete the outcome measures. The number of patients who completed their 1 year postoperative follow-up assessment was markedly lower, thus indicating that a large number had been lost to follow-up. This finding is consistent with much of the spine surgical literature. Additionally, the 3-month follow-up may not be of sufficient time since treatment to capture clinically significant outcomes. Parker et al28 suggested 12-month follow-up because they found that 3 month ODI MCID for lumbar surgery predicted 12-month MCID thresholds with only 62.6% specificity and 86.8% sensitivity. However, for the validation purposes of this study, lengthy follow-up to assess treatment outcomes was unnecessary. Although we report MCIDs for legacy measures, the use of MCIDs was to attribute the clinical correlation to the size of the clinical effect reported by the outcome measures. The aim of this study was not to evaluate the participants’ function and symptoms but to evaluate the performance of PROMIS measures in comparison with legacy measures. Finally, our study included only English-speaking patients, and as such, the findings may not be generalizable to non–English-speaking patients.
Despite potential limitations, we found that PROMIS can be incorporated in a busy surgical practice with minimal additional time and resources required. In addition, our results suggest good evidence of responsiveness, convergent, and known group validity. We found the real-time scoring and interpretation provided by PROMIS improved our ability to capture accurate and meaningful functional outcome data.
Conclusions
PROMIS CATs for PB, PI, and PF demonstrate responsiveness and convergent and known groups’ validity among patients surgically treated for a lumbar disk herniation. PROMIS CATs perform comparably against commonly used PRO measures and require less time to complete. The PROMIS CATs demonstrate advantages compared with the standard legacy instruments through improved efficiency in measuring the treatment effect. Because of these advantages, we suggest the PROMIS CATs can be a useful, efficient, and practical tool for tracking patient outcomes after surgical management of lumbar disk herniation.
Supplementary Material
Figure 2.
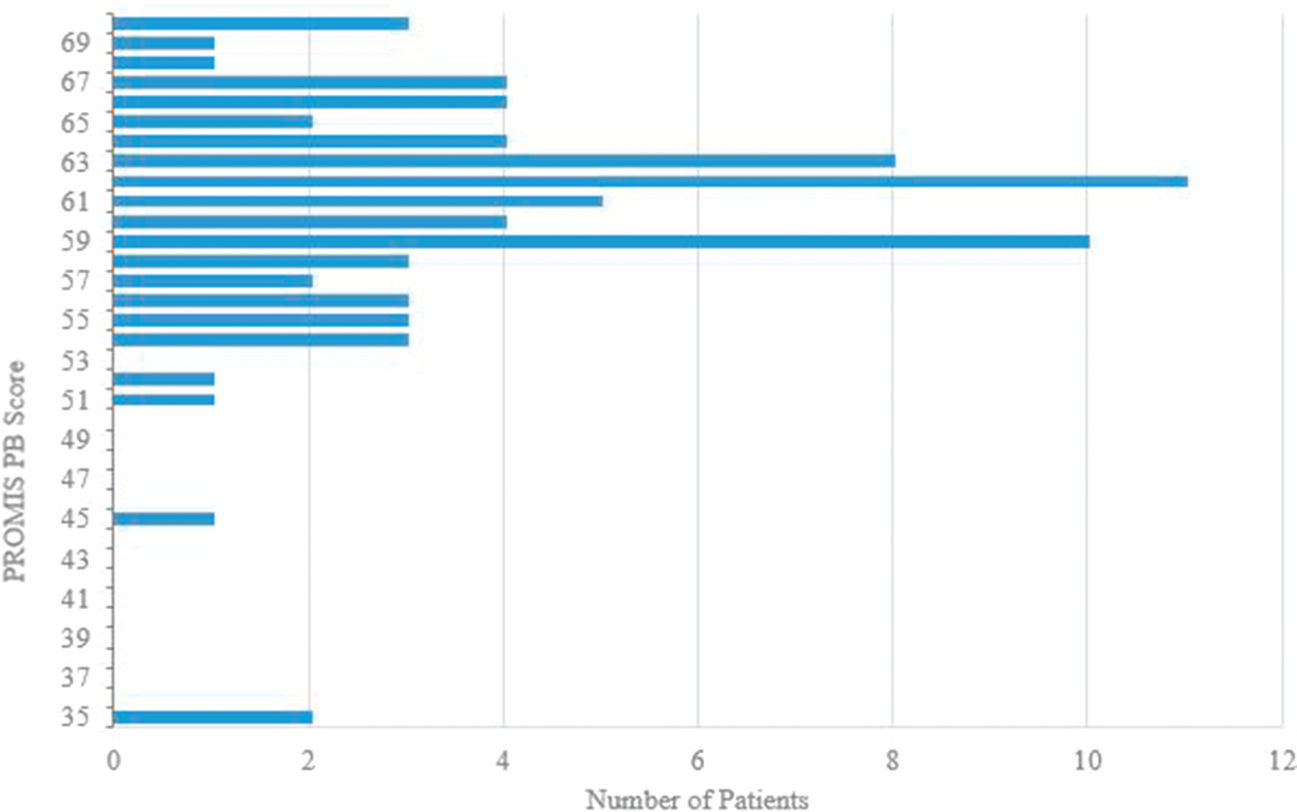
Graph showing the distribution of PROMIS PB scores aggregate across time points. PB = pain behavior, PROMIS = Patient-reported Outcomes Measurement Information System
Biography
Dr. Savage or an immediate family member serves as a paid consultant to Stryker. Dr. Hsu or an immediate family member has received royalties from Stryker; is a member of a speakers’ bureau or has made paid presentations on behalf of AONA; serves as a paid consultant to Allosource, AONA, CeramTec, Globus Medical, Graftys, Medtronic Sofamor Danek, Mirus, RTI, Stryker, and Xtant; has received research or institutional support from Medtronic, serves as a board member, owner, officer, or committee member of the American Academy of Orthopaedic Surgeons, the Cervical Spine Research Society, the Lumbar Spine Research Society, and the North American Spine Society. Dr. Rothrock or an immediate family member has received research or institutional support from AO Patient Outcomes Center US. Dr. Patel or an immediate family member has received royalties from Amedica and Zimmer Biomet; serves as a paid consultant to Amedica, Pacira Pharmaceuticals, and Zimmer Biomet; has stock or stock options held in Amedica, Cytonics, Nocimed, nView Medical, and Vital5; serves as a board member, owner, officer, or committee member of the American Orthopaedic Association, AO Spine North America, the Cervical Spine Research Society, the International Society for the Advancement of Spine Surgery, the Lumbar Spine Research Society, and the North American Spine Society. Neither of the following authors nor any immediate family member has received anything of value from or has stock or stock options held in a commercial company or institution related directly or indirectly to the subject of this article: Ms. Bhatt and Dr. Boody.
References
Evidence-based Medicine: Levels of evidence are described in the table of contents. In this article, references 2–4 are level IV studies. References 1 and 5 are level V reports or expert opinions.
- 1.McCormick JD, Werner BC, Shimer AL: Patient-reported outcome measures in spine surgery. J Am Acad Orthop Surg 2013;21: 99–107. [DOI] [PubMed] [Google Scholar]
- 2.Cooks KF, Jensen SE, Schalet BD, et al. : PROMIS® measures of pain, fatigue, negative affect, physical function and social function demonstrate clinical validity across a range of chronic conditions. J Clin Epidemiol 2016;73:89–102. [DOI] [PMC free article] [PubMed] [Google Scholar]
- 3.Marshall S, Haywood K, Fitzpatrick R: Impact of patient-reported outcome measures on routine practice: A structured review. J Eval Clin Pract 2006;12:559–568. [DOI] [PubMed] [Google Scholar]
- 4.Hung M, Clegg DO, Greene T, Saltzman CL. Evaluation of the PROMIS physical function item bank in orthopaedic patients. J Orthop Res 2011;29:947–953. [DOI] [PubMed] [Google Scholar]
- 5.Cella D, Yount S, Rothrock N, et al. : The Patient-Reported Outcomes Measurement Information System (PROMIS): Progress of an NIH roadmap cooperative group during its first two years. Med Care 2007;45(5 suppl 1):S3–S11. [DOI] [PMC free article] [PubMed] [Google Scholar]
- 6.Choi SW: Firestar: Computerized adaptive testing simulation program for polytomous item response theory models. Appl Psychol Meas 2009;33:644–645. [Google Scholar]
- 7.Fitzpatrick R, Davey C, Buxton MJ, Jones DR: Evaluating patient-based outcome measures for use in clinical trials. Health Technol Assess 1998;2:1–74. [PubMed] [Google Scholar]
- 8.Fries JF, Bruce B, Cella D: The promise of PROMIS: Using item response theory to improve assessment of patient-reported outcomes. Clin Exp Rheumatol 2005;23(5 suppl 39):S53–S57. [PubMed] [Google Scholar]
- 9.Revicki DA, Cella DF: Health status assessment for the twenty-first century: Item response theory, item banking and computer adaptive testing. Qual Life Res 1997;6:595–600. [DOI] [PubMed] [Google Scholar]
- 10.Weiss DJ: Computerized adaptive testing for effective and efficient measurement in counseling and education. Meas Eval Couns Dev 2004;37:70–84. [Google Scholar]
- 11.Godil SS, Parker SL, Zuckerman SL, et al. : Determining the quality and effectiveness of surgical spine care: Patient satisfaction is not a valid proxy. Spine J 2013;13:1006–1012. [DOI] [PubMed] [Google Scholar]
- 12.Jensen RE, Potosky AL, Reeve BB, et al. : Validation of the PROMIS physical function measures in a diverse US population-based cohort of cancer patients. Qual Life Res 2015;24:2333–2344. [DOI] [PMC free article] [PubMed] [Google Scholar]
- 13.Hung M, Baumhauer JF, Latt LD, et al. : Validation of PROMIS ®physical function computerized adaptive tests for orthopaedic foot and ankle outcome research. Clin Orthop Relat Res 2013;471:3466–3474. [DOI] [PMC free article] [PubMed] [Google Scholar]
- 14.Flynn KE, Dew MA, Lin L, et al. : Reliability and construct validity of PROMIS measures for patients with heart failure who undergo heart transplant. Qual Life Res 2015;24:2591–2599. [DOI] [PMC free article] [PubMed] [Google Scholar]
- 15.Amtmann D, Kim J, Chung H, et al. : Comparing CESD-10, PHQ-9, and PROMIS depression instruments in individuals with multiple sclerosis. Rehabil Psychol 2014;59:220–229. [DOI] [PMC free article] [PubMed] [Google Scholar]
- 16.Irwin DE, Atwood CA Jr, Hays RD, et al. : Correlation of PROMIS scales and clinical measures among chronic obstructive pulmonary disease patients with and without exacerbations. Qual Life Res 2015; 24:999–1009. [DOI] [PMC free article] [PubMed] [Google Scholar]
- 17.Fairbank JCT, Couper J, Davies JB, O’Brian JP: The Oswestry low back pain disability questionnaire. Physiotherapy 1980;66:271–273. [PubMed] [Google Scholar]
- 18.Parker SL, Mendenhall SK, Shau DN, et al. : Minimum clinically important difference in pain, disability, and quality of life after neural decompression and fusion for same-level recurrent lumbar stenosis: Understanding clinical versus statistical significance. J Neurosurg Spine 2012;16:471–478. [DOI] [PubMed] [Google Scholar]
- 19.Parker SL, Mendenhall SK, Shau D, et al. : Determination of minimum clinically important difference in pain, disability, and quality of life after extension of fusion for adjacent-segment disease. J Neurosurg Spine 2012;16:61–67. [DOI] [PubMed] [Google Scholar]
- 20.Parker SL, Adogwa O, Paul AR, et al. : Utility of minimum clinically important difference in assessing pain, disability, and health state after transforaminal lumbar interbody fusion for degenerative lumbar spondylolisthesis. J Neurosurg Spine 2011;14:598–604. [DOI] [PubMed] [Google Scholar]
- 21.Parker SL, Mendenhall SK, Shau DN, et al. : Determination of minimum clinically important difference (MCID) in pain, disability, and quality of life after revision fusion for symptomatic pseudoarthrosis. Spine J 2012;12:1122–1128. [DOI] [PubMed] [Google Scholar]
- 22.Parker SL, Mendenhall SK, Shau DN, et al. : Determination of minimum clinically important difference (MCID) in pain, disability, and quality of life after revision fusion for same-level recurrent lumbar stenosis: Understanding clinical versus statistical significance. J Neurosurg Spine 2012;16:471–478. [DOI] [PubMed] [Google Scholar]
- 23.Copay AG, Martin MM, Subach BR,et al. : Assessment of spine surgery outcomes: Inconsistency of change amongst outcome measurements. Spine J 2010;10:291–296. [DOI] [PubMed] [Google Scholar]
- 24.Norman GR, Sloan JA, Wyrwich KW: Interpretation of changes in health-related quality of life: The remarkable universality of half a standard deviation. Med Care 2003;41:582–592. [DOI] [PubMed] [Google Scholar]
- 25.Papuga MO, Mesfin A, Molinari R, Rubery PT. Correlation of PROMIS physical function and pain CAT instruments with Oswestry Disability Index and Neck Disability Index in Spine patients. Spine (Phila Pa 1976) 2016;41:1153–1159. [DOI] [PMC free article] [PubMed] [Google Scholar]
- 26.Brodke DS, Goz V, Voss MW, Lawrence BD, Spiker WR, Hung M. PROMIS PF CAT outperforms the ODI and SF-36 physical function domain in Spine patients. Spine (Phila Pa 1976) 2017;42: 921–929. [DOI] [PMC free article] [PubMed] [Google Scholar]
- 27.Beaton DE: Simple as possible? Or too simple? Possible limits to the universality of the one half standard deviation. Med Care 2003;41:593–596. [DOI] [PubMed] [Google Scholar]
- 28.Parker SL, Asher AL, Godil SS, Devin CJ, McGirt MJ: Patient-reported outcomes 3 months after spine surgery: Is it an accurate predictor of 12-month outcome in real-world registry platforms? Neurosurg Focus 2015;39:E17. [DOI] [PubMed] [Google Scholar]
Associated Data
This section collects any data citations, data availability statements, or supplementary materials included in this article.


