

Abstract
Purpose:
To estimate racial/ethnic-stratified effects of maternal pre-pregnancy BMI on size for gestational age at birth, by comparing siblings within families.
Methods:
This study examined linked vital statistics and patient discharge data from 580,960 infants born to 278,770 women in the State of California (2007-2012). To control for family-level confounding, we used fixed effects multinomial regression, modelling size for gestational age (small [SGA], appropriate, large [LGA]) as a function of maternal BMI (underweight, normal weight, overweight, obesity class I, II, III) and time-varying covariates. We conducted overall and race/ethnicity-stratified (non-Hispanic white, black, Asian; Hispanic) analyses. For comparison, we fit analogous random effects models, which do not control for family-level confounding.
Results:
In fixed effects models, maternal BMI was most strongly associated with LGA in non-Hispanic white women, reaching 6.7 times greater for class III obesity [OR (95% CI): 6.7 (5.1, 8.7)]; and weakest in black women [OR (95% CI): 3.0 (1.5, 5.7)]. Associations with SGA were similar across race/ethnicity. Compared to random effects estimates, fixed effects were most attenuated for LGA associations among racial/ethnic minority women.
Conclusions:
Maternal pre-pregnancy BMI was differentially associated with size for gestational age across racial/ethnic groups, with the strongest family-level confounding in racial/ethnic minority women.
Keywords: Obesity, pregnancy, birth weight, race/ethnicity
INTRODUCTION
Women with higher body mass index (BMI) prior to pregnancy have greater risk of adverse birth outcomes, including higher birth weight at delivery.1,2 Small or large size at birth (SGA, LGA) are important predictors of greater obesity and cardiometabolic risk in the offspring,3 and LGA is a determinant of adverse pregnancy outcomes (e.g., cesarean section).4 However, associations between pre-pregnancy maternal BMI on birth size vary by race/ethnicity: associations are stronger in racial/ethnic minority women in some studies, and weaker in others.5,6 Furthermore, the reasons underlying these subgroup differences are unknown.
At any given level of BMI, racial/ethnic minority groups may exhibit distinct metabolic profiles,7 potentially due to early life exposures,8,9higher total adiposity, or greater visceral fat.10–12 Because these factors are socially patterned, a given maternal BMI may incur greater perinatal risk in some racial/ethnic minorities. Alternatively, unmeasured confounding by familial or contextual factors may be stronger in racial/ethnic minority groups; thus, confounding, rather than true differences in maternal obesity effects, may explain observed racial/ethnic differences. Similarly, contextual factors that may buffer or strengthen maternal BMI-outcome associations (e.g., social support, built and chemical environments) also vary by race/ethnicity, but such effect measure modifiers are typically unmeasured. A handful of studies use within-family study design to control for unmeasured confounding by family-level factors,13,14 comparing outcomes among siblings born to the same woman who had varying BMI prior to each pregnancy.13–19 Despite possible racial/ethnic differences in confounders and effect modifiers, within-family associations of pre-pregnancy maternal BMI on size at birth have not been examined within racial/ethnic subgroups. Robust estimates of racial/ethnic-specific effects of pre-pregnancy maternal BMI on size at birth are needed to inform the extent to which promotion of preconception weight loss may benefit minority subgroups, who carry the greatest burden of pre-pregnancy obesity20 and adverse birth outcomes.21,22
Our objective was to estimate racial/ethnic-specific effects of maternal pre-pregnancy BMI on size at birth by comparing siblings within families. We leverage a study population of over 500,000 infants born to over 250,000 women in the racially and ethnically diverse U.S. State of California. We hypothesized that (a) greater maternal pre-pregnancy BMI is more strongly associated with higher size for gestational age in racial/ethnic minority women and (b) compared to between-family associations, within-family associations are more strongly attenuated in racial/ethnic minority women.
METHODS
Study population
We analyzed the California Office of Statewide Health Planning & Development (OSHPD) linked vital statistics/patient discharge database, which contains linked vital statistics data and hospital discharge data for all California deliveries (2007-2012). This study was approved by California OSHPD and by the Oregon Health & Science University Institutional Review Board.
Of 3,067,223 births in the database (Figure 1), 258,481 were excluded due to implausible birth weight (>4 SD from the sex- and gestational age-specific mean birth weight;23 0.2%) or gestational age (<23 weeks or >43 weeks; 0.4%), intrauterine fetal death (fetal death certificate or International Classification of Diseases, 9th revision, clinical modification [ICD-9] code 656.4 or 768.0; 0.3%), or congenital anomalies of the infant (ICD-9 74x and 75x; 7.6%). We excluded multiple births (birth certificate or ICD-9 651; 2.6%) due to their distinct fetal growth patterns; and births to adolescent mothers (<20 years of age at delivery; 7.9%) due to distinct risks and ambiguous classification of BMI in adolescent pregnancies.24,25
FIGURE 1. Construction of analytic sample.

California Office of Statewide Health Planning & Development Linked Vital Statistics/Patient Discharge Database (2007-2012)
Among 2,485,659 live, non-anomalous, singleton births to adult women, we identified siblings born to the same woman using an anonymized maternal identification number constructed by California OSHPD (excluded 543,815 births with missing maternal ID; 21.9%). We excluded births to mothers with 1 (46.8%) or ≥5 pregnancies (0.02%) in the dataset; 5 pregnancies in a 5-year period likely reflects linkage error or numerous atypically short interpregnancy intervals. Among the remaining 778,675 births, we excluded 80,842 records with missing maternal pre-pregnancy weight (6.1%), delivery weight (1.1%), or height (0.5%); and 20,703 births to mothers with “other” or unknown race/ethnicity (2.7%). Finally, as our study question pertained to sibling-sets, we excluded births whose sibling had been excluded due to any of the above criteria (116,873 births). Our final analytic sample comprised 580,960 births to 269,871 unique mothers.
Study variables
The exposure of interest was maternal pre-pregnancy BMI, calculated from self-reported maternal height and pre-pregnancy weight recorded on the birth record. Because height does not typically change in adulthood, maternal height was ascertained from the first pregnancy; height was identical between the first and subsequent pregnancies for all but 95,995 births (16.5%), with a mean difference of −0.002 cm (SE: 0.006 cm). Pre-pregnancy BMI was categorized into underweight (<18.5 kg/m2), normal weight (≥18.5 and <25), overweight (≥25 and <30), and obesity class I (≥30 and <35), II (≥35 and <40), and III (≥40) to accommodate non-linear associations and align with clinical cutpoints. Analysis of continuous maternal BMI with higher order terms would enable estimation of risk associated with incremental differences in pre-pregnancy BMI, recognizing non-linear associations; however, higher order terms in fixed effects models cannot be interpreted as within-person effects.26
The primary outcomes of interest were size for gestational age (SGA [<10th%ile] and LGA [>90th%ile] compared to appropriate [AGA]) because it is most closely linked to intrauterine development relevant to future disease risk.27,28 For comparison with prior research, we examined birth weight as a secondary outcome (low birth weight [LBW, <2500 gm] and macrosomia [>4000 gm]). Categorization of outcomes recognized that small and large size at birth are both predictive of adverse health outcomes; we examine continuous birth weight and birth weight z-score (corrected for sex and gestational age at birth23) for descriptive purposes.
Covariates were ascertained from the birth record. Maternal race/ethnicity (non-Hispanic white, black, Asian; Hispanic of any race) was the effect measure modifier of interest. Race/ethnicity was identical between the first and subsequent pregnancies for all but 1,776 births (0.31%); we used race/ethnicity recorded from the first pregnancy. Time-varying confounders were selected based on known associations with maternal BMI and size at birth: maternal age at delivery (continuous), parity (nulliparous, multiparous), maternal education (<high school, high school degree or GED, some college, Bachelors degree or higher), public insurance (yes, no), clinical conditions (yes/no for each condition: chronic hypertension, gestational hypertension or preeclampsia, pre-existing diabetes mellitus, gestational diabetes mellitus), and child sex (male, female). If education decreased between births, education level from the first pregnancy was assigned to subsequent births (22,089 records [7.5%]). If chronic hypertension or diabetes was recorded in a pregnancy but not subsequent pregnancies, the chronic condition was assigned to subsequent pregnancies (1,924 (0.6%) and 1,044 (0.3%) births, respectively).
Statistical analysis
Statistical analysis were conducted in Stata MP 14.2. Preliminary and descriptive analysis evaluated the distributions and temporal variability of study variables. We estimated the effects of pre-pregnancy BMI on birth outcomes using a series of multinomial fixed effects and random effects models (xtreg function; “fe” option for fixed effects, “re” option for random effects models). To test hypotheses about racial/ethnic-specific associations, regression models were a priori stratified by race/ethnicity; unstratified analysis was conducted to aid in synthesis of findings.
Conditioned on the individual, fixed effect models account for time-invariant unmeasured variables (e.g., maternal genetics, ongoing social environment) that may be related to pre-pregnancy BMI and size at birth. By analyzing within-mother variation observed in repeated measures over time, each woman in essence serves as her own control. Fixed effects models analyze mother-child observations that are discordant in exposure within sibling sets; thus, time-constant maternal variables such as race/ethnicity are omitted from fixed effects models. Similarly, we omitted child sex to prevent exclusion of sibling pairs with concordant sex (e.g., both girls), and other variables that exhibit little within-woman variation, such as socioeconomic status and clinical conditions. Therefore, primary fixed effects analysis adjusted for maternal age and parity (Model 1a).
In contrast, random effects models (random person-level intercept)29 analyze variation both within and between individuals; they do not control for correlation between observed and unmeasured characteristics and are therefore comparable to between-mother associations reported in most prior research. Primary random effects models adjusted for maternal age, parity, education, and public insurance; and child sex (Model 2a). We quantified attenuation of associations for fixed effects, compared to random effects, as: 100 X (coefficientfixed − coefficientrandom)/coefficientrandom.
Sensitivity analyses tested models for robustness to omitted variables. First, alternate adjustment variables included: fixed effects Models 1b (Model 1a + child sex) and 1c (Model 1a + public insurance) and random effects Models 2b (minimal adjustment: maternal age and parity). Second, we stratified Model 1a for each racial/ethnic group by parity at the first observed pregnancy (nulliparous, multiparous). Third, while clinical conditions were too rare to produce stable estimates as covariates, we explored their influence on the observed associations by refitting Model 1a fixed effects models after excluding women with the above-described clinical conditions.
RESULTS
Women in the sample were predominately white (39.5%) or Hispanic (41.9%), with substantial numbers of other race/ethnicities (Table 1). At first observed birth, women were on average 28 years of age and a majority (60%) were nulliparous, although this was lower in black (43.6%) and Hispanic (49.3%) women. Subsequent deliveries were observed after a median of 28 months. Overall obesity prevalence was 18.4%, with substantial numbers of women with class II and III obesity; obesity was highest in black (27.1%) and Hispanic (25.6%) women. Size for gestational age was smallest in black (12.9% SGA, 6.7% LGA) and asian (11.2% SGA, 5.0% LGA) women, compared to white (6.0% SGA, 11.1% LGA) and Hispanic women (7.3% SGA, 9.7% LGA) (Web Table S1). Within each racial/ethnic group, SGA prevalence was lower and LGA prevalence was higher in higher categories of maternal pre-pregnancy BMI (Web Table S1).
Table 1.
Baselinea Characteristics of Women in the California Office of Statewide Health Planning & Development Linked Vital Statistics/Patient Discharge Database (2007-2012), Total and Stratified by Race/Ethnicity
| Total | White | Black | Hispanic | Asian | |
|---|---|---|---|---|---|
| Count (% of total) | 269,871 | 106,536 (39.5) | 13,571 (5.0) | 113,172 (41.9) | 36,592 (13.6) |
| Agea | |||||
| Mean (SE) (years) | 27.88 (0.01) | 28.76 (0.01) | 26.44 (0.04) | 26.56 (0.01) | 29.95 (0.02) |
| >=35 years (%) | 27,999 (10.4) | 13,490 (12.7) | 971 (7.2) | 7,901 (7.0) | 5,637 (15.4) |
| Paritya [n (%)] | |||||
| Nulliparous | 162,107 (60.1) | 73,576 (69.1) | 5,911 (43.6) | 55,746 (49.3) | 26,874 (73.4) |
| 1 | 60,499 (22.4) | 20,581 (19.3) | 3,655 (26.9) | 29,868 (26.4) | 6,395 (17.5) |
| 2 | 28,485 (10.6) | 7,936 (7.4) | 2,027 (14.9) | 16,356 (14.5) | 2,166 (5.9) |
| 3+ | 18,728 (6.9) | 4,420 (4.1) | 1,973 (14.5) | 11,185 (9.9) | 1,150 (3.1) |
| Interpregnancy interval (months) (median, [5th, 95th percentile]) | 28 [14, 54] | 28 [14, 54] | 26 [12, 56] | 28 [12, 56] | 28 [14, 54] |
| Pre-pregnancy BMI category | |||||
| Underweight | 11,938 (4.4) | 4,521 (4.2) | 603 (4.4) | 3,026 (2.7) | 3,788 (10.4) |
| Normal weight | 145,430 (53.9) | 64,891 (60.9) | 5,781 (42.6) | 49,384 (43.6) | 25,374 (69.3) |
| Overweight | 63,001 (23.3) | 22,441 (21.1) | 3,513 (25.9) | 31,800 (28.1) | 5,247 (14.3) |
| Obesity I | 29,638 (11.0) | 8,873 (8.3) | 1,868 (13.8) | 17,362 (15.3) | 1,535 (4.2) |
| Obesity II | 12,612 (4.7) | 3,782 (3.5) | 1,018 (7.5) | 7,312 (6.5) | 500 (1.4) |
| Obesity III | 7,252 (2.7) | 2,028 (1.9) | 788 (5.8) | 4,288 (3.8) | 148 (0.4) |
At first observed pregnancy
BMI, Body Mass Index; SE, standard error
BMI changes from first to last observed pregnancy varied, most gaining (median difference 0.65 BMI units), while some lost weight (25% lost ≥0.37 BMI units) (Table 2). SGA prevalence was 7.5% and 5.2% in the first and last observed pregnancy, respectively; 80.4% of women with SGA delivery in the first pregnancy had an AGA or LGA delivery in the last pregnancy. Substantial inter-pregnancy changes reflective of birth order were also observed for LGA and birth weight. Education, public insurance, and maternal health conditions varied minimally between pregnancies, and were thus excluded from primary fixed effects models.
Table 2:
Time-varying Characteristics of Women and Infants in the California Office of Statewide Health Planning & Development Linked Vital Statistics/Patient Discharge Database (2007-2012): Total Samplea
| First observed pregnancy | Last observed pregnancy | Within-person difference (last pregnancy – first pregnancy) | ||
|---|---|---|---|---|
| [mean (SE)] | [mean (SE)] | [mean (SE)] | [median (25th, 75th %ile)] | |
| Pre-pregnancy BMI (kg/m2) | 25.5 (0.01) | 26.3 (0.01) | 1.0 (0.01) | 0.6 (−0.4, 2.2) |
| Gestational weight gain (lb) | 31.5 (0.03) | 28.8 (0.03) | −3.3 (0.03) | −3.0 (−11.00, 5.00) |
| Birthweight (grams) | 3350.1 (0.89) | 3406.1 (0.94) | 61.8 (0.99) | 58.0 (−247.0, 368.0) |
| Birthweight z-scoreb | 0.03 (0.00) | 0.18 (0.00) | 0.17 (0.00) | 0.16 (−0.45, 0.78) |
| n (%) | n (%) | % changed categories (first pregnancy to last pregnancy) | ||
| Loss/Lower | Gain/Higher | |||
| Size for gestational age | ||||
| Small (SGA) | 23,079 (7.5) | 14,078 (5.2) | NA | 19,549 (80.4) |
| Appropriate (AGA) | 255,823 (82.9) | 224,204 (82.4) | 11,458 (4.5) | 26,077 (10.2) |
| Large (LGA) | 29,844 (9.7) | 33,932 (12.5) | 17,625 (61.0) | NA |
| Birth weight | ||||
| LBW | 12,903 (4.2) | 8,974 (3.3) | NA | 11,623 (82.1) |
| Average BW | 270,160 (87.5) | 235,701 (86.6) | 7,857 (2.9) | 21,714 (8.0) |
| Macrosomia | 25,683 (8.3) | 27,539 (10.1) | 16,417 (65.7) | NA |
| Education | ||||
| <HS | 37,882 (12.6) | 29,498 (11.1) | - | 6,494 (8.2) |
| HS/GED | 79,723 (26.6) | 63,448 (23.9) | - | 12,482 (15.5) |
| Some college | 83,900 (27.9) | 79,178 (29.9) | - | 3,113 (3.2) |
| College degree+ | 98,671 (32.9) | 92,871 (35.0) | - | NA |
| Public insurancec | 113,373 (36.7) | 98,617 (36.2) | 22,453 (11.5) | 18,224 (16.2) |
| Maternal health conditions | ||||
| Chronic hypertension | 3,424 (1.1) | 5,582 (2.0) | NA | 3,076 (1.0) |
| Pre-existing diabetes | 2,292 (0.7) | 3,419 (1.3) | NA | 1,650 (0.5) |
| Gestational hypertension/preeclampsia | 17,366 (5.6) | 10,721 (3.9) | 13,131 (2.3) | 7,526 (1.3) |
| Gestational diabetes | 19,390 (6.3) | 23,584 (8.7) | 9,199 (3.4) | 15,792 (5.4) |
N=269,871 mothers.
Corrected for sex and gestational age at birth
Change in public insurance is defined as lower if the first pregnancy was covered by private insurance and the last observed pregnancy by public insurance, or as higher if covered by public insurance at the first pregnancy and by private insurance in the last observed pregnancy.
AGA, appropriate for gestational age; BMI, Body Mass Index; HS, high school; LBW, low birth weight; LGA, large for gestational age; SGA, small for gestational age; SE, standard error
In adjusted analysis of the total sample, risk of SGA decreased and risk of LGA increased with greater pre-pregnancy BMI (Figure 2; Table 3). In fixed effects models, compared to normal weight, SGA risk was 30% greater for underweight [adjusted odds ratio [aOR], (95% confidence interval [CI]): 1.3 (1.2, 1.4)] and decreased with higher categories of BMI, reaching 70% lower for Class III obesity [aOR (95% CI): 0.3 (0.3, 0.4)]. LGA risk was 30% lower for underweight [aOR (95% CI): 0.7 (0.6, 0.8)], reaching five times greater for Class III obesity [aOR (95% CI): 5.1 (4.4, 5.9)]. Random effects estimates were generally stronger than fixed effects, particularly for LGA; for example, the aOR for Class I obesity was 2.0 in fixed effects versus 3.0 for random effects, a 37% attenuation in the coefficient.
FIGURE 2. Adjusted Associations Between Maternal Pre-pregnancy BMI Category and Size for Gestational Age.
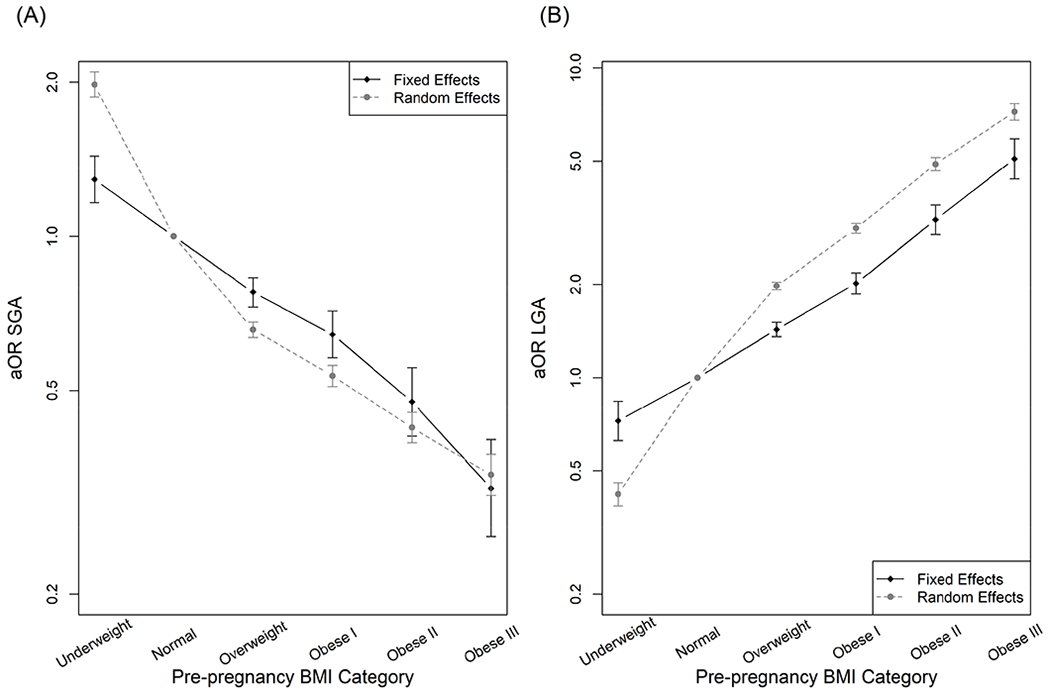
California Office of Statewide Health Planning & Development linked vital statistics/patient discharge database (2007-2012). Estimates derived from multinomial fixed or random effects models in the total sample (580,960 infants, 269,871 mothers), for Small for Gestational Age (SGA; Panel A) and Large for Gestational Age (LGA; Panel B) outcomes. Fixed effects model adjusted for maternal age at delivery, parity. Random effects model adjusted for maternal age at delivery, parity, child sex, maternal education, and maternal receipt of public insurance. Error bars indicate 95% Confidence Interval.
aOR, adjusted odds ratio; BMI, Body Mass Index
Table 3.
Adjusted Associations Between Maternal Pre-pregnancy BMI Category and Size for Gestational Agea
| Total | White | Black | Hispanic | Asian | ||||||
|---|---|---|---|---|---|---|---|---|---|---|
| OR [Attnb] | 95% CI | OR [Attnb] | 95% CI | OR [Attnb] | 95% CI | OR [Attnb] | 95% CI | OR [Attnb] | 95% CI | |
| Outcome: SGA (ref: AGA) | ||||||||||
| Fixed effects (Model 1a)c | ||||||||||
| Underweight | 1.3 [62%] | 1.2, 1.4 | 1.4 [51 %] | 1.1, 1.7 | 1.5 [26%] | 1.1, 2.2 | 1.1 [89%] | 0.9, 1.3 | 1.4 [45%] | 1.2, 1.7 |
| Normal weight | Referent | Referent | Referent | Referent | Referent | |||||
| Overweight | 0.8 [40%] | 0.7, 0.8 | 0.8 [40%] | 0.7, 0.9 | 0.8 [40%] | 0.7, 1.0 | 0.8 [34%] | 0.7, 0.8 | 0.8 [38%] | 0.6, 0.9 |
| Obesity Class I | 0.6 [30%] | 0.6, 0.7 | 0.7 [33%] | 0.5, 0.8 | 0.7 [26%] | 0.5, 1.0 | 0.6 [23%] | 0.5, 0.7 | 0.6 [29%] | 0.4, 0.9 |
| Obesity Class II | 0.5 [13%] | 0.4, 0.6 | 0.4 [−15%] | 0.3, 0.5 | 0.5 [11%] | 0.3, 0.7 | 0.5 [16%] | 0.4, 0.6 | 0.3 [15%] | 0.2, 0.7 |
| Obesity Class III | 0.3 [−6%] | 0.3, 0.4 | 0.3 [−38%] | 0.2, 0.4 | 0.4 [17%] | 0.2, 0.7 | 0.3 [−7%] | 0.3, 0.5 | 0.2 [−36%] | 0.0, 0.6 |
| Random effects (Model 2a)d | ||||||||||
| Underweight | 2.0 | 1.9, 2.1 | 2.0 | 1.8, 2.2 | 1.8 | 1.4, 2.2 | 1.7 | 1.5, 1.9 | 1.9 | 1.8, 2.1 |
| Normal weight | Referent | Referent | Referent | Referent | Referent | |||||
| Overweight | 0.7 | 0.6, 0.7 | 0.7 | 0.6, 0.7 | 0.7 | 0.6, 0.8 | 0.7 | 0.6, 0.7 | 0.6 | 0.6, 0.7 |
| Obesity Class I | 0.5 | 0.5, 0.6 | 0.5 | 0.5, 0.6 | 0.6 | 0.5, 0.7 | 0.5 | 0.5, 0.6 | 0.5 | 0.4, 0.6 |
| Obesity Class II | 0.4 | 0.4, 0.5 | 0.4 | 0.4, 0.5 | 0.4 | 0.4, 0.5 | 0.5 | 0.4, 0.5 | 0.3 | 0.2, 0.4 |
| Obesity Class III | 0.3 | 0.3, 0.4 | 0.4 | 0.3, 0.5 | 0.3 | 0.2, 0.4 | 0.4 | 0.3, 0.4 | 0.3 | 0.2, 0.5 |
| Outcome: LGA (ref: AGA) | ||||||||||
| Fixed effects (Model 1a)c | ||||||||||
| Underweight | 0.7 [63%] | 0.6, 0.8 | 0.7 [54%] | 0.5, 0.8 | 1.6 [349%] | 0.7, 3.3 | 0.8 [64%] | 0.6, 1.0 | 0.7 [53%] | 0.5, 1.0 |
| Normal weight | Referent | Referent | Referent | Referent | Referent | |||||
| Overweight | 1.4 [47%] | 1.4, 1.5 | 1.5 [38%] | 1.4, 1.7 | 1.2 [66%] | 0.9, 1.6 | 1.4 [48%] | 1.3, 1.5 | 1.6 [51%] | 1.3, 2.0 |
| Obesity Class I | 2.0 [37%] | 1.9, 2.2 | 2.4 [25%] | 2.1, 2.8 | 1.4 [55%] | 1.0, 2.1 | 1.9 [36%] | 1.7, 2.1 | 2.2 [48%] | 1.5, 3.1 |
| Obesity Class II | 3.2 [26%] | 2.9, 3.6 | 4.1 [16%] | 3.4, 4.9 | 2.3 [28%] | 1.4, 3.8 | 3.0 [23%] | 2.6, 3.5 | 3.3 [44%] | 2.0, 5.5 |
| Obesity Class III | 5.1 [18%] | 4.4, 5.9 | 6.7 [8%] | 5.1, 8.7 | 3.0 [17%] | 1.5, 5.7 | 4.7 [16%] | 3.8, 5.7 | 5.7 [38%] | 2.6, 12.6 |
| Random effects (Model 2a)d | ||||||||||
| Underweight | 0.4 | 0.4, 0.5 | 0.4 | 0.4, 0.5 | 0.8 | 0.6, 1.2 | 0.5 | 0.4, 0.5 | 0.4 | 0.3, 0.5 |
| Normal weight | Referent | Referent | Referent | Referent | Referent | |||||
| Overweight | 2.0 | 1.9, 2.0 | 2.0 | 1.9, 2.1 | 1.8 | 1.5, 2.1 | 1.8 | 1.8, 1.9 | 2.6 | 2.3, 2.8 |
| Obesity Class I | 3.0 | 2.9, 3.1 | 3.2 | 3.0, 3.4 | 2.2 | 1.8, 2.6 | 2.7 | 2.6, 2.9 | 4.5 | 3.8, 5.2 |
| Obesity Class II | 4.9 | 4.7, 5.1 | 5.3 | 4.9, 5.8 | 3.2 | 2.6, 4.0 | 4.2 | 4.0, 4.5 | 8.6 | 6.8, 10.8 |
| Obesity Class III | 7.2 | 6.8, 7.7 | 7.8 | 7.0, 8.8 | 3.7 | 2.9, 4.7 | 6.3 | 5.8, 6.8 | 16.2 | 11.4, 23.1 |
California Office of Statewide Health Planning & Development linked vital statistics/patient discharge database (2007-2012). Estimates derived from multinomial fixed or random effects models in the total sample (580,960 infants, 269,871 mothers) and in race/ethnicity-stratified models (white: 106,536 mothers with 225,951 deliveries; black: 13,571 mothers with 30,859 deliveries; Hispanic: 113,172 mothers with 246,983 deliveries; Asian: 36,592 mothers with 77,157 deliveries).
Percent attenuation: compared to random effects, based on percent change in the coefficient: 100 X (coefficientfixed − coefficientrandom)/coefficientrandom
Fixed effects model 1a adjusted for maternal age at delivery, parity.
Random effects model 1a adjusted for maternal age at delivery, parity, child sex, maternal education, and maternal receipt of public insurance.
AGA, Appropriate for Gestational Age; BMI, Body Mass Index; CI, confidence interval; LGA, Large for Gestational Age; OR, odds ratio; SGA, Small for Gestational Age
In race/ethnicity-stratified models (Table 3), associations with SGA were similar across racial/ethnic groups, except that underweight was not associated with SGA in Hispanic women. Associations with LGA were strongest in white women, reaching an aOR of 6.7 for Class III obesity; and weakest in black women (aOR for Class III obesity: 3.0). In black women, underweight was associated with higher risk of LGA, but this association was based on a small number of women (n=604) and not statistically significant. Compared to random effects, fixed effects estimates were least attenuated for the underweight-SGA association in black women; and for overweight- and obesity-LGA associations in white women.
In sensitivity analyses, fixed effects estimates were similar with alternate variable adjustment sets, in women who were nulliparous and multiparous at the first observed pregnancy, and after excluding women with chronic conditions (Web Tables S2A-B). Random effects estimates were similar with alternate variable adjustment sets and after excluding women with clinical conditions (Web Table S3). Analogous results for birth weight (LBW and macrosomia, versus NBW) were similar (Web Table S4).
DISCUSSION
In this study, we compared siblings born to the same mother, finding that higher maternal pre-pregnancy BMI was associated with lower risk of SGA and up to five times higher risk of LGA delivery in all racial/ethnic groups. Our findings contradicted our first hypothesis: maternal BMI-LGA associations were stronger – not weaker, as hypothesized – among white women and weaker among black women, and BMI-SGA associations were similar across racial/ethnic groups. Findings partially supported our second hypothesis: associations between maternal pre-pregnancy BMI and LGA in racial/ethnic minorities were more strongly confounded by ongoing family- and macro-level factors.
Our overall estimates that maternal Class I obesity is associated with 30-40% lower odds of SGA and 1.4-2.4 times greater odds of LGA are consistent with a systematic review reporting a pooled odds ratios of 0.88 for SGA and 1.88 for LGA.1 Moreover, we found stronger associations for Class II and III obesity, with ORs of 0.5 and 0.3 for SGA; and 3.2 and 5.1 for LGA, consistent with previous research distinguishing severe obesity.6
Our finding that higher maternal pre-pregnancy BMI is most strongly associated with LGA delivery among non-Hispanic white women is consistent with prior evidence that associations between maternal BMI and perinatal outcomes differs by race/ethnicity.5,21,30,31 Yet the direction of effect modification varies across study populations and study outcome. For example, associations between maternal BMI and birth weight were stronger in African American women a high risk clinical population,6 but weaker in a previous, between-woman analysis of our data source.5 Similar inconsistencies are observed for perinatal outcomes that influence birth weight: associations between maternal obesity and cesarean delivery and preeclampsia were observed only among African American or Latina women,32 while pre-pregnancy BMI more strongly predicted gestational diabetes in non-Hispanic white women.33
Explanations for weaker associations between pre-pregnancy BMI and LGA in racial/ethnic minority women are unknown. Notably, black women have the highest prevalence of obesity20 and the highest risk for adverse birth outcomes, particularly SGA and LBW deliveries, but not LGA deliveries. As hypothesized elsewhere,5 weaker pre-pregnancy BMI-birth size associations in black women may result from the numerous adverse exposures that are more common in this subgroup, such as psychosocial stress and environmental exposures that influence fetal growth. Racial/ethnic differences in body composition or metabolic function10–12 – for example, visceral fat tends to be greater in Asians and lower in African American women – perhaps driven by prenatal exposures,8,9 are another possible explanation for racial/ethnic differences in pre-pregnancy BMI-LGA associations. Greater understanding of the mechanisms driving racial/ethnic differences is needed to inform preconception weight loss and other interventions for minority women.
Our findings also suggest that family-level factors more strongly confound maternal BMI-birth size associations in racial/ethnic minority groups. Among prior studies using sibling study design, some find that associations between maternal pre-pregnancy BMI or gestational weight gain and child body size are completely explained by family-level factors,14,18,34 while others find that within-family associations are attenuated, but robust to family-level confounders.17,35 While most studies did not quantify the degree of attenuation, Lawlor and colleagues found similar attenuation (20-22%) of gestational weight gain-birth weight associations within sibling sets, compared to overall associations.17 Our racial/ethnic-specific analysis advances this literature, suggesting that family-level factors account for 8-38% of associations in non-Hispanic whites, and 16-66% of associations in racial/ethnic minorities. Thus, between-person associations of maternal obesity on birth outcomes may be overestimated by a greater extent in racial/ethnic minorities.
Importantly, within-family associations should be interpreted in the context of several considerations.36 They control for confounding by factors that remain constant for each woman between pregnancies, and that exert similar effects across pregnancies. Such factors include several categories of ongoing exposures, to varying degrees: genetics; and psychosocial factors (e.g., racial discrimination, social support), environmental exposures (e.g., pollution, second hand smoke), behaviors (e.g., maternal diet, smoking) that do not change from one pregnancy to the next. Yet within-family designs do not address time-varying factors, such as maternal diet, stress, or physical activity that shift throughout the life cycle.37,38 Within-family designs are only generalizable to children born to mothers who had more than one delivery within the study period; the generalizability and transportability39 of findings from sibling designs is an active area of research40–42.
There are additional limitations of this study. We examined pre-pregnancy BMI calculated from self-reported height and weight, which contain error,43 and variation in body composition at any given BMI is substantial44 and systematic by race/ethnicity.45 We lacked data on maternal diet, physical activity, smoking, and other determinants of weight status, which are needed to better understand etiologic pathways and to inform interventions; to the extent that they vary between pregnancies, these variables may contribute to residual confounding in this study. Missingness in the maternal ID variable used to link mothers across pregnancies is not random given that the encrypted linkage ID variable is based on the woman’s social security number. While race/ethnicity reported on the birth record are reliable,46 consideration of specific Hispanic and Asian subgroups47 are needed to understand racial/ethnic differences in intergenerational processes. Similarly, clinical conditions reported on the birth record contain error.48,49 These limitations are balanced by our exceptionally large and diverse study population, enabling analysis of racial/ethnic subgroups and control for time constant, family-level confounders.
Implications and Conclusions
Higher maternal pre-pregnancy BMI was associated with lower risk of SGA and five times higher risk of LGA delivery in a racially and ethnically diverse sample of 580,960 newborn infants born to 269,871 mothers. These associations were observed in all racial/ethnic groups, suggesting that healthy weight prior to pregnancy is beneficial to all women. Weaker associations between pre-pregnancy BMI and birth size in racial/ethnic minority women likely reflects a constellation of adverse exposures that influence infant growth, emphasizing the importance of a systems approach to interventions and more research in racial/ethnic subgroups. Greater confounding in racial/ethnic minorities suggests a need for improved understanding of determinants of prenatal development in racial/ethnic subgroups. These findings should be balanced with risks of a wide range of maternal and offspring outcomes – especially longer-term offspring outcomes related to obesity and in other domains (e.g., cognitive development, asthma).
Supplementary Material
ACKNOWLEDGMENTS
JBH is supported by the National Institute of Diabetes and Digestive and Kidney Diseases, National Institutes of Health (grant number K01-DK1022857). NEM is supported by the Eunice Kennedy Shriver National Institute of Child Health and Human Development, National Institutes of Health (grant number K23HD069520-01A1). JMS and FB are supported by the Eunice Kennedy Shriver National Institute of Child Health and Human Development, National Institutes of Health (grant number R00 HD079658-03).
Abbreviations:
- AGA
Appropriate for Gestational Age
- BMI
Body Mass Index
- CI
Confidence Interval
- ICD-9
International Classification of Diseases, 9th revision
- LBW
Low Birth Weight
- LGA
Large for Gestational Age
- OR
Odds Ratio
- SGA
Small for Gestational Age
Footnotes
Publisher's Disclaimer: This is a PDF file of an unedited manuscript that has been accepted for publication. As a service to our customers we are providing this early version of the manuscript. The manuscript will undergo copyediting, typesetting, and review of the resulting proof before it is published in its final form. Please note that during the production process errors may be discovered which could affect the content, and all legal disclaimers that apply to the journal pertain.
REFERENCES
- 1.Liu P, Xu L, Wang Y, et al. Association between perinatal outcomes and maternal pre-pregnancy body mass index. Obes Rev. 2016;17(11):1091–1102. [DOI] [PubMed] [Google Scholar]
- 2.Yu Z, Han S, Zhu J, Sun X, Ji C, Guo X. Pre-pregnancy body mass index in relation to infant birth weight and offspring overweight/obesity: a systematic review and meta-analysis. PLoS One. 2013;8(4):e61627. [DOI] [PMC free article] [PubMed] [Google Scholar]
- 3.Woo Baidal JA, Locks LM, Cheng ER, Blake-Lamb TL, Perkins ME, Taveras EM. Risk Factors for Childhood Obesity in the First 1,000 Days: A Systematic Review. Am J Prev Med. 2016;50(6):761–779. [DOI] [PubMed] [Google Scholar]
- 4.Beta J, Khan N, Khalil A, Fiolna M, Ramadan G, Akolekar R. Maternal and neonatal complications of fetal macrosomia: systematic review and meta-analysis. Ultrasound Obstet Gynecol. 2019;54(3):308–318. [DOI] [PubMed] [Google Scholar]
- 5.Snowden JM, Mission JF, Marshall NE, et al. The Impact of maternal obesity and race/ethnicity on perinatal outcomes: Independent and joint effects. Obesity (Silver Spring). 2016;24(7):1590–1598. [DOI] [PMC free article] [PubMed] [Google Scholar]
- 6.Sridhar SB, Ferrara A, Ehrlich SF, Brown SD, Hedderson MM. Risk of large-for-gestational-age newborns in women with gestational diabetes by race and ethnicity and body mass index categories. Obstet Gynecol. 2013; 121(6):1255–1262. [DOI] [PMC free article] [PubMed] [Google Scholar]
- 7.Leonard SA, Main EK, Scott KA, Profit J, Carmichael SL. Racial and ethnic disparities in severe maternal morbidity prevalence and trends. Ann Epidemiol. 2019;33:30–36. [DOI] [PMC free article] [PubMed] [Google Scholar]
- 8.Dabelea D, Crume T. Maternal environment and the transgenerational cycle of obesity and diabetes. Diabetes. 2011;60(7):1849–1855. [DOI] [PMC free article] [PubMed] [Google Scholar]
- 9.Messer LC, Boone-Heinonen J, Mponwane L, Wallack L, Thornburg KL. Developmental Programming: Priming Disease Susceptibility for Subsequent Generations. Curr Epidemiol Rep. 2015;2(1):37–51. [DOI] [PMC free article] [PubMed] [Google Scholar]
- 10.Carroll JF, Chiapa AL, Rodriquez M, et al. Visceral fat, waist circumference, and BMI: impact of race/ethnicity. Obesity (Silver Spring). 2008;16(3):600–607. [DOI] [PubMed] [Google Scholar]
- 11.Park YW, Allison DB, Heymsfield SB, Gallagher D. Larger amounts of visceral adipose tissue in Asian Americans. Obes Res. 2001;9(7):381–387. [DOI] [PubMed] [Google Scholar]
- 12.Araneta MR, Barrett-Connor E. Ethnic differences in visceral adipose tissue and type 2 diabetes: Filipino, African-American, and white women. Obes Res. 2005; 13(8):1458–1465. [DOI] [PubMed] [Google Scholar]
- 13.Ester WA, Houghton LC, Lumey LH, et al. Maternal and Early Childhood Determinants of Women’s Body Size in Midlife: Overall Cohort and Sibling Analyses. Am J Epidemiol. 2017;185(5):385–394. [DOI] [PMC free article] [PubMed] [Google Scholar]
- 14.Branum AM, Parker JD, Keim SA, Schempf AH. Prepregnancy body mass index and gestational weight gain in relation to child body mass index among siblings. Am J Epidemiol. 2011;174(10):1159–1165. [DOI] [PubMed] [Google Scholar]
- 15.Yan J Maternal pre-pregnancy BMI, gestational weight gain, and infant birth weight: A within-family analysis in the United States. Econ Hum Biol. 2015; 18:1–12. [DOI] [PubMed] [Google Scholar]
- 16.Gardner RM, Lee BK, Magnusson C, et al. Maternal body mass index during early pregnancy, gestational weight gain, and risk of autism spectrum disorders: Results from a Swedish total population and discordant sibling study. Int J Epidemiol. 2015;44(3):870–883. [DOI] [PMC free article] [PubMed] [Google Scholar]
- 17.Lawlor DA, Lichtenstein P, Fraser A, Langstrom N. Does maternal weight gain in pregnancy have long-term effects on offspring adiposity? A sibling study in a prospective cohort of 146,894 men from 136,050 families. Am J Clin Nutr. 2011;94(1):142–148. [DOI] [PMC free article] [PubMed] [Google Scholar]
- 18.Hutcheon JA, Platt RW, Meltzer SJ, Egeland GM. Is birth weight modified during pregnancy? Using sibling differences to understand the impact of blood glucose, obesity, and maternal weight gain in gestational diabetes. Am J Obstet Gynecol. 2006;195(2):488–494. [DOI] [PubMed] [Google Scholar]
- 19.Yu YH, Bodnar LM, Brooks MM, Himes KP, Naimi AI. Comparison of Parametric and Nonparametric Estimators for the Association Between Incident Prepregnancy Obesity and Stillbirth in a Population-Based Cohort Study. Am J Epidemiol. 2019. [DOI] [PMC free article] [PubMed] [Google Scholar]
- 20.Branum AM, Kirmeyer SE, Gregory EC. Prepregnancy Body Mass Index by Maternal Characteristics and State: Data From the Birth Certificate, 2014. Natl Vital Stat Rep. 2016;65(6):1–11. [PubMed] [Google Scholar]
- 21.Bryant AS, Worjoloh A, Caughey AB, Washington AE. Racial/ethnic disparities in obstetric outcomes and care: prevalence and determinants. Am J Obstet Gynecol. 2010;202(4):335–343. [DOI] [PMC free article] [PubMed] [Google Scholar]
- 22.Blumenshine P, Egerter S, Barclay CJ, Cubbin C, Braveman PA. Socioeconomic disparities in adverse birth outcomes: a systematic review. Am J Prev Med. 2010;39(3):263–272. [DOI] [PubMed] [Google Scholar]
- 23.Talge NM, Mudd LM, Sikorskii A, Basso O. United States birth weight reference corrected for implausible gestational age estimates. Pediatrics. 2014;133(5):844–853. [DOI] [PubMed] [Google Scholar]
- 24.Pinho-Pompeu M, Paulino DSM, Morais SS, Crubelatti MY, Pinto ESJL, Surita FG. How to classify BMI among pregnant adolescents? A prospective cohort. Public Health Nutr. 2019;22(2):265–272. [DOI] [PMC free article] [PubMed] [Google Scholar]
- 25.Halloran DR, Marshall NE, Kunovich RM, Caughey AB. Obesity trends and perinatal outcomes in black and white teenagers. Am J Obstet Gynecol. 2012;207(6):492 e491–497. [DOI] [PMC free article] [PubMed] [Google Scholar]
- 26.McIntosh CT, Schlenker W. Identifying non-linearities in fixed effects models. Available at: https://gps.ucsd.edu/_files/faculty/mcintosh/mcintosh_research_identifying.pdf. 2006.
- 27.Costantine MM, Mele L, Landon MB, et al. Customized versus population approach for evaluation of fetal overgrowth. Am J Perinatol. 2013;30(7):565–572. [DOI] [PMC free article] [PubMed] [Google Scholar]
- 28.Hediger ML, Joseph KS. Fetal Growth: Measurement and Evaluation In: Louis GM, Platt RW, eds. Reproductive and Perinatal Epidemiology. New York: Oxford University Press; 2011:168–185. [Google Scholar]
- 29.Rabe-Hesketh S, Skrondal A. Multilevel and Longitudinal Modeling Using Stata 2nd ed: Stata Press; 2008. [Google Scholar]
- 30.Chung JH, Melsop KA, Gilbert WM, Caughey AB, Walker CK, Main EK. Increasing pre-pregnancy body mass index is predictive of a progressive escalation in adverse pregnancy outcomes. J Matern Fetal Neonatal Med. 2012;25(9):1635–1639. [DOI] [PubMed] [Google Scholar]
- 31.Bodnar LM, Catov JM, Klebanoff MA, Ness RB, Roberts JM. Prepregnancy body mass index and the occurrence of severe hypertensive disorders of pregnancy. Epidemiology. 2007;18(2):234–239. [DOI] [PubMed] [Google Scholar]
- 32.Ramos GA, Caughey AB. The interrelationship between ethnicity and obesity on obstetric outcomes. Am J Obstet Gynecol. 2005;193(3 Pt 2):1089–1093. [DOI] [PubMed] [Google Scholar]
- 33.Shah A, Stotland NE, Cheng YW, Ramos GA, Caughey AB. The association between body mass index and gestational diabetes mellitus varies by race/ethnicity. Am J Perinatol. 2011;28(7):515–520. [DOI] [PMC free article] [PubMed] [Google Scholar]
- 34.Lawlor DA, Lichtenstein P, Langstrom N. Association of maternal diabetes mellitus in pregnancy with offspring adiposity into early adulthood: sibling study in a prospective cohort of 280,866 men from 248,293 families. Circulation. 2011;123(3):258–265. [DOI] [PMC free article] [PubMed] [Google Scholar]
- 35.Terry MB, Wei Y, Esserman D, McKeague IW, Susser E. Pre- and postnatal determinants of childhood body size: cohort and sibling analyses. J Dev Orig Health Dis. 2011;2(2):99–111. [DOI] [PubMed] [Google Scholar]
- 36.Susser E, Eide MG, Begg M. Invited commentary: The use of sibship studies to detect familial confounding. Am J Epidemiol. 2010;172(5):537–539. [DOI] [PubMed] [Google Scholar]
- 37.Boone-Heinonen J, Howard AG, Meyer K, et al. Marriage and parenthood in relation to obesogenic neighborhood trajectories: The CARDIA study. Health Place. 2015;34:229–240. [DOI] [PMC free article] [PubMed] [Google Scholar]
- 38.Boone-Heinonen J, Diez Roux AV, Kiefe CI, Lewis CE, Guilkey DK, Gordon-Larsen P. Neighborhood socioeconomic status predictors of physical activity through young to middle adulthood: the CARDIA study. Soc Sci Med. 2011;72(5):641–649. [DOI] [PMC free article] [PubMed] [Google Scholar]
- 39.Stuart EA, Ackerman B, Westreich D. Generalizability of randomized trial results to target populations: Design and analysis possibilities. Res Soc Work Pract. 2018;28(5):532–537. [DOI] [PMC free article] [PubMed] [Google Scholar]
- 40.Hanley GE, Hutcheon JA, Kinniburgh BA, Lee L. Interpregnancy Interval and Adverse Pregnancy Outcomes: An Analysis of Successive Pregnancies. Obstet Gynecol. 2017;129(3):408–415. [DOI] [PubMed] [Google Scholar]
- 41.Klebanoff MA. Interpregnancy Interval and Pregnancy Outcomes: Causal or Not? Obstet Gynecol. 2017;129(3):405–407. [DOI] [PubMed] [Google Scholar]
- 42.Snowden JM, Leonard SA. Invited Commentary: The Causal Association Between Obesity and Stillbirth-Strengths and Limitations of the Consecutive-Pregnancies Approach. Am J Epidemiol. 2019. [DOI] [PMC free article] [PubMed] [Google Scholar]
- 43.Bodnar LM, Abrams B, Bertolet M, et al. Validity of birth certificate-derived maternal weight data. Paediatr Perinat Epidemiol. 2014;28(3):203–212. [DOI] [PMC free article] [PubMed] [Google Scholar]
- 44.Connor Gorber S, Tremblay M, Moher D, Gorber B. A comparison of direct vs. self-report measures for assessing height, weight and body mass index: a systematic review. Obes Rev. 2007;8(4):307–326. [DOI] [PubMed] [Google Scholar]
- 45.Wen M, Kowaleski-Jones L. Sex and ethnic differences in validity of self-reported adult height, weight and body mass index. Ethn Dis. 2012;22(1):72–78. [PMC free article] [PubMed] [Google Scholar]
- 46.Baumeister L, Marchi K, Pearl M, Williams R, Braveman P. The validity of information on “race” and “Hispanic ethnicity” in California birth certificate data. Health Serv Res. 2000;35(4):869–883. [PMC free article] [PubMed] [Google Scholar]
- 47.Wong LF, Caughey AB, Nakagawa S, Kaimal AJ, Tran SH, Cheng YW. Perinatal outcomes among different Asian-American subgroups. Am J Obstet Gynecol. 2008;199(4):382 e381–386. [DOI] [PubMed] [Google Scholar]
- 48.Vinikoor LC, Messer LC, Laraia BA, Kaufman JS. Reliability of variables on the North Carolina birth certificate: a comparison with directly queried values from a cohort study. Paediatr Perinat Epidemiol. 2010;24(1):102–112. [DOI] [PMC free article] [PubMed] [Google Scholar]
- 49.Lain SJ, Hadfield RM, Raynes-Greenow CH, et al. Quality of data in perinatal population health databases: a systematic review. Med Care. 2012;50(4):e7–20. [DOI] [PubMed] [Google Scholar]
Associated Data
This section collects any data citations, data availability statements, or supplementary materials included in this article.