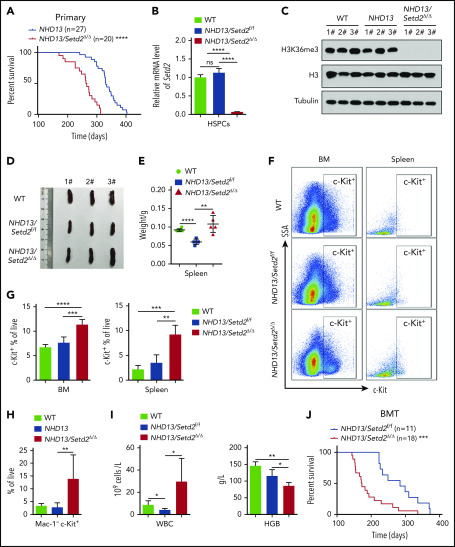
Figure 2.
Deletion of Setd2 accelerates the transformation of MDS to AML in the NHD13 mouse model. (A) Survival curves of NHD13 (n = 27; median survival, 333 days) and NHD13/Setd2Δ/Δ (n = 20; median survival, 267 days) mice. Poly(I:C) was injected into 6- to 8-week-old Mx1-Cre/NHD13/Setd2f/f mice. (B) qPCR analysis of Setd2 expression in the BM HSPCs of the WT, NHD13, and NHD13/Setd2Δ/Δ mice. (C) Western blot analysis showing the abolishment of H3K36me3, which reflected the knockout efficiency of Setd2, in the BM cells isolated from the NHD13/Setd2Δ/Δ mice compared with the NHD13 and WT mice. (D-E) Different size and weight of the spleens of the NHD13/Setd2Δ/Δ, NHD13, and WT mice (n = 5). (F-G) Representative flow cytometry profiles (F) and quantification of the frequencies (G) of the c-Kit+ cells in the BM and spleen of the indicated mice at 4 weeks after poly(I:C) injection. (H) Frequencies of the Mac-1−c-Kit+ cells in the BM of the NHD13/Setd2Δ/Δ mice during the leukemia stage, compared with the NHD13 and WT mice. (I) Complete blood count (CBC) analysis of the WT, NHD13, and NHD13/Setd2Δ/Δ mice at 6 months after poly(I:C) injection. (J) Survival curves of the mice receiving NHD13/Setd2f/f (n = 11; median survival, 284 days) and Mx1-Cre/NHD13/Setd2f/f (n = 18; median survival, 172 days) BM cells. The mice were injected with poly(I:C) at 4 weeks after transplantation. *P < .05; **P < .01; ***P < .001; ****P < .0001.

