

Abstract
The initiation of transcription is regulated by transcription factors (TFs) binding to DNA response elements (REs). How do TFs recognize specific binding sites among the many similar ones available in the genome? Recent research has illustrated that even a single nucleotide substitution can alter the selective binding of TFs to coregulators, that prior binding events can lead to selective DNA binding, and that selectivity is influenced by the availability of binding sites in the genome. Here, we combine structural insights with recent genomics screens to address the problem of TF–DNA interaction specificity. The emerging picture of selective binding site sequence recognition and TF activation involves three major factors: the cellular network, protein and DNA as dynamic conformational ensembles and the tight packing of multiple TFs and coregulators on stretches of regulatory DNA. The classification of TF recognition mechanisms based on these factors impacts our understanding of how transcription initiation is regulated.
DNA response elements, transcription factors and function
The recognition of short DNA REs by TFs [1,2] is a key step in transcription. These REs can be located in the promoter near the transcription start site, in an enhancer or other stretch of regulatory DNA many base pairs away from the promoter [3]. Typically, REs are found in clusters and together with multidomain TFs and their coregulators form large assemblies [4]. Each TF and coregulator can exist in multiple post-translational modification states. The large numbers of factors and states involved enable an environmentally-sensitive cellular response. Box 1 gives background information on TFs and REs and Box 2 highlights the complexity of the recognition problem in the human genome (e.g. there are 3000 TFs and 700 000 possible REs); that is, the large number of DNA sequences match the binding sites from which a TF has to choose.
Box 1. TFs and REs.
TFs are classified based on a common structural framework of the DBD and are organized hierarchically [76,77]. The main types include homeodomain TFs, POU TFs, basic helix–loop–helix TFs, leucine zipper TFs, zinc finger TFs, nuclear hormone receptor TFs and HMG box-containing TFs. The Arabidopsis transcription factor database (AtTFDB, http://arabidopsis.med.ohio-state.edu/AtTFDB/) lists 41 families. The functions of paralogous TFs, the variations in homeodomain DNA-binding TFs and the divergence of the basic helix–loop–helix domain are among the recent studies addressing TF families [78–80]. TFs are often organized in a dimeric or tetrameric manner. Because the monomers bind to similar sequences, REs typically consist of two half-sites. Although REs of a particular TF can have different sequences, organization, spacers between their half-sites and can vary in their distances from transcription start sites, their most distinctive feature is high sequence similarity. Two important points emerge from recent data analysis on p53 [11,26,50] and nuclear hormone receptor (NR) REs [81]. The consensus sequence for each of these TFs is different and REs recognized by each TF are highly degenerate. For example, the half-site consensus for p53 is 5′-RRRCWWGYYY-3′ (where R is purine, Y pyrimidine, W is either A or T (adenine or thymine), G is guanine and C is cytosine [11]; see [26] for a comprehensive description). The half-sites can be oriented head-to-head or head-to-tail in a tandem repeat [82]. The spacers between the half-sites can range between 1–20 bp. The NR half-site consensus is AGGTCA. However, most NRs tolerate considerable variation [81], including direct repeats AGGTCAnxAGGTCA, inverted (palindromic) repeats AGGTCAnxTGACCT and ‘everted’ repeats TGACCTnxAGGTCA, with the number of spacer nucleotides (nx) reaching 8 bp [81]. Hence, it is unclear what constitutes a p53 [26] or any TF target RE sequence. Binding to such diverse REs necessitates conformational flexibility and DBD–domain adjustment. Because each dimer binds a half-site, if the spacer is, for example 5 bp, the two dimers are on opposite faces of the DNA and cannot interact with each other. In such cases, specific one half-site binding only, or first half-site-specific and second half-site non-specific interactions are possible [24].
Box 2. The complexity of the recognition problem.
A recent conservative estimate put the promoter size at ~150 bp [6], and enhancers were estimated at ~500 bp [83]. Although these numbers might yet converge to similar values, as it stands they suggest that ~8–16 TF tetramers/dimers bind to the DNA in tandem with promoters and over 24–48 in enhancers, although not necessarily in direct contact [33]. The numbers of TFs increase with genome size [84]. It was estimated that there are ~2600 proteins in the human genome that contain DBDs. Based on the definition of TFs as proteins that bind specific DNA sequences and thereby control transcription, most of these were suggested to function as TFs [85]. This led to an estimated 10% of the genes in the genome coding for TFs. Because genes can be controlled by some TFs binding to REs that are nearby or faraway, and each gene requires the cooperative action of several TFs [4], the number of combinations of human TFs [86] and REs is vast. On the human genome scale, with only four types of DNA bases, this argues for an immense number of possible REs for the same and different TFs. A 6 bp RE would occur >700 000 times, and considering RE degeneracy this might be an underestimation [1]. Much of the complexity in the differentiation of animal and plant cells has been attributed to the evolution of RE cis-regulatory sequences and their TFs [83,87]. The enormous increase in the number of combinations was used to explain the lower than expected (only a factor of two) difference between the number of genes in vertebrates versus invertebrates and between higher organisms compared with prokaryotes. However, chromatin states, which make the REs TF accessible or buried, should also be considered. The complexity is further illustrated by the numbers and locations of cis-control elements. Drosophila and other simple eukaryotes such as the sea squirt typically have several enhancers for a single gene of 2 to 3 Kb [83]. Unicellular organisms such as yeast are believed to have considerably less. Although numbers vary, and recently compiled yeast ChIp-chip data put TF numbers at ~157 TFs with 4410 target genes [88], the total number was estimated at ~300 TFs or one per ~20 genes. This can be compared with humans, which express ~3000 TFs or one per 10 genes [83]. Of interest, yeast does not have long-range activation, indicative of the need for a higher level of gene control.
How does a TF recognize its REs among the many similar REs and how is this selectivity achieved? These are important and thought-provoking problems. Several factors are thought to play a role in these processes including the extent of the similarity between the RE sequence and the consensus sequence of the TF, the concentration of the TF in the cell and the compactness of the chromatin [5], which makes large stretches of DNA inaccessible, thereby reducing the genomic region that the TF can choose from [5,6]. However, DNase I-sensitivity mapping [6,7] shows that promoters tend to be nucleosome-free DNA stretches [6–8]. It can be surmised that enhancers and other regulatory stretches also tend to be nucleosome-free, but they are not as well defined because they are more difficult to map on genomic scales [9]. In addition, the binding of a TF to one RE can affect the selective binding of other REs. This can occur in several ways: RE binding can stabilize or block binding of RNA polymerase to DNA; it can catalyze histone acetylation to weaken the association of DNA with histones, making certain DNA regions more accessible to TFs (and thereby upregulate transcription); or it can catalyze deacetylation to strengthen the association of DNA with histones, making those DNA regions less accessible (and thereby downregulate transcription).
Even considering only chromatin-accessible REs, this question presents a challenge because each RE is associated with a different gene and controls a different function (i.e. activation or repression) [10,11] (Table 1 and Figure 1). The traditional view of TF recognition suggests that the more similar the RE sequence is to the consensus RE the greater the affinity between the TF and RE, and that the functions associated with high-affinity binding can differ from those associated with low-affinity binding. However, recent evidence has begun to question this view, which focuses on sequence variability and disregards the cellular environment. For example, the differences in affinity are often small [10,11], and it is unclear what distinguishes REs from being transcription-activators or transcription-repressors. In this review, we discuss the mechanistic aspects of TF selectivity, focusing on degenerate sequence recognition (which is the key to understanding functional specificity), revealing how changes in the cellular environment impact TF selectivity.
Table 1.
REs with similar sequences can have very different functions
| Function | p53-RE | First half-site | Second half-site | Spacer | Dissociation constant (nM) |
|---|---|---|---|---|---|
| Anti-angiogenesis | MASPIN | GAACA TGTTG | AGGCC TTTTG | G | 9.2 ± 1.7 |
| Apoptosis | Bax | TCACA AGTTA | AGACA AGCCT | G | 73 ± 33 |
| Apoptosis | IGF-BP3 | AAACA AGCCA | CAACA TGCCT | C | 81 ± 25 |
| Apoptosis | Noxa | AGGCA TGCCC | CGGCA AGTTG | 8.6 ± 1.5 | |
| Apoptosis | P2XM | GAACA AGGGC | GAGCT TGTCT | AT | 221 ± 41 |
| Apoptosis | p53AIP1 | TCTCT TGCCC | GGGCT TGTCG | 11.0 ± 1.8 | |
| Apoptosis | p53DINP1 | GAACT TGGGG | GAACA TGTTT | 98 ± 23 | |
| Apoptosis | PUMA-BS1 | CTCCT TGCCT | GGGCT AGGCC | T | 260 ± 50 |
| Apoptosis | PUMA-BS2 | CTGCA AGTCC | TGACT TGTCC | 7.1 ± 1.8 | |
| DNA repair | GADD45 | GAACA TGTCT | AAGCA TGCTG | 7.7 ± 1.2 | |
| DNA repair | p53r2 | TGACA TGCCC | AGGCA TGTCT | 5.7 ± 0.8 | |
| DNA repair | PCNA | GAACA AGTCC | GGGCA TATGT | 6.6 ± 1.4 | |
| Growth arrest | 14-3-3σ 1 | AGGCA TGTGC | CACCA TGCCC | 9.9 ± 2.1 | |
| Growth arrest | p21-3′ | GAAGA AGACT | GGGCA TGTCT | 12.0 ± 7.0 | |
| Growth arrest | p21-5′ | GAACA TGTCC | CAACA TGTTG | 4.9 ± 0.6 | |
| Growth arrest | Cyclin G | AGACA TGCCC | GGGCA AGCCT | 7.8 ± 1.6 | |
| Negative regulation | Mdm2 | GGTCA AGTTG | GGACA CGTCC | 12.3 ± 2.9 |
Figure 1.
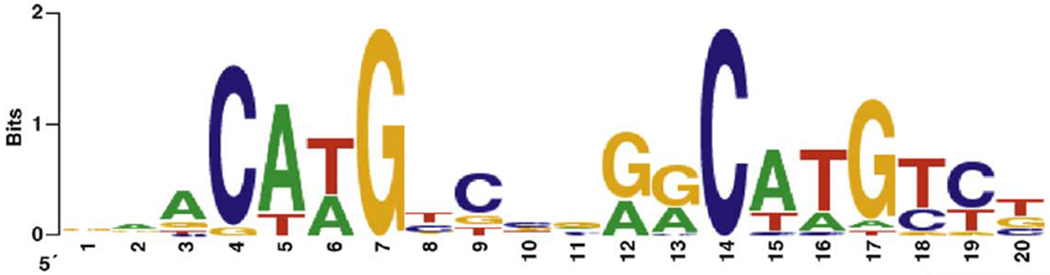
The sequence degeneracy of the REs listed in Table 1 is shown using a logo representation (http://weblogo.berkeley.edu) [75]. Although the functions of the REs are different, the corresponding sequences and binding affinities can be very similar. For example, the dissociation constants range from 7.1 to 11.0 nM for PUMA-BS2, Noxa, and p53AIP1 (apoptosis), whereas the dissociation constants for growth arrest RE such as cyclin G, 14-3-3σ and p21-3′ are between 7.8 and 12.0 nM. The sequences are also very similar between the two groups, with 1–4 bp difference from the consensus for apoptosis, and 0–3 for growth arrest.
We classify the emerging mechanisms through which TFs select specific REs among the many similar ones in the genome. These mechanisms are defined by the sequential order of the transcription initiation process: coregulator recruitment followed by RE binding, RE binding followed by coregulator recruitment and enhanceosome-mediated exposure enabling RE binding. Our mechanistic view derives from considering molecules – proteins and DNA – in terms of dynamic ensembles of conformational states (Box 3). Although crystal snapshots do not provide the complete picture, describing molecules as ‘flexible’ could be misleading because flexibility is often interpreted in terms of single structures undergoing conformational changes induced by binding. The pre-existence of dynamic conformational ensembles is the paradigm in biology and chemistry [12–18], but this idea has been largely overlooked when addressing the crucial mechanistic problem of the functional control of transcriptional initiation. This concept not only provides further mechanistic insight into RE functional recognition scenarios, but can be used to classify them [19].
Box 3. Conformational ensembles and allostery.
In solution, proteins, DNA and RNA exist as ensembles of conformations (or substates) of their native states that are in dynamic equilibrium. The distributions of these conformations in solution are determined by statistical thermodynamics and separated by barriers. The heights of the barriers define the time scales of conformational exchanges. Highly flexible proteins have low barriers, which enable them to flip between different states. When the barriers are very low the proteins become disordered and the population of each state is small and difficult to observe experimentally [89]. Proteins are inherently dynamic, sampling a vast number of conformational states all of which pre-exist in solution. This description of biological macromolecules derives from the energy landscape theory [14]. The key point is that perturbation at any site in the protein structure, such as binding events, mutations or covalent post-translational modifications, will not lead to new conformations; rather they lead to a shift in the distribution of the ensemble. Because all conformations pre-exist, the current paradigm holds that binding events in the cell proceed via the conformational selection of the (geometrically and chemically) most favored conformer even if it has a higher energy [16–18,41,55]. Binding stabilizes this conformer (Figure I). The binding event is followed by a shift of the population towards these conformers. Hence, binding takes place via conformational selection and population shift as the primary recognition mechanism, with the subsequent optimization of the interactions taking place via induced fit. The perturbation at the binding site (or at the site of the covalent modification) is similar to an earthquake; stress released from the focus could dissipate through the propagation of deformation and in the form of waves [90]. This is the origin of the allosteric effect: the perturbation that takes place during the binding of the effector at the allosteric site propagates in the structure, leading to conformational changes. The changes can be minor, for example those observed by the binding of the very similar p53 RE sequences in Table 1. However, they can be amplified, leading to the selection of different coregulators [32]. Although allosteric effects are usually considered in proteins, because DNA also exists in the ensembles of states, they too will display allosteric effects triggered by proteins (e.g. TFs, histones, etc.). Hence, the covalent modifications of histones, even if far away from the DNA-binding site, can be expected to affect nucleosome fluctuations [91,92]. Figure I depicts the shift in the landscape following the binding of a coregulator to a TF.
Figure I.

The free energy landscape and population shift that occurs following binding. On the left-hand side, the TF protein (in pale pink) is complexed with REs (in pink, blue or green). The REs allosterically alter the conformation of the protein, as seen in the changes on the surface of the protein. The complex with the RE (in blue) is the most stable. Via conformational selection [12,16–18], a regulatory protein factor (in purple) binds to the TF whose conformation is most complementary (the one bound to the pink RE). Upon binding the landscape shifts and the complex of the protein, when bound to the RE (in pink), is the most stable.
The current paradigm and emerging complexity of RE recognition
The current paradigm of TF recognition holds that a TF recognizes a specific set of sequences (Box 1). This implicitly assumes that the binding of the TF to the RE is independent of the cellular environment and the post-translational modification state of the TF. Because only a small proportion of all available REs in the genome have been identified for any TF, computational algorithms have been devised to scan genomic sequences and predict REs. Typically, the algorithms first construct weighted matrices from known experimentally verified REs [20]. Prediction is based on such sequence information, conservation patterns and, where available, affinity data and structures of complexes of the TF with its REs [21–24].
However, recent research has begun to question the idea of each TF recognizing a specific set of REs as being universal and by extension whether the REs recognized by different proteins actually are different. For example, a microarray study that examined the DNA sequence space of 104 distinct mouse TFs from 22 structural classes (Box 1) found that, although each TF had distinct sequence preferences, only about half of them bind to distinct DNA motifs [25]. Of particular interest is the affinity of TFs from the same family for REs. For example, interferon regulatory factors 4 and 5 had similar high-affinity sites (which contained CGAAAC), but different low-affinity sites (i.e. TGAAAG versus CGAGAC, respectively). This study implies that similar low-affinity REs can be bound by TFs from different families, but that this not the case for high-affinity binding, and a TF can bind degenerate REs, some with high affinity, others with low affinity.
Although there is distinct sequence preference [26], REs sequences are not necessarily the only factor in determining binding. The cellular network also plays a role in selective binding, for example, by controlling the expression and post-translational states of the TF and its cofactors. Network effects were recently shown by studying concentration changes using synthetic promoters in different environments [27]. Two binding sites switched from activators to repressors, reflecting TF competition for the same site. The glucocorticoid receptor (GR) ultradian (every hour) activation, cycling on and off its targets, thereby allowing transcription to adjust rapidly to hormone fluctuations, provides another striking recent example [28,29]. The tight geometrical packing of TFs and their coactivators on the promoters (and enhanceosomes) also contributes to selectivity.
Microarray readouts of chromatin immunoprecipitation experiments had previously suggested that in yeast low-affinity REs were often used [30] and that such sites contribute as much to TF binding and cellular regulation as do high-affinity sites [31]. As illustrated in Table 1, similar REs can specify different – activation or repression – functions. Recent experimental observations relating to low-affinity binding versus high-affinity binding can be understood when proteins and DNA are considered to exist as ensembles of conformations and that the relative populations of specific conformations reflect the dynamic cellular network (described below). The mechanism of TF binding to the RE depends on the affinity: high-affinity binding is different than low-affinity binding.
The emerging mechanisms and their classification principles
Several recent reports have shed light on DNA binding site recognition by TFs. Research on the GR [32], the enhanceosome [33], the E2F class TFs [34], the peroxisome proliferator–activator receptors, the retinoid X receptor [35], nuclear factor 1 (NF1) [36] and p53 [11,24,26,37,38] have revealed the regulation of transcription initiation from a mechanistic standpoint. Together with previous work on androgen and estrogen receptors [39,40] and recent microarray analysis [25], these reports reveal how specificity is attained in a complex cellular environment.
Protein and DNA molecules exist in vast ensembles of conformational states. Which states are more populated depends on cellular conditions and the specific RE sequence [10]. Fundamental to our understanding of the concept of pre-existing ensembles is that base pair changes in the DNA sequence, post-translational modifications in the TF or the binding of the DNA or protein to other cofactors at different sites will not lead to new conformations. These events will only change the relative concentrations of pre-existing states (i.e. the distribution of the conformational ensemble will be shifted) [41] (Figure I in Box 3). This reflects the inherent dynamic landscape of proteins [16–18] and DNA [42]. Binding events proceed by conformational selection of the most complementary conformational state, which on its own has higher energy, and thereby a low population [12,13,16–19]. However, binding stabilizes this conformation with a subsequent population shift towards this conformer. Population shift is the key to allosteric events (Box 3) [41] and specificity in recognition and regulation [12].
The three emerging mechanisms
Based on the conformational ensemble framework we classify the mechanisms of the recognition of REs by TFs into three groups differentiated by the order of transcription initiation events: (Type I) coregulator recruitment followed by RE binding; (Type II) RE binding followed by coregulator recruitment; and (Type III) enhanceosome-mediated RE binding (Figure 2).
Type I: where all REs are not packed tightly in the chromatin, and are thereby available for binding. In this mechanism, coregulator binding to the TF allosterically shifts the TF population towards a conformation favored to bind a specific RE sequence [10]. Once a TF binds to the RE, transcription initiates (or is repressed) (Figure 2a). NMR data relating to p53 binding to the apoptosis-stimulating protein of p53 (ASPP) illustrates this mechanism [37]. ASPP1 and ASPP2 bind to the p53 DNA-binding domain (DBD) and stimulate the transcription of apoptotic genes; however, the binding of iASPP to predominantly the linker region of the DBD inhibits p53-dependent apoptosis. Which of these three cofactors preferentially bind to the p53 depends on their relative affinities and cofactor concentrations, which are the outcome of cellular conditions [10]. The population view (Box 3) posits that the binding of ASPP1 and ASPP2 to p53 shifts the p53 ensemble towards a conformation favoring binding to the RE that stimulates transcription, whereas the binding of iASPP shifts the ensemble towards a conformation favored for binding the RE that represses transcription. RE binding triggers the respective p53 functional cascade (i.e. transcription stimulating or repressing). An additional example is provided by specific p53-binding patterns in response to stress (e.g. γ-irradiation, UVB), which correlate with particular cyclin-dependent kinase inhibitor A1 (p21) mRNA variant transcription profiles [43]. DNA methylation will also impact on the Type I mechanism [44].
Type II: where REs are similarly available; however, binding to the RE does not necessarily initiate (or repress) transcription (Figure 2b). In this mechanism, binding to the RE shifts the TF population towards conformations that are complementary to the coregulator. In turn, binding to the coregulator amplifies the TF ensemble towards a conformation favored to bind a second (repressor or activator) protein. In the Type II mechanism, only when the coregulator binds to the TF can the already DNA-bound TF initiate (or repress) transcription. The GR is a good example of this mechanism. The role of the DNA RE as an allosteric effector of the steroid receptors has been well established [32,39,40,45–47]. Yamamoto and colleagues have elegantly shown that GR binding to REs differing by a single base pair leads to differential effects in GR conformations and activities [32,46]. Different RE sequences allosterically shift the ensemble of GR conformations via a six-residue segment that connects helix H1 and the dimerization loop (the GR lever arm) with the population distribution further modified through interactions of the ligand-binding receptor domain [47]. The cofactor selects the complementary conformation, thereby initiating the cascading signaling pathway. The allosteric effects of Pit-1 REs on the pituitary-specific POU domain Pit-1 provide a second example [48]. A 2-bp spacer determines whether the subsequent POU-recruited cofactors will activate growth hormone gene expression in somatotrope cell types or restrict expression in lactotropes. The E2F family provides a striking third example [34]. Distinct promoter elements, although presenting the same recognition motif, can lead to differential activation or repression consequences via the recruitment of different cooperating TFs. The E2F elements and their environment selectively bind E2F forms and their partners. Mechanistically, we consider the heterodimer a single TF protein. The redistribution of the conformational states induced by REs in the E2F family heterodimers leads to higher populations of cofactor binding-compatible conformations. Finally, p53 has diverse regulatory roles [49]. It can regulate p21 by the Type I mechanism as discussed. However, in response to stress, p53 can regulate p21 by the Type II mechanism [43], illustrating that the same TF can be regulated by mechanisms acting cooperatively. In another stress-related Type II example, p53 binds to most of its REs under stress [50] and cell lines in unstressed conditions, suggesting that there are no stress specific p53-binding patterns [51]. However, in primary cell lines increased p53 binding to REs and a different binding pattern were observed, falling into Type I.
Type III: where the REs might or might not be available and binding might or might not initiate (or repress) transcription. RE availability can be regulated by the enhanceosome-mediated control of the chromatin state [33] (Figure 2c). NF1 presents an example for such a mechanism [36]. In this mechanism, although the enhanceosome could be thousands of base pairs away, TFs binding and histone acetylase (deacetylase) recruitment lead to chromatin remodeling, that is, shifted chromatin conformational states making the RE (un)available. The third mechanism is crucial to understanding why only a few binding sites are occupied when there are many similar sites to chose from in the genome. Two recent reports address this puzzling question. The first provides data on the ETS gene family [52], which encodes TFs that regulate different developmental processes including cell proliferation, apoptosis, differentiation, migration, transformation and hematopoiesis. ETS proteins were found to frequently occupy redundant sites and to occupy specific binding sites less often. Redundant binding correlated with the promoter regions of housekeeping genes, whereas specific less occupied sites were some distance away from the transcription start sites. A second report provided illuminating quantitative data on Caenorhabditis elegans NF1 [36]. Although 586 REs were identified, only 55 of these were observed to be occupied. Furthermore, 13 885 p53 REs were identified in the entire human genome from paired-end tag (PET) binding data [50]; however, only 454 were observed in human colorectal cancer cells by Chip-PET under conditions that activate p53 expression. In the C. briggsae orthologs, 84% of the identified targets were in promoter regions. These data illustrate that RE availability is crucial for recognition. Availability is controlled by long-range acting elements [33,53] that shift the dynamic chromatin ensemble (Box 3). Chromatin can also assist in selectivity via the RE location. In divergent insects, the location of the enhancer containing the RE for dorsal (DV), a TF related to mammalian NF-kappaB, is conserved [54], with target enhancers containing distinctive combinations of binding sites, raising the possibility of combinatorial locations in higher organisms.
Figure 2.

Three proposed mechanisms of TF selectivity. The classification is based on a conformational ensemble framework. (a) All REs are exposed and available for binding to TFs. The TF selectively binds an RE whose conformation is complementary (here in green). The TF-binding site conformation is allosterically determined by the prior binding events (not shown) of factors whose concentrations are controlled by the cellular network. Once the TF binds to an RE, transcription is initiated (or repressed). (b) All REs are available and the TF can bind to any (or all) REs. The REs allosterically enhance a TF population favored to bind to a specific cofactor. Each RE elicits a slightly different conformation of the binding site (different shapes in the upper part of the TF). The cofactor binds to the binding site conformation, which is complementary. When the cofactor binds, transcription is initiated (or repressed). Here, selectivity is determined by post binding events. (c) Chromatin unavailable REs become exposed through the enhanceosome (e.g. acetylation).
Mechanisms (i) and (ii) are based on the affinity of the TF to the RE: low affinity will use the first mechanism; high affinity, the second. Because there are ~10bp in a complete DNA turn, a spacer ≥3 bp between the two RE half-sites would position the key bases on opposite DNA faces [24]. The expected outcome is specific half-site binding [24,26], which would be accounted for by the Type I mechanism. Strong affinity binding requires full-site interactions [26]. All mechanisms are the outcome of dynamic shifted populations. The perturbation caused by histone acetylation, even though away from its DNA-binding site, will also allosterically propagate [55]; in this case, disturbing and weakening the histone–DNA interactions.
These scenarios were classified by mechanisms rather than by TFs, REs, functions or pathways. The relevance of a mechanistic view is shown by the comprehensive microarray analysis of binding preferences of mouse TFs with all 10 bp sequences [25]. About half of the proteins recognized multiple different motifs (although these motifs could be parts of a single larger site), many with high affinity, providing a rich body of examples of the Type II mechanism. By contrast, similar proteins from the same family that recognized the same highest affinity sites but preferred different lower affinity sites present examples of the Type I mechanism. This work suggests that primary high-affinity sites are consistent with the second mechanism and some secondary low-affinity sites could be accounted for by the first. If the affinity is high, the TF will bind to its RE; however, it will recruit a coactivator only if the RE sequence elicits a binding-favored TF ensemble. By contrast, if the affinity is low, the TF will bind to the RE only following an ensemble shift elicited by a coactivator. In both cases, RE availability via chromatin dynamics is a key factor. To conclude, a mechanistic view allows sorting observations [19]; in turn, a mechanistic classification that derives from dynamic populations of proteins and DNA is expected to be useful towards targeting mechanisms in disease via the allosteric drug design of protein [56] or DNA [57].
Combinatorial assembly: the importance of spacers between consecutive REs
Function is performed by large multi-molecular complexes that are tightly packed. The concomitant tight packing between all molecules in the complex means that it is difficult to replace one molecule with another, especially if it has a different shape (similar to a jigsaw puzzle). This principle is known as combinatorial assembly. The shapes of all parts have to fit together and there is only one way to achieve it, implying that selective binding is geometrical fitting. Combinatorial assembly is a general principle observed in many cellular processes, including the discriminating recognition of PXpsiPXR motifs [58]; viral capsid assembly [59]; protein kinases and the signaling pathways in which they are embedded that can evolve complex properties through the linkage of domains or multi-protein assemblies [60]; the ribosome and tRNA multi-synthetase complex [61]; and the activation of the cell death gene reaper (rpr) expression, which involves a combinatorial assembly of the Hox protein Deformed (Dfd) with at least eight functionally diverse TFs on a minimal enhancer, thereby a large number of TFs in vivo [62]. Finally, a striking example is the assembly of chromatin regulatory complexes, which present sevenfold compaction [63]. The importance of achieving compacted states that accommodate the requirements of DNA methylation, histone modification and the ATP-dependent chromatin remodeling complexes for specific loci recognition is emphasized by histone conservation.
Enhancers contain multiple REs separated by spacers; together with the bound TFs and their cofactors, they constitute a unit [33]. Spacers enable the binding of shape-complementary TFs (Figure 3). However, they disfavor those with sizes that are either too large or too small [1]. Because TFs are multi-domain proteins and differ in their number of domains, organization, size, sequence, structure and in the partners that they bind, the sizes of the spacers and their sequences are important in selecting among the TFs. For example, >80% of the TFs in higher eukaryotes contain helix-turn-helix, zinc finger or leucine zipper DBDs [64]; however, the other domains can differ substantially, as in the FOX family [1,65]. Although they all share ‘forkhead box’ or ‘winged helix’ DBDs [1] and have similar REs, the sequences of other domains can differ. For example, FOXP subfamily members have zinc finger domains and FOXK have forkhead-associated (FHA) domains. FHA nuclear signaling domains (~55–75 residues) can be involved in cell-cycle regulation [66,67]. Similarly, p53 and p73 have similar DBDs, but do not share all other domains [68]. The RE that is selectively bound can be determined by the environment into which the TF has to fit. Shapes and sizes are important for selectivity, suggesting why they are likely to be conserved. Moreover, this implies that it is not only the REs and TFs that are important for selectivity. Spacers between REs are also important.
Figure 3.

Achieving selectivity via the combinatorial assembly mechanism. An RE can be recognized by two TFs; however, although the TF-binding sites are similar, the sizes of the TFs differ. (a) The binding of large TFs fit snuggly with the top cofactor, thereby binding the small TFs fit tightly with a cofactor of another shape. The cofactor of the first would be loose on the second and the cofactor of the second would overlap the TFs of the first. Thus, different TF surfaces enforce selective cofactor recruitment. Red TFs match red REs; purple TFs match purple REs. The spacing between the REs is the same in both cases. (b) Selective binding is enforced via different spacing between the REs. At the top, the spacing between the green and blue REs is short, leading to selective binding by small TFs. At the bottom, the spacing is longer, leading to a preferential binding of larger TFs. The larger TFs cannot bind to the top REs owing to steric hindrance; binding of the smaller TFs at the bottom is also unfavorable, leading to lower stability and a lack of cooperativity.
Concluding remarks and future perspectives
How do TFs selectively recognize their RE targets at any given time? Currently the TF–DNA recognition problem is largely considered from the standpoint of the sequence variability of the REs. Here, we have emphasized that viewing the problem from this perspective overlooks cellular effects and is consequently incomplete. We propose that a better understanding of the recognition problem can be obtained by combining these experimental data with the idea that proteins and DNA exist as heterogeneous conformational ensembles (Box 3). Although conformational ensembles are known to play key roles in biomolecular recognition [12,13,16–19], when addressing this problem molecules have been viewed as single entities. Considering a TF as existing in many distinct conformational states, where the population of each state changes upon binding to a cofactor or to DNA, or upon a covalent post-translational modification, can clarify the picture. Furthermore, similarly considering DNA as also existing in ensembles of distinct conformations where the population of each conformation changes among the degenerate REs enhances the understanding of experimental observations.
Integrating recent observations on TF binding and activation with current concepts of dynamic conformational ensembles enables us to take the first steps in classifying [19] the mechanisms of TF selectivity. This is important because it assists in making sense of observations and predictions. Our classification leads to a deeper understanding not only of how selectivity might be exercised, but also of caveats in experimental procedures to decode these. The mechanisms can be differentiated by the affinity of the TF to its REs; however, when relating experimental affinity measurements to function, the enormously fluctuating cellular environment is the key. Experiments reflecting steady-state cell-based conditions, or solutions in vitro measurements, might not capture the in vivo situation. A striking example is the effects of the overexpression of the p160 steroid receptor coactivator family [69]. Above all, the mechanisms adopted by evolution reflect how, with only four types of bases, a robust response to signals can be obtained. Signal transduction is translated into cellular function via network effects that shift the populations of conformational ensembles; however, at the same time, the preferred conformational states are selected [12–18] based on tight steric constraints. However, much is still unclear, such as whether genes move to ‘factories’ at discrete sites rather than RNA polymerase binding to genes in the ‘native milieu’ as is now believed [70] and the precise role of transcription elongation factors in transcription initiation [71].
Cellular functions must be performed dynamically to reflect the immensely fluctuating cellular network. A single signal can activate functionally-linked genes, as in the case of the chromosomally clustered Hox genes family of TFs, which have a central role in defining the specificity of motor neuron–muscle connectivity [72]; multiple signals activate multiple specific TFs. The network has to efficiently respond to signals transmitted through the membrane [73], and a major way is via TF activating. The question is how the signal is selectively translated at the molecular level. The mechanisms outlined here illustrate the ways through which such a translation might take place.
Here, we have addressed the central problem of TF–DNA interaction specificity and presented recent data that demonstrate how different modes of interaction among DNA-binding proteins and genomic REs can combine to a complex many-to-many function that determines where and how TFs will bind. These proposed mechanisms are useful because they suggest a framework for understanding selective binding, which is a key step in the regulation of transcription initiation. Within this mechanistic framework there are important questions that need to be addressed in the future. What is the percentage of TFs that require a cofactor to recognize a RE? What is the position of the RE relative to transcription start site? When is the event of a TF binding to a RE necessary – but insufficient – for initiating transcription? As additional data emerge a more detailed understanding of specific systems and general mechanisms will assist in figuring out how to control gene-specific activation/repression.
Acknowledgements
Thanks to Dr Tom Schneider and the referees for the careful reading of the manuscript. This project has been funded in whole or in part with federal funds from the National Cancer Institute and National Institute of Health under contract number HHSN261200800001E. The content of this publication does not necessarily reflect the views or policies of the Department of Health and Human Services, nor does mention of trade names, commercial products or organizations imply endorsement by the US Government. This research was supported (in part) by the Intramural Research Program of the NIH, National Cancer Institute, Center for Cancer Research.
References
- 1.Georges AB et al. (2009) Generic binding sites, generic DNA-binding domains: where does specific promoter recognition come from? Faseb J. 24, DOI: 10.1096/fj.09-142117 [DOI] [PubMed] [Google Scholar]
- 2.Li XY et al. (2008) Transcription factors bind thousands of active and inactive regions in the Drosophila blastoderm. PLoS Biology 6, e27. [DOI] [PMC free article] [PubMed] [Google Scholar]
- 3.Gondor A and Ohlsson R (2009) Chromosome crosstalk in three dimensions. Nature 461, 212–217 [DOI] [PubMed] [Google Scholar]
- 4.Sikorski TW and Buratowski S (2009) The basal initiation machinery: beyond the general transcription factors. Curr. Opin. Cell Biol 21, 344–351 [DOI] [PMC free article] [PubMed] [Google Scholar]
- 5.Segal E and Widom J (2009) What controls nucleosome positions? Trends Genet. 25, 335–343 [DOI] [PMC free article] [PubMed] [Google Scholar]
- 6.Hager GL et al. (2009) Transcription dynamics. Mol. Cell 35, 741–753 [DOI] [PMC free article] [PubMed] [Google Scholar]
- 7.John S et al. (2008) Interaction of the glucocorticoid receptor with the chromatin landscape. Mol. Cell 29, 611–624 [DOI] [PubMed] [Google Scholar]
- 8.Li B et al. (2007) The role of chromatin during transcription. Cell 128, 707–719 [DOI] [PubMed] [Google Scholar]
- 9.Zhu C et al. (2009) High-resolution DNA-binding specificity analysis of yeast transcription factors. Genome Res. 19, 556–566 [DOI] [PMC free article] [PubMed] [Google Scholar]
- 10.Pan Y et al. (2009) How do transcription factors select their specific binding sites among a large number of similar binding sites in the genome? Nat. Struct. Mol. Biol 16, 1118–1120 [DOI] [PMC free article] [PubMed] [Google Scholar]
- 11.Riley T et al. (2008) Transcriptional control of human p53-regulated genes. Nat. Rev. Mol. Cell Biol 9, 402–412 [DOI] [PubMed] [Google Scholar]
- 12.Boehr DD et al. (2009) The role of dynamic conformational ensembles in biomolecular recognition. Nat. Chem. Biol 5, 789–796 [DOI] [PMC free article] [PubMed] [Google Scholar]
- 13.Boehr DD and Wright PE (2008) Biochemistry. How do proteins interact? Science 320, 1429–1430 [DOI] [PubMed] [Google Scholar]
- 14.Frauenfelder H et al. (1991) The energy landscapes and motions of proteins. Science 254, 1598–1603 [DOI] [PubMed] [Google Scholar]
- 15.Lange OF et al. (2008) Recognition dynamics up to microseconds revealed from an RDC-derived ubiquitin ensemble in solution. Science 320, 1471–1475 [DOI] [PubMed] [Google Scholar]
- 16.Ma B et al. (1999) Folding funnels and binding mechanisms. Protein Eng. 12, 713–720 [DOI] [PubMed] [Google Scholar]
- 17.Tsai CJ (1999) Folding funnels, binding funnels and protein function. Protein Sci. 8, 1181–1190 [DOI] [PMC free article] [PubMed] [Google Scholar]
- 18.Tsai CJ et al. (1999) Folding and binding cascades: shifts in energy landscapes. Proc. Natl. Acad. Sci. U. S. A 96, 9970–9972 [DOI] [PMC free article] [PubMed] [Google Scholar]
- 19.Tsai CJ et al. (2009) Protein allostery, signal transmission and dynamics: a classification scheme of allosteric mechanisms. Mol. Biosyst 5, 207–216 [DOI] [PMC free article] [PubMed] [Google Scholar]
- 20.Erill I and O’Neill MC (2009) A reexamination of information theory-based methods for DNA-binding site identification. BMC Bioinformatics 10, 57. [DOI] [PMC free article] [PubMed] [Google Scholar]
- 21.Lyakhov IG et al. (2008) Discovery of novel tumor suppressor p53 response elements using information theory. Nucleic Acids Res. 36, 3828–3833 [DOI] [PMC free article] [PubMed] [Google Scholar]
- 22.Mahony S et al. (2007) DNA familial binding profiles made easy: comparison of various motif alignment and clustering strategies. PLoS Comput. Biol 3, e61. [DOI] [PMC free article] [PubMed] [Google Scholar]
- 23.Veprintsev DB and Fersht AR (2008) Algorithm for prediction of tumour suppressor p53 affinity for binding sites in DNA. Nucleic Acids Res. 36, 1589–1598 [DOI] [PMC free article] [PubMed] [Google Scholar]
- 24.Pan Y and Nussinov R (2009) Cooperativity dominates the genomic organization of p53-response elements: a mechanistic view. PLoS Comput. Biol 5, DOI: 10.1371/journal.pcbi.1000448 [DOI] [PMC free article] [PubMed] [Google Scholar]
- 25.Badis G et al. (2009) Diversity and complexity in DNA recognition by transcription factors. Science 324, 1720–1723 [DOI] [PMC free article] [PubMed] [Google Scholar]
- 26.Menendez D et al. (2009) The expanding universe of p53 targets. Nat. Rev. Cancer 9, 724–737 [DOI] [PubMed] [Google Scholar]
- 27.Gertz J and Cohen BA (2009) Environment-specific combinatorial cis-regulation in synthetic promoters. Mol. Syst. Biol 5, DOI: 10.1038/msb2009.1 [DOI] [PMC free article] [PubMed] [Google Scholar]
- 28.Stavreva DA et al. (2009) Ultradian hormone stimulation induces glucocorticoid receptor-mediated pulses of gene transcription. Nat. Cell Biol 11, 1093–1102 [DOI] [PMC free article] [PubMed] [Google Scholar]
- 29.Desvergne B and Heligon C (2009) Steroid hormone pulsing drives cyclic gene expression. Nat. Cell Biol 11, 1051–1053 [DOI] [PubMed] [Google Scholar]
- 30.Tanay A (2006) Extensive low-affinity transcriptional interactions in the yeast genome. Genome Res. 16, 962–972 [DOI] [PMC free article] [PubMed] [Google Scholar]
- 31.Segal E et al. (2008) Predicting expression patterns from regulatory sequence in Drosophila segmentation. Nature 451, 535–540 [DOI] [PubMed] [Google Scholar]
- 32.Meijsing SH et al. (2009) DNA binding site sequence directs glucocorticoid receptor structure and activity. Science 324, 407–410 [DOI] [PMC free article] [PubMed] [Google Scholar]
- 33.Panne D (2008) The enhanceosome. Curr. Opin. Struct. Biol 18, 236–242 [DOI] [PubMed] [Google Scholar]
- 34.Freedman JA et al. (2009) A combinatorial mechanism for determining the specificity of E2F activation and repression. Oncogene 28, 2873–2881 [DOI] [PMC free article] [PubMed] [Google Scholar]
- 35.Chandra V et al. (2008) Structure of the intact PPAR-gamma-RXR-alpha nuclear receptor complex on DNA. Nature 456, 350–356 [DOI] [PMC free article] [PubMed] [Google Scholar]
- 36.Whittle CM et al. (2009) DNA-binding specificity and in vivo targets of Caenorhabditis elegans nuclear factor I. Proc. Natl. Acad. Sci. U. S. A 106, 12049–12054 [DOI] [PMC free article] [PubMed] [Google Scholar]
- 37.Ahn J et al. (2009) Insight into the structural basis of pro- and antiapoptotic p53 modulation by ASPP proteins. J. Biol. Chem 284, 13812–13822 [DOI] [PMC free article] [PubMed] [Google Scholar]
- 38.Wang B et al. (2009) Redefining the p53 response element. Proc. Natl. Acad. Sci. U. S. A 106, 14373–14378 [DOI] [PMC free article] [PubMed] [Google Scholar]
- 39.Reid KJ et al. (2001) Two classes of androgen receptor elements mediate cooperativity through allosteric interactions. J. Biol. Chem 276, 2943–2952 [DOI] [PubMed] [Google Scholar]
- 40.Wood JR et al. (1998) Estrogen response elements function as allosteric modulators of estrogen receptor conformation. Mol. Cell Biol 18, 1927–1934 [DOI] [PMC free article] [PubMed] [Google Scholar]
- 41.Gunasekaran K et al. (2004) Is allostery an intrinsic property of all dynamic proteins? Proteins 57, 433–443 [DOI] [PubMed] [Google Scholar]
- 42.Volker J et al. (2008) DNA energy landscapes via calorimetric detection of microstate ensembles of metastable macrostates and triplet repeat diseases. Proc. Natl. Acad. Sci. U. S. A 105, 18326–18330 [DOI] [PMC free article] [PubMed] [Google Scholar]
- 43.Millau JF et al. (2009) p53 Pre- and post-binding event theories revisited: stresses reveal specific and dynamic p53-binding patterns on the p21 gene promoter. Cancer Res. 69, 8463–8471 [DOI] [PubMed] [Google Scholar]
- 44.Petrovich M and Veprintsev DB (2009) Effects of CpG methylation on recognition of DNA by the tumour suppressor p53. J. Mol. Biol 386, 72–80 [DOI] [PMC free article] [PubMed] [Google Scholar]
- 45.Geserick C et al. (2005) The role of DNA response elements as allosteric modulators of steroid receptor function. Mol. Cell Endocrinol 236, 1–7 [DOI] [PubMed] [Google Scholar]
- 46.Gronemeyer H and Bourguet W (2009) Allosteric effects govern nuclear receptor action: DNA appears as a player. Sci. Signal 2, DOI: 10.1126/scisignal.273pe34 [DOI] [PubMed] [Google Scholar]
- 47.Nagy L and Schwabe JW (2004) Mechanism of the nuclear receptor molecular switch. Trends Biochem. Sci 29, 317–324 [DOI] [PubMed] [Google Scholar]
- 48.Scully KM et al. (2000) Allosteric effects of Pit-1 DNA sites on long-term repression in cell type specification. Science 290, 1127–1131 [DOI] [PubMed] [Google Scholar]
- 49.Espinosa JM (2008) Mechanisms of regulatory diversity within the p53 transcriptional network. Oncogene 27, 4013–4023 [DOI] [PMC free article] [PubMed] [Google Scholar]
- 50.Wei CL et al. (2006) A global map of p53 transcription factor binding sites in the human genome. Cell 124, 207–219 [DOI] [PubMed] [Google Scholar]
- 51.Shaked H et al. (2008) Chromatin immunoprecipitation-on-chip reveals stress-dependent p53 occupancy in primary normal cells but not in established cell lines. Cancer Res. 68, 9671–9677 [DOI] [PubMed] [Google Scholar]
- 52.Hollenhorst PC et al. (2007) Genome-wide analyses reveal properties of redundant and specific promoter occupancy within the ETS gene family. Genes Dev. 21, 1882–1894 [DOI] [PMC free article] [PubMed] [Google Scholar]
- 53.Rubtsov MA et al. (2006) Chromatin structure can strongly facilitate enhancer action over a distance. Proc. Natl. Acad. Sci. U. S. A 103, 17690–17695 [DOI] [PMC free article] [PubMed] [Google Scholar]
- 54.Cande J et al. (2009) Conservation of enhancer location in divergent insects. Proc. Natl. Acad. Sci. U. S. A 106, 14414–14419 [DOI] [PMC free article] [PubMed] [Google Scholar]
- 55.del Sol A et al. (2009) The origin of allosteric functional modulation: multiple pre-existing pathways. Structure 17, 1042–1050 [DOI] [PMC free article] [PubMed] [Google Scholar]
- 56.Lee GM and Craik CS (2009) Trapping moving targets with small molecules. Science 324, 213–215 [DOI] [PMC free article] [PubMed] [Google Scholar]
- 57.Chenoweth DM and Dervan PB (2009) Allosteric modulation of DNA by small molecules. Proc. Natl. Acad. Sci. U. S. A 106, 13175–13179 [DOI] [PMC free article] [PubMed] [Google Scholar]
- 58.McDonald CB et al. (2009) SH3 domains of Grb2 adaptor bind to PXpsiPXR motifs within the Sos1 nucleotide exchange factor in a discriminate manner. Biochemistry 48, 4074–4085 [DOI] [PMC free article] [PubMed] [Google Scholar]
- 59.Cardone G et al. (2009) Visualization of a missing link in retrovirus capsid assembly. Nature 457, 694–698 [DOI] [PMC free article] [PubMed] [Google Scholar]
- 60.Pawson T and Kofler M (2009) Kinome signaling through regulated protein-protein interactions in normal and cancer cells. Curr. Opin. Cell Biol 21, 147–153 [DOI] [PubMed] [Google Scholar]
- 61.Ray PS et al. (2007) Macromolecular complexes as depots for releasable regulatory proteins. Trends Biochem. Sci 32, 158–164 [DOI] [PubMed] [Google Scholar]
- 62.Stobe P et al. (2009) Multifactorial regulation of a Hox target gene. PLoS Genet. 5, DOI: 10.1371/journal.pgen.1000412 [DOI] [PMC free article] [PubMed] [Google Scholar]
- 63.Wu JI et al. (2009) Understanding the words of chromatin regulation. Cell 136, 200–206 [DOI] [PMC free article] [PubMed] [Google Scholar]
- 64.Lewin B (2000) Initiation of transcription-promoters for RNA polymerase II have short sequence elements Genes VII. 634–637, Oxford University Press [Google Scholar]
- 65.Kaestner KH et al. (2000) Unified nomenclature for the winged helix/ forkhead transcription factors. Genes Dev. 14, 142–146 [PubMed] [Google Scholar]
- 66.Mahajan A et al. (2008) Structure and function of the phosphothreonine-specific FHA domain. Sci. Signal 1, DOI: 10.1126/scisignal.151re12 [DOI] [PubMed] [Google Scholar]
- 67.Liang X and Van Doren SR (2008) Mechanistic insights into phosphoprotein-binding FHA domains. Acc. Chem. Res 41, 991–999 [DOI] [PMC free article] [PubMed] [Google Scholar]
- 68.Tozluoglu M et al. (2008) Cataloging and organizing p73 interactions in cell cycle arrest and apoptosis. Nucleic Acids Res. 36, 5033–5049 [DOI] [PMC free article] [PubMed] [Google Scholar]
- 69.Xu J et al. (2009) Normal and cancer-related functions of the p160 steroid receptor co-activator (SRC) family. Nat. Rev. Cancer 9, 615–630 [DOI] [PMC free article] [PubMed] [Google Scholar]
- 70.Sutherland H and Bickmore WA (2009) Transcription factories: gene expression in unions? Nat. Rev. Genet 10, 457–466 [DOI] [PubMed] [Google Scholar]
- 71.Formosa T (2008) FACT and the reorganized nucleosome. Mol. Biosyst 4, 1085–1093 [DOI] [PubMed] [Google Scholar]
- 72.Dasen JS and Jessell TM (2009) Hox networks and the origins of motor neuron diversity. Curr. Top. Dev. Biol 88, 169–200 [DOI] [PubMed] [Google Scholar]
- 73.Ma B and Nussinov R (2009) Amplification of signaling via cellular allosteric relay and protein disorder. Proc. Natl. Acad. Sci. U. S. A 106, 6887–6888 [DOI] [PMC free article] [PubMed] [Google Scholar]
- 74.Weinberg RL et al. (2005) Comparative binding ofp53 to its promoter and DNA recognition elements. J. Mol. Biol 348, 589–596 [DOI] [PubMed] [Google Scholar]
- 75.Schneider TD and Stephens RM (1990) Sequence logos: a new way to display consensus sequences. Nucleic Acids Res. 18, 6097–6100 [DOI] [PMC free article] [PubMed] [Google Scholar]
- 76.Narlikar L and Hartemink AJ (2006) Sequence features of DNA binding sites reveal structural class of associated transcription factor. Bioinformatics 22, 157–163 [DOI] [PubMed] [Google Scholar]
- 77.Wingender E et al. (2001) The TRANSFAC system on gene expression regulation. Nucleic Acids Res. 29, 281–283 [DOI] [PMC free article] [PubMed] [Google Scholar]
- 78.Berger MF et al. (2008) Variation in homeodomain DNA binding revealed by high-resolution analysis of sequence preferences. Cell 133, 1266–1276 [DOI] [PMC free article] [PubMed] [Google Scholar]
- 79.Grove CA et al. (2009) A multiparameter network reveals extensive divergence between C. elegans bHLH transcription factors. Cell 138, 314–327 [DOI] [PMC free article] [PubMed] [Google Scholar]
- 80.Tan K et al. (2008) A systems approach to delineate functions of paralogous transcription factors: role of the Yap family in the DNA damage response. Proc. Natl. Acad. Sci. U. S. A 105, 2934–2939 [DOI] [PMC free article] [PubMed] [Google Scholar]
- 81.Sandelin A and Wasserman WW (2009) Prediction of nuclear hormone receptor response elements. Mol. Endocrinol 19, 595–606 [DOI] [PubMed] [Google Scholar]
- 82.Ma B et al. (2007) Sequence analysis of p53 response elements suggests multiple binding modes of the p53 tetramer to DNA targets. Nucleic Acids Res. 35, 2986–3001 [DOI] [PMC free article] [PubMed] [Google Scholar]
- 83.Levine M and Tjian R (2003) Transcription regulation and animal diversity. Nature 424, 147–151 [DOI] [PubMed] [Google Scholar]
- 84.van Nimwegen E (2003) Scaling laws in the functional content of genomes. Trends Genet. 19, 479–484 [DOI] [PubMed] [Google Scholar]
- 85.Babu MM et al. (2004) Structure and evolution of transcriptional regulatory networks. Curr. Opin. Struct. Biol 14, 283–291 [DOI] [PubMed] [Google Scholar]
- 86.Brivanlou AH and Darnell JE Jr (2002) Signal transduction and the control of gene expression. Science 295, 813–818 [DOI] [PubMed] [Google Scholar]
- 87.Phillips T and Hoopes L (2008) Transcription factors and transcriptional control in eukaryotic cells. Nature Education 1 [Google Scholar]
- 88.Balaji S et al. (2006) Comprehensive analysis of combinatorial regulation using the transcriptional regulatory network of yeast. J. Mol. Biol 360, 213–227 [DOI] [PubMed] [Google Scholar]
- 89.Tsai CJ et al. (2001) Structured disorder and conformational selection. Proteins 44, 418–427 [DOI] [PubMed] [Google Scholar]
- 90.Ansari A et al. (1985) Protein states and proteinquakes. Proc. Natl. Acad. Sci. U. S. A 82, 5000–5004 [DOI] [PMC free article] [PubMed] [Google Scholar]
- 91.Hodges C et al. (2009) Nucleosomal fluctuations govern the transcription dynamics of RNA polymerase II. Science 325, 626–628 [DOI] [PMC free article] [PubMed] [Google Scholar]
- 92.Poirier MG et al. (2009) Dynamics and function of compact nucleosome arrays. Nat. Struct. Mol. Biol 16, 938–944 [DOI] [PMC free article] [PubMed] [Google Scholar]