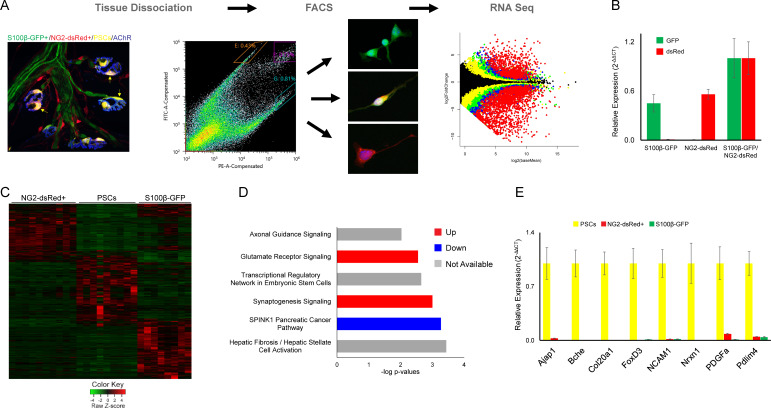
Figure 5. Molecular analysis of S100β-GFP+;NG2-dsRed+ PSCs, S100β-GFP+ Schwan cells, and NG2-dsRed+ cells following isolation with FACS.
(A) Skeletal muscle from juvenile S100B-GFP;NG2-dsRed mice was dissociated and S100-GFP+;NG2-dsRed+ PSCs, S100β-GFP+ Schwan cells, and NG2-dsRed+ cells were sorted by FACS for RNA seq and qPCR. Representative fluorescence intensity gates for sorting of S100β-GFP+, NG2-dsRed+ and S100β-GFP+;NG2-dsRed+ cells are indicated in the scatter plot. GFP (y-axis) and dsRed (x-axis) fluorescence intensities were used to select gates for S100β-GFP+ cells (outlined in orange), NG2-dsRed+ cells (outlined in teal), and double labeled S100β-GFP+;NG2-dsRed+ cells (outlined in purple). Representative images of cells from sorted populations are shown. (B) GFP and dsRed qPCR was performed on FACS isolated cells to confirm specificity of sorting gates. (C) A heat map of RNA-seq results depicting genes with at least 5 counts and expression differences with a p-value of less than 0.01 between any 2 cell types reveals a distinct transcriptome in S100β-GFP+;NG2-dsRed+ PSCs versus S100β-GFP+ Schwann cells and NG2-dsRed+ cells. (D) Synaptogenesis and axon guidance signaling are among the most influential signaling pathways in PSCs according to Ingenuity Pathway Analysis of genes enriched in PSCs versus S100β-GFP+, and NG2-dsRed+ cells. (E) qPCR was performed on FACS isolated S100-GFP+;NG2-dsRed+ PSCs, S100β-GFP+ Schwan cells, and NG2-dsRed+ cells to verify mRNA levels of RNA seq identified PSC enriched genes. In each analysis, transcripts were not detected or detected at low levels in S100β-GFP+ Schwann cells and NG2-dsRed+ cells. Error bar = standard error of the mean. Scale bar = 10 µm.

