

Abstract
Phage G has the largest capsid and genome of any known propagated phage. Many aspects of its structure, assembly, and replication have not been elucidated. Herein, we present the dsDNA-packed and empty phage G capsid at 6.1 Å and 9 Å resolution, respectively, using cryo-EM for structure determination and mass spectrometry for protein identification. The major capsid protein, gp27, is identified and found to share the HK97-fold universally conserved in all previously solved dsDNA phages. Trimers of the decoration protein, gp26, sit on the 3-fold axes and are thought to enhance the interactions of the hexameric capsomeres of gp27, for other phages encoding decoration proteins. Phage G’s decoration protein is longer than what has been reported in other phages, and we suspect the extra interaction surface area helps stabilize the capsid. We identified several additional capsid proteins, including a candidate for the prohead protease responsible for processing gp27. Furthermore, cryo-EM reveals a range of partially full, condensed DNA densities that appear to have no contact with capsid shell. Three analyses confirm that the phage G host is a Lysinibacillus, and not Bacillus megaterium: identity of host proteins in our mass spectrometry analyses, genome sequence of the phage G host and host range of phage G.
Keywords: phage G, decoration proteins, Lysinibacillus, DNA packaging, DNA condensates
GRAPHICAL ABSTRACT
INTRODUCTION
Phage G is a bacteriophage with a remarkably large capsid (~180 nm in diameter at the 5-fold vertex) and packaged genome length (626 kbp) [1–5] compared to the median genome size of 52 kbp derived from available phage sequences [6]. Phage G was originally isolated and characterized using a host bacterium classified as Bacillus megaterium [1]. Since its discovery in 1968, structural studies of this phage have had limited resolution [1–3–5,7], eventually achieving cryo-EM resolution of 15 Å [5]. The reported limitation to resolution is the large size [5] and challenges in culturing and purifying the intact virion.
All tailed dsDNA phages share several structural features, including major capsid proteins that have a tertiary structure in common, the HK97 fold [8,9]. The HK97 fold is identifiable by its characteristic core domains, the N terminus arm, E loop, A domain, and P domain [9,10]. In addition to the major capsid protein, many dsDNA, tailed phages encode decoration proteins located on the outer surface of the major capsid network [11–13]. These decoration proteins have been observed at different positions and in different oligomerization states, but are frequently observed as trimers [14,15], as in phages Lambda and TW1[12,16]. The trimeric decoration proteins are thought to stabilize the 3-fold symmetry axes between three major capsid protein hexamers, and therefore, the overall capsid organization [11,12], by various proposed mechanisms [11–16].
The size of the G capsid raises many questions regarding (1) how such a large structure assembles, packages such a lengthy dsDNA genome, and maintains stability, and (2) what differences exist in relation to smaller ds DNA phages. In addressing these questions, we have characterized the phage G virion structure using cryo-EM and mass spectrometry. We have identified the major capsid proteins and reconstructed empty capsid and dsDNA-packed virions to 9 Å and 6.1 Å resolution, respectively. Our reconstructions highlighted the lack of regular, concentric rings of packaged DNA observed in most phages [17–21], suggesting a potentially novel phage G dsDNA packing mechanism. Additionally, our reconstruction shows the presence of a decoration capsid protein, gp26, which we propose is responsible for stabilizing the major capsid protein (MCP), gp27, hexamers. Consistent with this proposal, our SDS-PAGE results confirmed the phage G capsid is not stabilized by intermolecular covalent bonding interactions, as in the case with HK97 [9].We found the first smaller-than-capsid, packaged DNA that appears to be detached from the inner capsid wall. We corrected the identity of the phage G host to a Lysinibacillus species.
RESULTS
Phage G empty and full capsid cryo-EM reconstruction.
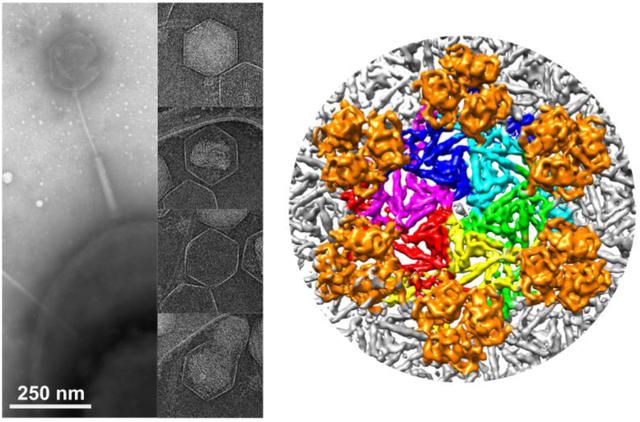
In our studies, we used single-particle cryo-EM [22] to image purified phage G particles, as shown in a representative micrograph (Figure 1A). Data collection and reconstruction statistics are shown in Table 1. Phage particles in micrographs consist mostly of DNA-filled virions, with subpopulations of both empty phage particles and partially DNA-filled capsids. Our capsid structures of phage G’s DNA-full (Figure 1B, Supplementary Figure S2B,D) and empty (Supplementary Figure S2A,C) were reconstructed with jspr [23] to 6.1 Å and 9 Å resolution, respectively, using the “gold-standard” FSC criterion [23] (Supplementary Figure S1). In total, 2,564 and 243 particles were used to reconstruct the dsDNA full and empty capsid densities, respectively. More in depth surface view depictions of both empty and full G capsid structures are outlined in Supplementary Figure S2. The empty and full capsid reconstructions superimpose very well and we, therefore, only further depict the higher resolution full reconstruction in Figure 1B.
Figure 1: Phage G capsid cryo-EM structure.

A) A representative micrograph shows particles with various capsid states. B) Phage G dsDNA-full capsid reconstruction at 6.1 Å resolution with 2,564 particles. The structure displayed is surface colored radially using the color bar on the right.
Table 1:
Phage G cryo-EM reconstruction and model statistics
| Parameters | Full capsid | Empty capsid |
|---|---|---|
| Nominal magnification | 8700 | |
| Voltage (KeV) | 300 | |
| Electron exposure (e-/Å2) | 14.5 | |
| Defocus range (um) | 1 – 5 | |
| Detector | K2 | |
| Movies | 375 | |
| Beam size (um) | 3.35 | |
| Symmetry imposed | icosahedral | |
| Total particles for reconstruction | 2564 | 243 |
| Pixel size in reconstruction (Å) | 1.742 | 2.900 |
| Box size used for reconstruction (pixels) | 1280 | 768 |
| Map resolution (Å) | 6.1 | 9.0 |
| FSC threshold | 0.143 | |
| Image processing software used | jspr | |
| EMDB Accession | EMD-21695 | EMD-21702 |
| PDB Statistics | Modeling | |
| Clashscore | 2 | |
| Ramachandran outlier percentile | 7.0 % | |
| Sidechain outlier percentile | 5.8 % | |
| Bond length RMSZ1 | 1.86 | |
| Bond angles RMSZ | 2.04 | |
| PDB Accession | 6WKK | |
RMSZ is the root-mean-square of all Z scores in the whole deposited model (number of standard deviations the observed value is removed from the expected value)
Phage G gp27 hexamer and gp26 trimer organization.
Phage G has the largest bacteriophage capsid reported to date with an average diameter of ~180 nm along the 5-fold vertex [5]. Its capsid is composed of gp27 hexamers and gp26 trimers organized into T=52 dextro (h=2, k=6) icosahedral symmetry (Supplementary Figure S3). The structure of gp27 (Figure 2B), the 282 amino acid phage G MCP [24], was first modeled using Robetta [25]. This structure was then refined to the densities of gp27 in the virion 3D map using Molecular Dynamics Flexible Fitting (MDFF) method [26]. The phage G gp27 model (Figure 2B) reported high similarity in structure to HK97’s major capsid protein, gp5 [9]. Despite the structural similarity, phage G’s gp27 and HK97’s mature gp5 have only 23% protein sequence identity, as determined by blastp alignment [27]. Sequence alignment of phage G’s gp27 and HK97’s gp5 revealed 102 extra amino acids in the N-terminus of HK97 gp5 [28]. In HK97 gp5, the first 102 amino acids comprise the coiled-coil delta domain, which serves as a scaffold during procapsid assembly, but is removed by cleavage during maturation [28,29].
Figure 2: Phage G major capsid protein hexamer and decoration protein trimer arrangement.
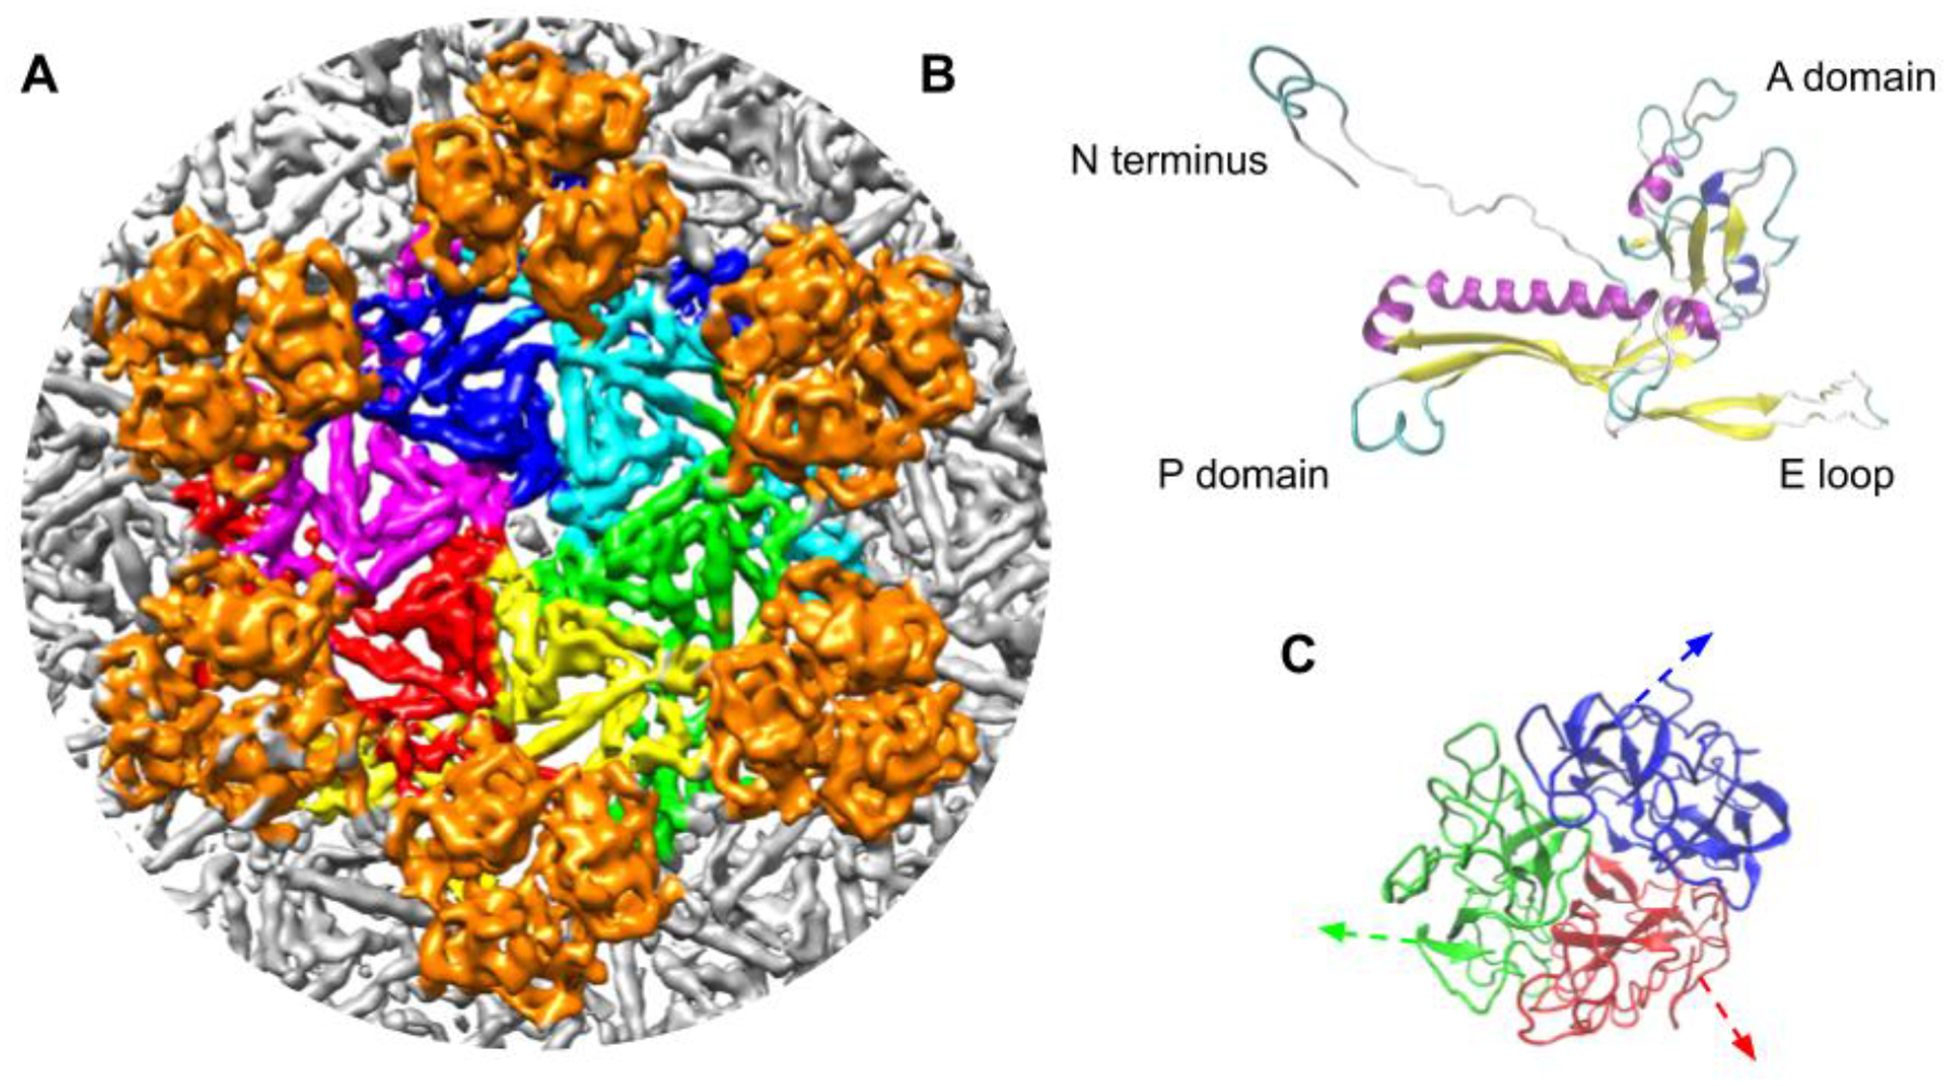
A) Phage G’s major capsid protein, gp27, and its decoration protein, gp26 arrangement. The structure shows gp27 hexamers and gp26 trimers positioned at the 3-fold axes around the hexamers. B) An overview of phage G’s gp27 homology model. All 3 domains of the structure are consistent with the domains described in HK97’s major capsid protein including the A domain, E loop, P domain. C) The phage G decoration, gp26, protein oligomerizes into trimers. The first 15 amino acids were omitted in modeling because of their flexibility. Arrows indicate the direction the N-terminus extends in the capsid density contacting neighboring gp27 subunits.
Phage G’s capsid had a decoration protein, identified as gp26, organized into trimers on the outer surface of the capsid [5]. The trimers were arranged around the 3-fold axes between three MCP hexamers (Figure 2C). The trimers are similar in structure and arrangement to what has been described for the decoration proteins of phages Lambda and TW1 [12,16]. All three trimers contain a compact, beta sheet-rich core and an N-terminal extension. Phage G’s gp26 is 55 amino acids longer than Lambda’s gpD and 17 amino acids longer than gp56 of TW1 [12,16]. Because of this limitation, we used TW1’s gp56 [12] as a reference for structure modeling of phage G’s trimeric decoration protein, gp26, from the observed EM density (Figure 2A). Homology modeling, docking, and refinement of gp26 into our density suggests a flexible N-terminal portion of approximately 15 amino acids, which was omitted from the model in Figure 2C.
In Lambda’s 6.8 Å resolution capsid structure, a density bridges the N-terminal extension of the decoration protein, gpD, with the major capsid protein E-loop region [16], suggesting a stabilizing interaction between the two, and we observed a density in a similar position between phage G decoration protein gp26 and MCP gp27. The marine Siphoviridae, TW1, decoration protein structure and organization also closely resemble phage G’s capsid structure [12]. All 3 decoration proteins have extended, flexible N-terminal segments that interact with major capsid protein hexamers [12,16,30].
Lack of concentric DNA rings in the phage G virion structure.
In all previously reported bacteriophage virion structures [18,20,31,32], a concentric ring pattern emerges from symmetrical reconstructions of the dsDNA genome in the capsid, even if less than half the phage DNA is packaged. However, we observed no concentric rings in our symmetric phage G capsid reconstruction (Figure 3A). Correspondingly, it is evident in the radial density plots that the signature equispaced intensities from phage DNA packaged in the capsid are absent in our analysis (Figure 3C). DNA-derived intensity, however, does exist in our virion reconstruction because the pixel intensity in the DNA-packed structure is higher than it is for the empty structure (Figure 3C), as expected.
Figure 3: Lack of concentric dsDNA rings in the phage G DNA-full structure.

A) Middle volume slice of phage G’s DNA-full capsid. B) Middle volume slice of phage G’s empty capsid. C) Radial distance plots were generated for the dsDNA-full (blue) and empty (orange) phage G structures.
Partially full DNA condensates within the phage G capsid.
To further explore the reason behind the lack of concentric rings in our virion reconstruction, we visually sorted the particles in our micrographs as summarized in Table 2. Among 3,620 phage G capsid particles from our cryo-EM dataset, we sorted into 4 categories: DNA-full, partially full, capsid ruptured, and empty (no DNA visible); examples are in Figure 4. Overall, 88.6 % of virus particles were classified as DNA-full, 8.0 % empty, 2.3 % DNA-partially full, and 1.0 % ruptured with some condensed DNA retained. All particles categorized as partially full can be seen in Supplementary Figure S4. All particles categorized as ruptured with associated condensed DNA are shown in Supplementary Figure S5.
Table 2:
Phage G capsid state counts (total count = 3620)
| State | Full | Empty | Partially full | Ruptured |
|---|---|---|---|---|
| Count | 3207 | 293 | 84 | 36 |
| Percent | 88.6 % | 8.0 % | 2.3 % | 1.0 % |
Figure 4: Multiple DNA states in phage G capsids seen in cryo-EM micrographs.

Multiple states of DNA packaged inside phage G capsid in our cryo-EM micrographs were categorized into 4 classes: full, empty, partial, and ruptured. Representative particles for each category are shown.
We further characterized 84 DNA-partially full particles by measuring the apparent width of the condensed DNA in the smallest dimension (Figure 5). The values ranged from 495 Å to 1606 Å and have an average of 1341 Å, about 84 % of the average diameter of the capsid (1590 Å from Figure 3C). A particle with ~816 Å DNA (Figure 5, leftmost inset) is particularly interesting as its shape clearly resembles a side view of a DNA toroid.
Figure 5: Histogram of partial DNA diameter.

We further analyzed the group of 84 particles categorized as having partially full, compacted DNA density, by plotting a histogram of their DNA density width measured in the shortest dimension. The measured DNA density diameter values within the group of heterogeneous DNA density phage G capsids ranged from 495 Å to 1606 Å. Some particles appear to have toroid-like organizations from the side and top views as shown in the left two insets in this figure.
To visualize particles of this type in 3D, we used cryo-electron tomography on our phage G cryo-EM grid. From these data, we found one particle that appeared to have partially packaged DNA (Supplementary Figure S6, bottom right), relative to neighboring full particles (Supplementary Figure S6, top right). Also, it appeared to have a gap between the capsid shell and the DNA density - supporting our observations from the single-particle cryo-EM micrographs (Supplementary Figure S4). The low abundance in our cryo-ET data collected reflected the low abundance of these partially full particles in our dataset (2.3 %).
Identification of phage G proteins by mass spectrometry.
Sixty-one phage G proteins were detected by mass spectrometry analyses with an FDR of 0 % and a minimum number of two peptides (Supplementary Table S1). An additional twenty-two phage G proteins were identified with a single peptide (the mass spectra of each was visually inspected prior to inclusion in Supplementary Table S1). The number of individual proteins we detected in phage G is comparable to the numbers of different proteins identified in other large myovirus [33–38]. The identified phage G proteins ranged in molecular weight from 5.7 kDa for gp429, a protein of unknown function, to 313.2 kDa for gp183, the putative tape measure protein, i.e., the protein that determines the length of the tail [40]. The total number of mass spectra identified for the phage G proteins varied from 1 for 17 proteins to 427 for gp255 (Supplementary Table S1). The range of mass spectral counts for the different proteins reflects in part, variable copy numbers. For instance, high numbers of total mass spectra were identified for gp26 and gp27, consistent with the structural determination that these proteins are present in high copy numbers in the head. Among the proteins for which low numbers of total mass spectra were identified (Supplementary Table S1), were proteins that are candidates for lysins (gp23) and holins (gp24 and gp25). Identification of gps 23–25 was unexpected since lysis proteins are not present in the virion, suggesting they co-purified with the phage. Nonetheless, we believe the majority of phage G proteins identified by mass spectrometry are virion proteins because many non-virion proteins (e.g., the terminase protein, gp1, and DNA polymerase, gp329) were not detected.
The genes encoding mass spectrometry-identified capsid proteins are distributed throughout the phage G genome, highlighting the absence of major morphogenesis gene region, unlike many other tailed phages. The major implication is that for the many phage G virion genes whose functions have not been determined using sequence-based searches, their functions also cannot be hypothesized based on their gene locale. Nonetheless, we noted that the proteins known to be essential for the formation of a tailed phage icosahedral capsid all had their genes located within a relatively short region of the phage G genome between G_1 and G_27 (Figure 6). These genes included those for the large terminase subunit (gp1), portal protein (gp14), prohead protease (gp19, see below), head decoration protein (gp26) and MCP (gp27). These proteins were all detected by mass spectrometry (Table 3), with the exception of the large terminase protein, because of its transient role during morphogenesis [41].
Figure 6: Identification of major Phage G head proteins by mass spectrometry.

(A) Phage G genome region encoding the major head morphogenesis genes, including the terminase, portal, candidate prohead protease, major capsid protein (MCP) and head decoration protein (Dec). Genes whose products were identified by mass spectrometry are shaded blue. (B) SDS-PAGE gel of sucrose gradient purified Phage G virions. Individual gel slices that were subjected to mass spectrometric analyses are indicated. The mass spectral protein sequence coverage of the major capsid protein gp27 from different gel slices are shown in (C) gel slice 4, (D) gel slice 3, and (E) gel slice 2. Red arrow indicates cleavage by the prohead protease, gp19. The mass spectral protein sequence coverage of the head decoration protein gp26 from gel slice 2 is shown in (F). Amino-acids matched to a mass spectrum are shaded in yellow. Amino-acids marked in green potentially have a post-translational modification (e.g., phosphorylation).
Table 3:
Phage G capsid morphogenesis gene products encoded in the main head gene region (see Fig. 6)
| Mass spectrometry analysis | |||||
|---|---|---|---|---|---|
| Accession number1 | MW (kDa) | Exclusive peptides | Total spectra | Sequence coverage (%) | Putative function/comment, best HHpred match (E-value)2 |
| G_1 | 63.5 | ND | Terminase large subunit, 3CPE_A DNA packaging protein gp17 T4 phage (1.4E-33) | ||
| G_2 | 46.7 | 7 | 12 | 22.6 | Predicted Zinc-dependent peptidase, 5EUF_B Protease (1.4E-48) |
| G_3 | 25.2 | ND | Transcriptional regulator, 4NQW_A ECF RNA polymerase sigma factor (7.1E-22) | ||
| G_4 | 30.8 | ND | |||
| G_5 | 41.6 | 1 | 1 | 2.9 | |
| G_6 | 8.1 | 3 | 4 | 29.9 | |
| G_7 | 104.2 | ND | |||
| G_8 | 15.1 | ND | |||
| G_9 | 15.2 | ND | |||
| G_10 | 5.3 | ND | |||
| G_11 | 43.7 | 9 | 28 | 28.5 | Candidate for prohead scaffold, coils prediction, pI 4.12 |
| G_12 | 13.6 | ND | |||
| G_13 | 10.2 | ND | |||
| G_14 | 72.1 | 8 | 8 | 12.9 | Portal, PF04860.12 (2.9E-20) |
| G_15 | 53.6 | 3 | 4 | 7.1 | Possible minor capsid protein, PF06152.11, Phage_min_cap2 (E-value: 0.18) |
| G_16 | 14.0 | ND | |||
| G_17 | 11.9 | 1 | 1 | 15.5 | |
| G_18 | 9.4 | 1 | 2 | 10.5 | |
| G_19 | 33.6 | 5 | 5 | 16.8 | Putative prohead protease, PF04586.17; Peptidase_S78 (3.0E-16) |
| G_20 | 18.9 | ND | |||
| G_21 | 55.4 | 6 | 11 | 17.0 | Candidate for prohead scaffold, coils prediction, pI 4.83 |
| G_22 | 26.9 | 4 | 4 | 17.6 | Candidate endolysin, 1JWQ_A N-acetylmuramoyle-L-alanine amidase (3.3E-30) |
| G_23 | 61.0 | 4 | 6 | 15.3 | Predicted ribosomal slippage extending G_22 CDS |
| G_24 | 19.9 | 2 | 5 | 21.3 | Three predicted transmembrane helices (residues 7–26; 41–60; 72–94) |
| G_25 | 13.3 | 2 | 6 | 24.4 | PF09682.10; Phage_holin_6_1 (1.7E-19). Predicted transmembrane helix (residues 5–27) |
| G_26 | 17.3 | 49 | 424 | 68.5 | Head decoration |
| G_27 | 31.2 | 36 | 185 | 66.8 | Major capsid, 3QPR_A Major capsid protein (4.1E-30) |
Proteins detected by mass spectrometry, labeled as annotated in the GenBank: JN638751.1 deposited phage G genome. See Supplementary Table 1 for details.
See Supplementary File 1 for HHpred alignments. HHpred matches with an E-value >0.18 were not included. ND, Not detected by mass spectrometry
Mass spectral detection of proteolytic processing of the major capsid protein.
Inspection of the mass spectral sequence coverage of the MCP, gp27, provided further evidence that this protein is cleaved during head maturation. Two semi-tryptic peptides were identified for gp27 supporting that gp27 is cleaved C-terminal to A-27: 28-QAMANPIR-35 in gel slice 2 (Fig. 6) and 28-QAMANPIRVSLDYQGVGRKLLVVDPLPQGALPVYDK-63 in gel slice 3. This site in gp27 was previously identified as the maturation cleavage site using Edman degradation [5]. In addition, we observed that the peptide coverage of gp27 in higher molecular weight gel slices including the tryptic peptide (24-VALAQAMANPIR-35, at a 100 % peptide identification probability). The identification of this peptide indicates that cleavage after A-27 did not occur in all copies of gp27 (Figure 6C–D) and suggests heterogeneous processing of the gp27 N-terminal propeptide, as observed for the MCPs of other large myoviral capsids [2].
Identification of a candidate for the phage G prohead protease.
The identification of proteolytic processing in phage G gp27 (Figure 6B–E) induced us to search for the protease responsible for its cleavage. Although the phage G genome encodes several protease candidates (e.g., gp2 and gp257, annotated as a “zinc-dependent peptidase” and a “ClpP-like protease,” respectively [24]) our bioinformatics analyses support gp19 as a stronger candidate for the phage G prohead protease. The reasons are the following.
We initially identified gp19 as a prohead protease candidate via a Psi-Blast search from gp19 which revealed matches to prohead proteases from other tailed phages. These include a match to gp77, the putative protease of Rhodococcus phage E3 (YP_008061118) in the first iteration (1e–21), and the known prohead protease gp123 (which has a nested scaffold gp123*) of Bacillus phage 0305phi8–36 (YP_001429613.1) in the second iteration (2e–12). A HHpred [43] search from phage G gp19 also identified numbers of phage prohead proteases, the best match (3.0E–16) being to Pfam PF04586.17 (Supplemental Figure S7). Pfam PF04586.17 represents the MEROPS family S78 of Caudoviral prohead serine proteases for which HK97 gp4 is the type peptidase [47,45]. HK97 gp4 has an important role in head maturation, cleaving the 102-residue delta domain from the N-terminus of the major capsid protein gp5 [28,45–47]. Although the match between gp19 and Pfam PF04586.17 is highly diverged (13 % identity), gp19 conserves the residues (H-129 and S-180) known to be essential for catalysis in HK97 gp4. These residues are conserved in all known phage prohead proteases that are serine proteases [48,49], including phage E3 gp77 and phage 0305phi8–36 gp123.
Determination that the phage G host is a Lysinibacillus species.
Since the first publications on phage G [1], its host has been referred to as Bacillus megaterium (also sometimes Bacillus megatherium). During the current study, we made several observations that were not in agreement with the phage G host (PGH) being B. megaterium. We note that the taxonomic assignment of PGH was originally made decades before the development of molecular methods for bacterial identification. Initially, during TEM analyses of phage G adsorbed to its host (Supplemental Figure S8) we observed that the bacterial cell diameter (~1 μm, similar to that of E. coli) was not as large as expected for B. megaterium - one of the largest known bacteria with a cell volume ~100x that of E. coli [53].
In agreement with the TEM data, 14 Lysinibacillus sphaericus strain C3–41 [52] proteins were identified in our phage G samples (Table 4), but no B. megaterium proteins. The detection of bacterial proteins that co-purified in the phage preparation was possible because the mass spectrometry searches were conducted against a database of phage G proteins (in this instance all of the phage G proteins annotated in GenBank accession JN638751.1) concatenated to the 2012 Swiss-Prot database (2012_11_170320; version 51.6) which included B. megaterium and L. sphaericus sequences for homologous proteins.
Table 4:
Bacterial host proteins identified by mass spectrometry in phage G samples
| Protein name | Organism | Accession number1 | MW (kDa) | Exclusive peptides | Total mass spectra | Sequence coverage (%) |
|---|---|---|---|---|---|---|
| ATP synthase subunit beta, atpD | L. sphaericus (strain C3–41) | sp|B1HM56|ATPB_LYSSC | 51.3 | 17 | 80 | 53 |
| Elongation factor Tu, tuf | L. sphaericus (strain C3–41) | sp|B1HMZ0|EFTU_LYSSC | 43.3 | 11 | 17 | 35 |
| ATP synthase gamma chain, atpG | L. sphaericus (strain C3–41) | sp|B1HM55|ATPG_LYSSC | 31.4 | 6 | 14 | 29 |
| Ribonuclease Y, my | L. sphaericus (strain C3–41) | sp|B1HR37|RNY_LYSSC | 58.5 | 5 | 8 | 13 |
| ATP synthase subunit b, atpF | L. sphaericus (strain C3–41) | sp|B1HM52|ATPF_LYSSC | 19.1 | 5 | 7 | 25 |
| ATP synthase subunit delta, atpH | L. sphaericus (strain C3–41) | sp|B1HM53|ATPD_LYSSC | 19.4 | 3 | 5 | 22 |
| 60 kDa chaperonin, groL | L. sphaericus (strain C3–41) | sp|B1HT15|CH60_LYSSC | 57.3 | 4 | 4 | 11 |
| ATP synthase subunit alpha, atpA | L. sphaericus (strain C3–41) | sp|B1HM54|ATPA_LYSSC | 54.7 | 2 | 3 | 6 |
| Glutamate--tRNA ligase, gltX | L. sphaericus (strain C3–41) | sp|B1HNM5|SYE_LYSSC | 55.3 | 2 | 3 | 5 |
| Serine hydroxymethyltransferase | L. sphaericus (strain C3–41) | sp|B1HM45|GLYA_LYSSC | 44.8 | 2 | 3 | 5 |
| D-alanine aminotransferase, dat | L. sphaericus (strain C3–41) | sp|P54693|DAAA_LYSSH | 31.5 | 2 | 2 | 9 |
| Meso-diaminopimelate D-dehydrogenase, dapdh | L. sphaericus (strain C3–41) | sp|Q9KWR0|DAPDH_LYSSH | 35.6 | 2 | 2 | 6 |
| Phenylalanine--tRNA ligase alpha subunit, pheS | L. sphaericus (strain C3–41) | sp|B1HWA2|SYFA_LYSSC | 38.4 | 2 | 2 | 6 |
| Probable malate:quinone oxidoreductase, mqo | L. sphaericus (strain C3–41) | sp|B1HNU2|MQO_LYSSC | 54.3 | 2 | 2 | 5 |
Accession number based on NCBI deposited genome for txid444177 for L. sphaericus (strain C3–41)
After evaluating the mass spectrometry results, we sequenced the genome of PGH using Illumina technology (2X300 paired end reads) yielding 2,129,816 reads, 99.80 % of which were determined to match the Lysinibacillus (strain W446) 12871 Branch (Taxon ID 400634) by Cosmid Blastn analyses using a library of 32,282 unique prokaryotic genomes. This finding, combined with our mass spectrometric identification of Lysinibacillus proteins in the phage G sample, strongly support that PGH is a species of Lysinibacillus, not B. megaterium. Current efforts are focused on refining the sequences assembly/annotation of PGH to permit future database searching of the MS data.
To further investigate the host range of phage G, we performed a spot test of phage G on three strains of L. sphaericus, two strains of B. megaterium and one strain of L. fusiformis compared to PGH. The efficiency of plating (EOP) of phage G on all the Lysinibacillus and B. megaterium strains was < 0.01 % with no individual plaques detected on any of the strains other than PGH (Table 5). These data are consistent with the PGH genome data showing PHG to be neither Bacillus megaterium nor Lysinibacillus sphaericus, but rather a novel species of Lysinibacillus. Our data also suggest phage G may not have a broad host range, but further studies are required to confirm its full lytic spectrum.
Table 5:
Sensitivity of different bacteria to phage G
| Bacteria tested | |||
|---|---|---|---|
| Name | BGSCID1 | Other identifier(s) | Phage G EOP3 (%) |
| Lysinibacillus sp.2 | - | PGH | 100 |
| Bacillus megaterium (type strain) | 7A36 | ATCC 14581 | <0.014 |
| B. megaterium | 7A1 | 899 | <0.014 |
| L. sphaericus (type strain) | 13A6 | ATCC 14577 | No lysis |
| L. sphaericus | 13A10 | ATCC 12123, NRS T111 | <0.014 |
| L. sphaericus | 13A18 | ATCC 4525, NRS 348 | <0.014 |
| L. fusiformis (type strain) | 19A1 | ATCC 7055T, NRS 350 | <0.014 |
Bacillus Genetic Stock Center Identification Number
Assigned in this study
EOP, efficiency of plating
Lysis, including turbid lysis, was observed in several spots containing high numbers of particles (107 and 106 pfu), which we attribute to lysis from without as no single plaques were observed
DISCUSSION
Phage G capsid components and organization resemble those of other dsDNA tailed phages.
As shown by our capsid reconstruction, phage G’s overall capsid structure is consistent with what has been reported for other commonly studied phages. Phage G’s overall capsid shell protein organization most resembles those of coliphage Lambda and marine Siphovirus TW1, despite dramatic differences in capsid and genome size. Both Lambda and TW1 capsids are much smaller than phage G in capsid shell diameter (~60 nm and ~68 nm in diameter, respectively) and have considerably shorter genomes (48.5 kbp and 40 kbp, respectively), while phage G’s capsid is 160 nm in diameter and has a 626 kbp packaged genome [5,12,16]. The major capsid proteins of all three phages (1) have the canonical HK97 gp5-like MCP fold and (2) are arranged with icosahedral symmetry with hexamer-pentamer clustering, and (3) have a decoration protein that sits on top of the major capsid icosahedron at 3-fold axes. Moreover, the decoration proteins for all three phages have a common architecture — a mostly beta-strand rich core that oligomerizes into trimers and an N-terminal extension that interacts with the E-loop MCP hexamers [12,16]. However, the length of the decoration protein in these three phages differs, with phage G’s decoration protein being the longest, being 17 residues longer than TW1’s gp56 and 55 amino acids longer than Lambda’s gpD [12,16].
These findings suggest that G capsid assembly occurs by mechanisms similar to those of smaller phages. In agreement with what has been observed in other phages, the G decoration protein makes multiple contacts with the major capsid protein, providing evidence that one function of this decoration protein is to keep the overall capsid structure stable [30]. Phage G’s decoration protein is significantly longer than TW1’s and Lambda’s decoration proteins which might increase stabilization. Nonetheless, the basic strategy appears the same for G, TW1, and Lambda. [12,16].
Phage G DNA packaging.
In contrast, we have observed two novel features of phage G DNA packaging: (1) compacted, smaller-than-capsid DNA densities with some toroid-like views and (2) lack of concentric DNA rings in the symmetric 3D reconstruction. In contrast, all previously reported phage virion 3D structures had concentric rings of encapsulated dsDNA genome [18–21,31]. This is true not only for well-studied phages, such as T3, T4, T7, P22, but also for jumbo phages, such as PhiKZ, N3, PBS1, 121Q, and ϕRSL1 [5,34]. The rings are also observed in T3 capsids with subgenomic DNA content of less than 58 % [53]. Thus, the low packaging density of G DNA is not the cause of absence of the rings. Of note, in previous studies, the DNA-full capsid symmetric reconstruction of phage G also did not show any obvious concentric rings, although this was not discussed [5].
In our phage G cryo-EM micrographs, the envelope of packaged DNA was smaller than the capsid shell and variable in size, ranging from ~42 nm to a capsid-filling ~150 nm. At all stages of the partial packaging of other studied phages, the DNA extends to the inner surface of the capsid shell. The gap observed here, between the DNA density and the capsid shell, would not be expected. [19,53]. In addition, in the case of phage T3, the number of concentric DNA rings increase with increasing amounts of packaged DNA [53].
These unique observations raise questions about how phage G’s DNA packaging mechanisms differ from mechanisms of other well-studied phages. We hypothesize that the large G capsid size and the stiffness of dsDNA, together are responsible for these observations. As dsDNA has persistence length around ~50 nm [55], the packaged dsDNA genome of the smaller phages is biased against condensing until it contacts either the capsid’s shell or an already condensed DNA segment, as it seems for phage T3 [19,53]. The result is DNA close packing that manifests as concentric rings in the 3D reconstructions, with the rings appearing first just underneath the shell and progressively increasing towards the center as more dsDNA is packaged [53]. In contrast, phage G’s capsid is roughly 3X larger than a persistence length. Thus, the packaged dsDNA is less constrained to pack against the inner surface of the capsid shell. The reduced constraint on the packaged DNA results in various DNA conformations that do not produce the appearance of concentric rings in the 3D reconstruction. These conformations might include toroids.
The possibility of DNA packaging-generated DNA toroids within the phage G capsid is supported by several reports of polycation-induced DNA toroids in artificial systems including DNA containing liposomes [56–59]. Furthermore, phage T5 DNA toroids inside the virion have been induced in vitro by shielding the charges on DNA with polyamines [60]. DNA toroid formation has been reported at the collar region of phi29 [61]. In Hua, et. al’s report on phage G’s genome electrophoresis, G DNA migrated slower than expected, hinting at modification of DNA charge [5]. The modified charge may make a further contribution to formation of these DNA condensates.
Phage G capsid assembly.
We note that, although we expect phage G to have a scaffold protein that is cleaved by the protease gp19 and removed from the head during head expansion, further analyses are required to identify the scaffold protein. The identification of scaffold proteins is complicated by the variability of scaffold proteins utilized by different phages. For instance, some phages have a dedicated scaffold protein (e.g., T4 gp22), whereas others do not (e.g., the delta domain of the HK97 gp5 acts as its scaffold [62]). In some phages, the scaffold is nested within the protease gene (e.g., gp123* in 0305phi8–36 [62]). Since the phage G major capsid protein, gp27, does not have the equivalent of the N-terminal delta domain of HK97 gp5, nor does protease gp19 have a nested scaffold gene, it seems likely that phage G would have a separate protein with primary function of scaffolding.
Although there are no known conserved residues found in all scaffold proteins, many tailed phage scaffold proteins have coiled-coil motifs and/or low pIs [29]. Based on having these two characteristics, there are two potential candidates for phage G scaffold/core proteins, gp11 and gp21, whose genes are located in the genome region that includes other major head proteins. However, rigorous identification requires further analyses, ideally of precursor head particles.
Phage G infects a Lysinibacillus.
We also found that the phage G host (PGH) is a Lysinibacillus. We initially questioned the historic assignment of PGH as B. megaterium because the cells in our EM images were smaller than the known size of the Bacillus megaterium cells (Supplementary Figure S8). Our doubts were confirmed when mass spectrometry analysis of phage G identified proteins from a bacterium different to B. megaterium (Table 4). Through whole genome sequencing, we determined that phage G’s host is a Lysinibacillus species, a genus not known when phage G was isolated in 1969 [1]. The findings from our proteomic and genomic analyses were additionally supported by host range tests which showed phage G to be unable to replicate in several strains of B. megaterium. The previous misclassification of the PGH bacterium was likely because phage G was first isolated and described in 1968 [1]. This was prior to the reclassification of numbers of Bacillus species into several new genera, including the genus Lysinibacillus. The subsequent establishment of the genus Lysinibacillus was based on rRNA gene sequencing, DNA-DNA hybridization, and other diagnostic characteristics, such as the presence of L-lys-D-Asp in the peptidoglycan [63]. We expect further characterization of phage G’s host will help reveal the mechanisms by which this unusual virus replicates in this bacterium.
METHODS
Phage G propagation and purification.
Preparation of phage G was done as was previously described [7]. In brief, phage G was grown in agarose overlays, concentrated by centrifugal pelleting and subjected to rate zonal centrifugation in a sucrose gradient. After recovery from the gradient, phage G was stored in 0.01 M Tris-Cl (pH 7.4), 0.01 M MgSO4, 6% polyethylene glycol MW 3350.
Phage G host genome sequencing.
Phage G’s host was sent for whole genome sequencing using Omega Bioservices (Norcross, GA, USA). Reported results identify phage G’s host is a Lysinibacillus species. A more in-depth analysis of the phage G host genome is underway (manuscript in progress).
Identification of phage G virion proteins by mass spectrometry.
Purified phage G was obtained from zonal, sucrose gradient centrifugation as described above. The extracted fractions of pure virus were boiled in SDS-PAGE loading buffer for 5 minutes and separated by 1-D SDS-PAGE in a Criterion XT MOPS 12 % SDS-PAGE reducing gel (Bio-Rad) and proteins visualized by staining with colloidal Coomassie blue. The gel lane was divided into eleven slices (Fig. 6B). After destaining, proteins in the gel slices were reduced with TCEP [tris(2-carboxyethyl) phosphine hydrochloride] and then alkylated with iodoacetamide before digestion with trypsin (Promega). HPLC-electrospray ionization-tandem mass spectrometry (HPLC-ESI-MS/MS) was accomplished on a Thermo Fisher LTQ Orbitrap Velos Pro mass spectrometer fitted with a New Objective Digital PicoView 550 NanoESI source. On-line HPLC separation of the digests was accomplished with an Eksigent/AB Sciex NanoLC-Ultra 2-D HPLC system: column, PicoFrit™ (New Objective; 75 μm i.d.) packed to 15 cm with C18 adsorbent (Vydac; 218MS 5 μm, 300 Å). Precursor ions were acquired in the Orbitrap in centroid mode at 60,000 resolution (m/z 400); data-dependent collision-induced dissociation (CID) spectra of the six most intense ions in the precursor scan were acquired at the same time in the linear trap. Mascot (v2.6.0; Matrix Science; London, UK) was used to search the mass spectrometry files for each slice against a database containing phage G protein sequences concatenated with the SwissProt database (2012_11_170320; version 51.6). The phage G fasta file was exported from NCBI GenBank Accession JN638751.1 and adjusted to include terminator (stop codon) to terminator (“TtoT”) sequences that included the upstream sequences from each predicted protein start site to ensure that the predicted start sites were valid.
Subset searching of the Mascot output by X! Tandem [64], determination of probabilities of peptide assignments and protein identifications, and cross correlation of the Mascot and X! Tandem identifications were accomplished by Scaffold (v4.8.4; Proteome Software, Portland, Oregon), using either the files for the individual slices or the “MudPIT” option to combine the results from all slices in the lane. Quality filters in Scaffold resulting in an FDR of 0 % at the protein level were: peptide, 95 %; protein, 99.0 %; minimum number of peptides, 2. The tandem mass spectra for each protein identified with only a single peptide were visually inspected to verify mass accuracy of <5 ppm and detection of the majority of sequence informative fragments.
Testing of different bacteria for growth of phage G.
Two strains of Bacillus megaterium (7A36 and 7A1), three strains of Lysinibacillus sphaericus (13A6, 13A10 and 13A18) and one strain of L. fusiformis (19A1) were acquired from the Bacillus Genetic Stock Center (BGSC, http://www.bgsc.org/). The strains and PGH were propagated in sterile Luria Bertani broth supplemented with 2 % nutrient broth (LB+N), 2 mM CaCl2 and 2 mM MgCl2 at 34 – 35 °C. Overnight cultures (100 μL) were inoculated into 4 ml of molten overlay containing 0.34 % agar and poured over hard agar bottom plates. A 10-fold dilution series of a phage G stock (1.1*1010 pfu/ml) was spotted onto each overlay, incubated overnight at 28 dC and examined the next morning for evidence of phage G growth.
Phage G cryo-EM data collection and image processing.
Three microliters of phage G sample was deposited on a 400 mesh Ted Pella ultrathin lacey carbon grid and incubated for 30 minutes in a humid chamber on ice. The grid was then washed with 10 microliters of 0.2 TM buffer (0.01 M Tris-Cl (pH 7.4), 0.01 M MgSO4, 6% polyethylene glycol MW 3350). Using a Gatan CP3 plunger, the grid was then blotted for 9 seconds with Whatman 1 filter paper at 65% humidity, then plunge-frozen in liquid ethane. The plunge-frozen, phage G grid was then imaged using a Titan Krios equipped with a Gatan K2 Summit direct electron detector in super-resolution mode at the Purdue Cryo-EM Facility with a nominal magnification of 8,700X resulting in 1.742 Å/super-resolution pixel. A total of 375 movies was collected.
The movies were motion corrected using motioncorr [65]. The particles were manually selected using EMAN2 e2boxer.py program [66], extracted with batchboxer.py in jspr [23]. Full capsid particles were sampled in a 12802 box without down sampling, while the empty capsid particles were down-sampled to 2.90 Å/pixel by FFT cropping to 7682 image size for further image processing. Subsequent CTF estimation de novo initial model, and icosahedral refinement/reconstruction were done using jspr [23]. The density maps of the full and empty capsid structures are available from the Electron Microscopy Database (EMDB) under accession number EMD-21695 and EMD-21702, respectively.
Modeling and refinement of phage G capsid proteins to cryo-EM density.
Sequence information for gp27 [24] was input into Robetta for 3D structure prediction [25]. Results indicated that gp27 adopted the canonical HK97 gp5-like fold [10,29,45–47]. Based on the locations and shape of gp26, we noticed the similarity to TW1’s decoration protein [12]. Using TW1’s gp56 as a template, we generated an atomic model of gp26 used in subsequent docking and refinement steps. The first 15 flexible N-terminus amino acids of gp26 were omitted to facilitate refinement.
The gp26 and gp27 models were fit into the phage G virion density map using the collage program in Situs [67]. The top scoring docked models were saved individually. The cross-correlation coefficient was calculated for each set of docked models and their respective map segments. By varying the cross-correlation cutoff values, we were able to efficiently select the best docked model for each subunit. From this docking, the full gp27 hexamers, and partially modeled gp26 trimers of the phage G capsid were modeled in the density.
Further refinement of the gp26 and gp27 fully atomistic models to the density map was done using MDFF [26]. To select an appropriate density matching weight relative to the stereochemical energy for refinement, fitting was first performed using the even half-map densities [68]. An icosahedral facet density of the capsid was extracted from the model and used for refinement with even half-map reconstruction using weights of 0.1, 0.3, 0.5, and 0.7 over a 1 ns minimization and 1 ns MDFF simulation as a method to balance density and model energy during refinement as previously described [68]. The final frame of the resulting trajectory was used to calculate a cross-correlation against the odd half-map reconstruction. The weight value which resulted in the highest cross-correlation was then found to be 0.5 and was taken to be the optimal scale factor of those tested. This scale factor was then used for final MDFF fitting to the full reconstructed density. The gp27 and gp26 atomic models are available from the Protein Data Bank (PDB) under the accession ID 6WKK.
Cryo-electron tomography.
Samples for tomography were the same used for single particle cryo-EM data collection. Thirty-two tilt series were collected using SerialEM [70] software with a tilt range of −60° to 60° in 2°increments and a nominal magnification of 8,700X on a Titan Krios with a Gatan K2 Summit direct electron detector at the Purdue Cryo-EM Facility. Tilt series were collected using a total dose of 60 e-/Å2 and a cosine distribution scheme of exposure dose. The images were binned for image processing at 1.3 nm/pixel sampling. The raw tilts were aligned using IMOD [71] and reconstructed using the methods described in depth from Yan, et. al using MBIR [72]. From these tilt series, a total of 76 particles were observed. All particles were visually evaluated and one partially full particle was identified and shown in Supplementary Figure S6.
Negative stain analysis of host-phage G interactions.
Phage G host bacteria was grown to mid-log phase in TB media [7]. Cells were infected at a MOI of 1 and lysis was monitored by OD600 nm. The infected cells were then spun down at 5,000g for 10 minutes and washed twice in PBS buffer, pH 7.0, and resuspended to a final OD600 = 1.0. The infected cells were then deposited onto lacey carbon grids coated with graphene oxide and stained with Phosphotungstic acetate solution for negative stain screening. The grid was imaged on a Tecnai T20 200kV Electron Microscope using a Gatan US1000 2Kx2K CCD camera.
Supplementary Material
Supplemental Figure S1: Phage G capsid FSC curves. Phage G’s dsDNA-full and empty capsid “gold-standard” FSC curves show the structures at 6.1Å (green) and 9Å (red) resolution, respectively. The dsDNA-full capsid reconstruction was generated with 2,564 particles. The empty capsid structure was obtained from 243 particles. The empty structure FSC curve was generated from down sampled images, and, therefore, does not extend as far as the full structure FSC.
Supplemental Figure S2: Phage G empty and full surface views. Phage G’s dsDNA-empty and full capsid structures at 9Å (A) and 6.1Å (B) surface views, respectively, are shown above. The zoomed in views of hexamers and trimers at the 3-fold icosahedral axis are shown in panels C and D for the empty and full phage G capsid structures, respectively. Color keys are shown on the right side.
Supplemental Figure S3: Phage G’s T=52 icosahedral symmetry. The figure represents phage G’s T=52 dextro (h=2, k=6) icosahedral symmetry, the largest of all known phage capsids to date. The triangulation number (T-number) is represented by the following formula: T=h2+hk+k2, where h and k represented the hexamer units counted towards the nearest pentamer vertex in a straight line [69]. Select hexamers, pentamers, and trimers are displayed in color. The black arrows indicate the hexamers counted to calculate the icosahedral T-number.
Supplemental Figure S4: Partially full phage G particles gallery. In our cryo-EM micrographs, we observed particles that appeared to have DNA condensates that were seemingly detached from the capsid shell. The gallery above shows the particles that were used to quantify the apparent DNA condensate width (measured from the shortest dimension). Some of the particles in this gallery show toroid-like features. In total, 84 particles categorized as partially full are shown above. Striped edges in some of the particles are because of the micrograph edge.
Supplemental Figure S5: Ruptured phage G particles gallery. Ruptured particles in our cryo-EM micrographs of phage G showed associated DNA in a compacted state. In total, we found 36 ruptured particles with similar features pictured in the gallery above. Striped edges in some of the particles are from the edge of the micrograph.
Supplemental Figure S6: Cryo-ET tomogram of phage G with particle showing DNA density detached from the capsid shell. The image on the left is a section from a cryo-ET tomogram showing several phage G capsids reconstructed using MBIR [72]. Boxes in green and pink indicate particles that were further displayed in the X/Y/Z orthogonal views on the right. . The partially full particle highlighted in the green box shows signs of a gap between the DNA density and the capsid shell (red arrow). The DNA density in the green boxed particle appears weaker than the other full particles in the tomogram. A neighboring particle with full DNA density boxed out in pink does not show this feature. Because of the low abundance of partially full particles in our dataset (2.3%), it was difficult to find more partially full particles in our tomography.
Supplemental Figure S7: Caudoviral prohead protease is the best HHpred match to phage G gp19.
Supplemental Figure S8: TEM micrographs of phage G adsorbed to Lysinibacillus species host. A) A zoomed-out view of an infected host cell shows 3 phage G virion adhered. B) A zoomed in view of phage G attached to its host.
HIGHLIGHTS.
Cryo-EM reveals structure of phage G capsid at 6.1 Å resolution
Interactions of the phage G decoration protein trimer with the major capsid protein shell resemble those of Lambda and TW1 phages
Cryo-EM micrographs of phage G reveal condensed, smaller-than-capsid DNA densities
Mass spectrometry analysis of phage G identifies (1) all major capsid components, and (2) the prohead protease responsible for the processing of the major capsid protein, gp27
Phage G structural studies led to proteomic and genomic analyses that revised the identity of the phage G host from Bacillus megaterium to a Lysinibacillus species
ACKNOWLEDGEMENTS
This work was supported in part by Showalter Faculty Scholar grant to WJ and the NIH T32 GM132024 Molecular Biophysics Training Program at Purdue (https://molbiophys.science.purdue.edu/) to BG. We thank the Purdue Cryo-EM Facility (https://cryoem.bio.purdue.edu/) for the use of the Titan Krios microscope. LM and DK were partly supported by the National Institutes of Health (R01GM123055), the National Science Foundation (DMS1614777, CMMI1825941, and MCB1925643) and the Purdue Institute of Drug Discovery. JAT was supported by the Thomas H. Gosnell School of Life Sciences, RIT, and the National Institute of General Medical Sciences of the National Institutes of Health under Award Number UA5GM126533. We thank Julia Faraone and Aaron Scheuch for assistance with the Phage G host sensitivity testing. We also thank the anonymous reviewers for their helpful comments. PS was supported by the San Antonio area Foundation (2018) and the Morrison Trust. Mass spectrometry analyses were conducted at the UTHSCSA Institutional Mass Spectrometry Laboratory, with expert technical assistance by Kevin Hakala, Sammy Pardo and Dana Molleur. The Orbitrap mass spectrometer was purchased with funds from NIH grant 1S10RR025111-01 (STW).
Footnotes
Publisher's Disclaimer: This is a PDF file of an unedited manuscript that has been accepted for publication. As a service to our customers we are providing this early version of the manuscript. The manuscript will undergo copyediting, typesetting, and review of the resulting proof before it is published in its final form. Please note that during the production process errors may be discovered which could affect the content, and all legal disclaimers that apply to the journal pertain.
REFERENCES
- [1].Donelli G, Isolation of a bacteriophage of exceptional dimensions active in B megatherium, Atti Della Academia Nazionalez Dei Lincei Rendiconti-Classe Di Scienze, Fisichie, Matematiche, & Naturali. 44 (1968) 95. [Google Scholar]
- [2].Donelli G, Griso G, Paoletti L, Rebessi S, Capsomeric Arrangement in the Bacteriophage G Head, in: Sixth Eur. Reg. Conf. Electron Microsc.(Jerusalem), 1976: pp. 502–503. [Google Scholar]
- [3].Donelli G, Dore E, Frontali C, Grandolfo ME, Structure and physico-chemical properties of bacteriophage G: III. A homogeneous DNA of molecular weight 5 × 10⁸, J. Mol. Biol 94 (1975) 555–565. [DOI] [PubMed] [Google Scholar]
- [4].Ageno M, Donelli G, Guglielmi F, Structure and physico-chemical properties of bacteriophage G. II, The shape and symmetry of the capsid, Micron. 4 (1973) 376–403. [Google Scholar]
- [5].Hua J, Huet A, Lopez CA, Toropova K, Pope WH, Duda RL, Hendrix RW, Conway JF, Capsids and Genomes of Jumbo-Sized Bacteriophages Reveal the Evolutionary Reach of the HK97 Fold, MBio. 8 (2017). 10.1128/mBio.01579-17. [DOI] [PMC free article] [PubMed] [Google Scholar]
- [6].Al-Shayeb B, Sachdeva R, Chen LX, Ward F, Munk P, Devoto A, Castelle CJ, Olm MR, Bouma-Gregson K, Amano Y, and He C, 2020. Clades of huge phages from across Earth’s ecosystems. Nature, 578(7795), pp.425–431. [DOI] [PMC free article] [PubMed] [Google Scholar]
- [7].Sun M, Serwer P, The Conformation of DNA Packaged in Bacteriophage G, Biophys. J 72 (1997) 958–963. [DOI] [PMC free article] [PubMed] [Google Scholar]
- [8].Suhanovsky MM, Teschke CM, erutaN’s favorite building block: Deciphering folding and capsid assembly of proteins with the HK97-fold, Virology. 479–480 (2015) 487–497. 10.1016/j.virol.2015.02.055. [DOI] [PMC free article] [PubMed] [Google Scholar]
- [9].Wikoff WR, Topologically Linked Protein Rings in the Bacteriophage HK97 Capsid, Science. 289 (2000) 2129–2133. 10.1126/science.289.5487.2129. [DOI] [PubMed] [Google Scholar]
- [10].Rader AJ, Vlad DH, Bahar I, Maturation dynamics of bacteriophage HK97 capsid, Structure. 13 (2005) 413–421. [DOI] [PubMed] [Google Scholar]
- [11].Newcomer RL, Schrad JR, Gilcrease EB, Casjens SR, Feig M, Teschke CM, Alexandrescu AT, Parent KN, The phage L capsid decoration protein has a novel OB-fold and an unusual capsid binding strategy, Elife. 8 (2019). 10.7554/eLife.45345. [DOI] [PMC free article] [PubMed] [Google Scholar]
- [12].Wang Z, Hardies SC, Fokine A, Klose T, Jiang W, Cho BC, Rossmann MG, Structure of the Marine Siphovirus TW1: Evolution of Capsid-Stabilizing Proteins and Tail Spikes, Structure. 26 (2018) 238–248.e3. [DOI] [PubMed] [Google Scholar]
- [13].Sathaliyawala T, Islam MZ, Li Q, Fokine A, Rossmann MG, Rao VB, Functional analysis of the highly antigenic outer capsid protein, Hoc, a virus decoration protein from T4-like bacteriophages, Mol. Microbiol 77 (2010) 444–455. [DOI] [PMC free article] [PubMed] [Google Scholar]
- [14].al Stone NP E, A Hyperthermophilic Phage Decoration Protein Suggests Common Evolutionary Origin with Herpesvirus Triplex Proteins and an Anti-CRISPR Protein. - PubMed - NCBI, (n.d.). https://www.ncbi.nlm.nih.gov/pubmed/29779790 (accessed March 14, 2019). [DOI] [PMC free article] [PubMed]
- [15].Sae-Ueng U, Liu T, Catalano CE, Huffman JB, Homa FL, Evilevitch A, Major capsid reinforcement by a minor protein in herpesviruses and phage, Nucleic Acids Res. 42 (2014) 9096–9107. [DOI] [PMC free article] [PubMed] [Google Scholar]
- [16].Lander GC, Evilevitch A, Jeembaeva M, Potter CS, Carragher B, Johnson JE, Bacteriophage lambda stabilization by auxiliary protein gpD: timing, location, and mechanism of attachment determined by cryo-EM, Structure. 16 (2008) 1399–1406. [DOI] [PMC free article] [PubMed] [Google Scholar]
- [17].Serwer P, Hayes SJ, Watson RH, Conformation of DNA packaged in bacteriophage T7, Journal of Molecular Biology. 223 (1992) 999–1011. 10.1016/0022-2836(92)90258-l. [DOI] [PubMed] [Google Scholar]
- [18].Lander GC, Johnson JE, Rau DC, Potter CS, Carragher B, Evilevitch A, DNA bending-induced phase transition of encapsidated genome in phage λ, Nucleic Acids Res. 41 (2013) 4518–4524. [DOI] [PMC free article] [PubMed] [Google Scholar]
- [19].Serwer P, Wright ET, Liu Z, Jiang W, Length quantization of DNA partially expelled from heads of a bacteriophage T3 mutant, Virology. 456–457 (2014) 157–170. [DOI] [PMC free article] [PubMed] [Google Scholar]
- [20].Jiang W, Chang J, Jakana J, Weigele P, King J, Chiu W, Structure of epsilon15 bacteriophage reveals genome organization and DNA packaging/injection apparatus, Nature. 439 (2006) 612–616. [DOI] [PMC free article] [PubMed] [Google Scholar]
- [21].Chang J, Weigele P, King J, Chiu W, Jiang W, Cryo-EM asymmetric reconstruction of bacteriophage P22 reveals organization of its DNA packaging and infecting machinery, Structure. 14 (2006) 1073–1082. [DOI] [PubMed] [Google Scholar]
- [22].Cheng Y, Single-particle cryo-EM—How did it get here and where will it go, Science. 361 (2018) 876–880. [DOI] [PMC free article] [PubMed] [Google Scholar]
- [23].Guo F, Jiang W, Single Particle Cryo-electron Microscopy and 3-D Reconstruction of Viruses, in: Electron Microscopy, Humana Press, Totowa, NJ, 2014: pp. 401–443. [DOI] [PMC free article] [PubMed] [Google Scholar]
- [24].Bacillus phage G, complete genome - Nucleotide - NCBI, (n.d.). https://www.ncbi.nlm.nih.gov/nuccore/JN638751 (accessed December 14, 2018).
- [25].Kim DE, Chivian D, Baker D, Protein structure prediction and analysis using the Robetta server, Nucleic Acids Res. 32 (2004) W526–31. [DOI] [PMC free article] [PubMed] [Google Scholar]
- [26].McGreevy R, Teo I, Singharoy A, Schulten K, Advances in the molecular dynamics flexible fitting method for cryo-EM modeling, Methods. 100 (2016) 50–60. [DOI] [PMC free article] [PubMed] [Google Scholar]
- [27].Protein BLAST: Align two or more sequences using BLAST, (n.d.). https://blast.ncbi.nlm.nih.gov/Blast.cgi?CMD=Web&PAGE_TYPE=BlastSearch&VIEW_SEARCH=on&UNIQ_SEARCH_NAME=A_SearchOptions_1iehQp_2Kg2_dvhUE3KC56H_23to07_qnPyY (accessed December 10, 2019).
- [28].Conway JF, Duda RL, Cheng N, Hendrix RW, Steven AC, Proteolytic and conformational control of virus capsid maturation: the bacteriophage HK97 system, J. Mol. Biol 253 (1995) 86–99. [DOI] [PubMed] [Google Scholar]
- [29].Oh B, Moyer CL, Hendrix RW, Duda RL, The delta domain of the HK97 major capsid protein is essential for assembly, Virology. 456–457 (2014) 171–178. [DOI] [PMC free article] [PubMed] [Google Scholar]
- [30].Prevelige PE Jr, Send for reinforcements! Conserved binding of capsid decoration proteins, Structure. 16 (2008) 1292–1293. [DOI] [PubMed] [Google Scholar]
- [31].Cerritelli ME, Cheng N, Rosenberg AH, McPherson CE, Booy FP, Steven AC, Encapsidated conformation of bacteriophage T7 DNA, Cell. 91 (1997) 271–280. [DOI] [PubMed] [Google Scholar]
- [32].Chen D-H, Baker ML, Hryc CF, DiMaio F, Jakana J, Wu W, Dougherty M, Haase-Pettingell C, Schmid MF, Jiang W, Baker D, King JA, Chiu W, Structural basis for scaffolding-mediated assembly and maturation of a dsDNA virus, Proc. Natl. Acad. Sci. U. S. A 108 (2011) 1355–1360. [DOI] [PMC free article] [PubMed] [Google Scholar]
- [33].Thomas JA, Rolando MR, Carroll CA, Shen PS, Belnap DM, Weintraub ST, Serwer P, Hardies SC. Characterization of Pseudomonas chlororaphis myovirus 201phi2–1 via genomic sequencing, mass spectrometry, and electron microscopy. - PubMed - NCBI, (n.d.). https://www.ncbi.nlm.nih.gov/pubmed/18474389 (accessed December 19, 2018). [DOI] [PMC free article] [PubMed]
- [34].Effantin G, Hamasaki R, Kawasaki T, Bacia M, Moriscot C, Weissenhorn W, Yamada T, Schoehn G, Cryo-electron microscopy three-dimensional structure of the jumbo phage ΦRSL1 infecting the phytopathogen Ralstonia solanacearum, Structure. 21 (2013) 298–305. [DOI] [PubMed] [Google Scholar]
- [35].Abbasifar R, Griffiths MW, Sabour PM, Ackermann H-W, Vandersteegen K, Lavigne R, Noben J-P, Alanis Villa A, Abbasifar A, Nash JHE, Kropinski AM, Supersize me: Cronobacter sakazakii phage GAP32, Virology. 460–461 (2014) 138–146. [DOI] [PubMed] [Google Scholar]
- [36].Fokine A, Kostyuchenko VA, Efimov AV, Kurochkina LP, Sykilinda NN, Robben J, Volckaert G, Hoenger A, Chipman PR, Battisti AJ, Rossmann MG, Mesyanzhinov VV, A Three-dimensional Cryo-electron Microscopy Structure of the Bacteriophage ϕKZ Head, J. Mol. Biol 352 (2005) 117–124. [DOI] [PubMed] [Google Scholar]
- [37].Lecoutere E, Ceyssens P-J, Miroshnikov KA, Mesyanzhinov VV, Krylov VN, Noben J-P, Robben J, Hertveldt K, Volckaert G, Lavigne R, Identification and comparative analysis of the structural proteomes of ϕKZ and EL, two giantPseudomonas aeruginosabacteriophages, Proteomics. 9 (2009) 3215–3219. [DOI] [PubMed] [Google Scholar]
- [38].Thomas JA, B Quintana AD, Bosch MA, De Peña AC, Aguilera E, Coulibaly A, Wu W, Osier MV, Hudson AO, Weintraub ST, and Black LW, 2016. Identification of essential genes in the Salmonella phage SPN3US reveals novel insights into giant phage head structure and assembly. Journal of virology, 90(22), pp.10284–10298. [DOI] [PMC free article] [PubMed] [Google Scholar]
- [39].Stevens RH, Zhang H, Hsiao C, Kachlany S, Tinoco EMB, DePew J, Fouts DE, Structural proteins of Enterococcus faecalis bacteriophage φEf11, Bacteriophage. 6 (2016) e1251381. [DOI] [PMC free article] [PubMed] [Google Scholar]
- [40].Mahony J, Alqarni M, Stockdale S, Spinelli S, Feyereisen M, Cambillau C and Van Sinderen D, 2016. Functional and structural dissection of the tape measure protein of lactococcal phage TP901–1. Scientific reports, 6(1), pp.1–10. [DOI] [PMC free article] [PubMed] [Google Scholar]
- [41].Casjens SR, 2011. The DNA-packaging nanomotor of tailed bacteriophages. Nature Reviews Microbiology, 9(9), pp.647–657. [DOI] [PubMed] [Google Scholar]
- [42].Thomas JA, Weintraub ST, Hakala K, Serwer P, Hardies SC, Proteome of the large Pseudomonas myovirus 201 phi 2–1: delineation of proteolytically processed virion proteins, Mol. Cell. Proteomics 9 (2010) 940–951. [DOI] [PMC free article] [PubMed] [Google Scholar]
- [43].Zimmermann L, Stephens A, Nam S-Z, Rau D, Kübler J, Lozajic M, Gabler F, Söding J, Lupas AN, Alva V, A Completely Reimplemented MPI Bioinformatics Toolkit with a New HHpred Server at its Core, J. Mol. Biol 430 (2018) 2237–2243. [DOI] [PubMed] [Google Scholar]
- [44].Rawlings ND, Barrett AJ, Thomas PD, Huang X, Bateman A, Finn RD, The MEROPS database of proteolytic enzymes, their substrates and inhibitors in 2017 and a comparison with peptidases in the PANTHER database, Nucleic Acids Res. 46 (2018) D624–D632. [DOI] [PMC free article] [PubMed] [Google Scholar]
- [45].Duda RL, Martincic K, Hendrix RW, Genetic basis of bacteriophage HK97 prohead assembly, J. Mol. Biol 247 (1995) 636–647. [DOI] [PubMed] [Google Scholar]
- [46].Duda RL, Oh B, Hendrix RW, Functional domains of the HK97 capsid maturation protease and the mechanisms of protein encapsidation, J. Mol. Biol 425 (2013) 2765. [DOI] [PMC free article] [PubMed] [Google Scholar]
- [47].Rader AJ, Vlad DH, Bahar I, Maturation dynamics of bacteriophage HK97 capsid, Structure. 13 (2005) 413–421. [DOI] [PubMed] [Google Scholar]
- [48].Cheng H, Shen N, Pei J, Grishin NV, Double-stranded DNA bacteriophage prohead protease is homologous to herpesvirus protease, Protein Sci. 13 (2004) 2260–2269. [DOI] [PMC free article] [PubMed] [Google Scholar]
- [49].Liu J, Mushegian A, Displacements of prohead protease genes in the late operons of double-stranded-DNA bacteriophages, J. Bacteriol 186 (2004) 4369–4375. [DOI] [PMC free article] [PubMed] [Google Scholar]
- [50].Bunk B, Schulz A, Stammen S, Münch R, Warren MJ, Jahn D, Biedendieck R, A short story about a big magic bug, Bioeng. Bugs 1 (2010) 85–91. [DOI] [PMC free article] [PubMed] [Google Scholar]
- [51].Lavigne R, Noben J-P, Hertveldt K, Ceyssens P-J, Briers Y, Dumont D, Roucourt B, Krylov VN, Mesyanzhinov VV, Robben J, Volckaert G, The structural proteome of Pseudomonas aeruginosa bacteriophage phiKMV, Microbiology. 152 (2006) 529–534. [DOI] [PubMed] [Google Scholar]
- [52].Lysinibacillus sphaericus (strain C3–41), (n.d.). https://www.uniprot.org/proteomes/UP000002164 (accessed January 18, 2019).
- [53].Fang P-A, Wright ET, Weintraub ST, Hakala K, Wu W, Serwer P, Jiang W, Visualization of bacteriophage T3 capsids with DNA incompletely packaged in vivo, J. Mol. Biol 384 (2008) 1384–1399. [DOI] [PMC free article] [PubMed] [Google Scholar]
- [54].Guo F, Liu Z, Fang PA, Zhang Q, Wright ET, Wu W, Zhang C, Vago F, Ren Y, Jakana J and Chiu W, 2014. Capsid expansion mechanism of bacteriophage T7 revealed by multistate atomic models derived from cryo-EM reconstructions. Proceedings of the National Academy of Sciences, 111(43), pp.E4606–E4614. [DOI] [PMC free article] [PubMed] [Google Scholar]
- [55].Mitchell JS, Glowacki J, Grandchamp AE, Manning RS, Maddocks JH, Sequence-Dependent Persistence Lengths of DNA, J. Chem. Theory Comput 13 (2017) 1539–1555. [DOI] [PubMed] [Google Scholar]
- [56].Shen MR, Downing KH, Balhorn R, Hud NV, Nucleation of DNA Condensation by Static Loops: Formation of DNA Toroids with Reduced Dimensions, J. Am. Chem. Soc 122 (2000) 4833–4834. [Google Scholar]
- [57].Lambert O, Letellier L, Gelbart WM, Rigaud JL, DNA delivery by phage as a strategy for encapsulating toroidal condensates of arbitrary size into liposomes, Proc. Natl. Acad. Sci. U. S. A 97 (2000) 7248–7253. [DOI] [PMC free article] [PubMed] [Google Scholar]
- [58].Manning GS, The molecular theory of polyelectrolyte solutions with applications to the electrostatic properties of polynucleotides, Q. Rev. Biophys 11 (1978) 179–246. [DOI] [PubMed] [Google Scholar]
- [59].Grønbech-Jensen N, Mashl RJ, Bruinsma RF, Gelbart WM, Counterion-Induced Attraction between Rigid Polyelectrolytes, Physical Review Letters. 78 (1997) 2477–2480. 10.1103/physrevlett.78.2477. [DOI] [Google Scholar]
- [60].Leforestier A, Siber A, Livolant F, Podgornik R, Protein-DNA interactions determine the shapes of DNA toroids condensed in virus capsids, Biophys. J 100 (2011) 2209–2216. [DOI] [PMC free article] [PubMed] [Google Scholar]
- [61].Tang J, Olson N, Jardine PJ, Grimes S, Anderson DL, Baker TS. DNA poised for release in bacteriophage ø29. Structure. 2008. June 11;16(6):935–43. [DOI] [PMC free article] [PubMed] [Google Scholar]
- [62].al Huang RK E, The Prohead-I structure of bacteriophage HK97: implications for scaffoldmediated control of particle assembly and maturation. - PubMed - NCBI, (n.d.). https://www.ncbi.nlm.nih.gov/pubmed/21276801 (accessed December 14, 2018). [DOI] [PMC free article] [PubMed]
- [63].Thomas JA, Hardies SC, Rolando M, Hayes SJ, Lieman K, Carroll CA, Weintraub ST, Serwer P, Complete Genomic Sequence and Mass Spectrometric Analysis of Highly Diverse, Atypical Bacillus thuringiensis phage 0305φ8–36, Virology. 368 (2007) 405. [DOI] [PMC free article] [PubMed] [Google Scholar]
- [64].Craig R, Beavis RC, TANDEM: matching proteins with tandem mass spectra, Bioinformatics. 20 (2004) 1466–1467. [DOI] [PubMed] [Google Scholar]
- [65].Li X, Mooney P, Zheng S, Booth CR, Braunfeld MB, Gubbens S, Agard DA, Cheng Y, Electron counting and beam-induced motion correction enable near-atomicresolution single-particle cryo-EM, Nat. Methods 10 (2013) 584–590. [DOI] [PMC free article] [PubMed] [Google Scholar]
- [66].Tang G, Peng L, Baldwin PR, Mann DS, Jiang W, Rees I, Ludtke SJ, EMAN2: an extensible image processing suite for electron microscopy, J. Struct. Biol 157 (2007) 38–46. [DOI] [PubMed] [Google Scholar]
- [67].Wriggers W, Conventions and workflows for using Situs, Acta Crystallogr. D Biol. Crystallogr 68 (2012) 344–351. [DOI] [PMC free article] [PubMed] [Google Scholar]
- [68].DiMaio F, Zhang J, Chiu W, Baker D, Cryo-em model validation using independent map reconstructions, Protein Sci. 22 (2013) 865–868. [DOI] [PMC free article] [PubMed] [Google Scholar]
- [69].Caspar DL, Klug A, Physical principles in the construction of regular viruses, Cold Spring Harb. Symp. on Quant. Bio 27 (1962) 1–24. [DOI] [PubMed] [Google Scholar]
- [70].Mastronarde DN, 2005. Automated electron microscope tomography using robust prediction of specimen movements. Journal of structural biology, 152(1), pp.36–51. [DOI] [PubMed] [Google Scholar]
- [71].Mastronarde DN and Held SR, 2017. Automated tilt series alignment and tomographic reconstruction in IMOD. Journal of structural biology, 197(2), pp.102–113. [DOI] [PMC free article] [PubMed] [Google Scholar]
- [72].Yan R, Venkatakrishnan SV, Liu J, Bouman CA and Jiang W, 2019. MBIR: a cryo-ET 3D reconstruction method that effectively minimizes missing wedge artifacts and restores missing information. Journal of structural biology, 206(2), pp.183–192. [DOI] [PMC free article] [PubMed] [Google Scholar]
Associated Data
This section collects any data citations, data availability statements, or supplementary materials included in this article.
Supplementary Materials
Supplemental Figure S1: Phage G capsid FSC curves. Phage G’s dsDNA-full and empty capsid “gold-standard” FSC curves show the structures at 6.1Å (green) and 9Å (red) resolution, respectively. The dsDNA-full capsid reconstruction was generated with 2,564 particles. The empty capsid structure was obtained from 243 particles. The empty structure FSC curve was generated from down sampled images, and, therefore, does not extend as far as the full structure FSC.
Supplemental Figure S2: Phage G empty and full surface views. Phage G’s dsDNA-empty and full capsid structures at 9Å (A) and 6.1Å (B) surface views, respectively, are shown above. The zoomed in views of hexamers and trimers at the 3-fold icosahedral axis are shown in panels C and D for the empty and full phage G capsid structures, respectively. Color keys are shown on the right side.
Supplemental Figure S3: Phage G’s T=52 icosahedral symmetry. The figure represents phage G’s T=52 dextro (h=2, k=6) icosahedral symmetry, the largest of all known phage capsids to date. The triangulation number (T-number) is represented by the following formula: T=h2+hk+k2, where h and k represented the hexamer units counted towards the nearest pentamer vertex in a straight line [69]. Select hexamers, pentamers, and trimers are displayed in color. The black arrows indicate the hexamers counted to calculate the icosahedral T-number.
Supplemental Figure S4: Partially full phage G particles gallery. In our cryo-EM micrographs, we observed particles that appeared to have DNA condensates that were seemingly detached from the capsid shell. The gallery above shows the particles that were used to quantify the apparent DNA condensate width (measured from the shortest dimension). Some of the particles in this gallery show toroid-like features. In total, 84 particles categorized as partially full are shown above. Striped edges in some of the particles are because of the micrograph edge.
Supplemental Figure S5: Ruptured phage G particles gallery. Ruptured particles in our cryo-EM micrographs of phage G showed associated DNA in a compacted state. In total, we found 36 ruptured particles with similar features pictured in the gallery above. Striped edges in some of the particles are from the edge of the micrograph.
Supplemental Figure S6: Cryo-ET tomogram of phage G with particle showing DNA density detached from the capsid shell. The image on the left is a section from a cryo-ET tomogram showing several phage G capsids reconstructed using MBIR [72]. Boxes in green and pink indicate particles that were further displayed in the X/Y/Z orthogonal views on the right. . The partially full particle highlighted in the green box shows signs of a gap between the DNA density and the capsid shell (red arrow). The DNA density in the green boxed particle appears weaker than the other full particles in the tomogram. A neighboring particle with full DNA density boxed out in pink does not show this feature. Because of the low abundance of partially full particles in our dataset (2.3%), it was difficult to find more partially full particles in our tomography.
Supplemental Figure S7: Caudoviral prohead protease is the best HHpred match to phage G gp19.
Supplemental Figure S8: TEM micrographs of phage G adsorbed to Lysinibacillus species host. A) A zoomed-out view of an infected host cell shows 3 phage G virion adhered. B) A zoomed in view of phage G attached to its host.