

Abstract
Background.
Systemic inflammation has emerged as a risk factor for cognitive decline and Alzheimer’s disease, but inflammation’s effect on distributed brain networks is unclear. We examined the relationship between peripheral inflammatory markers and subsequent functional connectivity within five large-scale cognitive networks and evaluated the modifying role of cortical amyloid and APOE ε4 status.
Methods.
Blood levels of soluble tumor necrosis factor-alpha receptor-1 and interleukin 6 were assessed in 176 participants (at baseline mean age: 65 (SD 9) years; 63% women; 85% cognitively normal, 15% mild cognitive impairment (MCI)) and were combined to derive an Inflammatory Index. Approximately six years later, participants underwent resting-state functional magnetic resonance imaging to quantify functional connectivity; a subset of 137 participants also underwent 11C Pittsburgh compound-B (PiB) PET imaging to assess cortical amyloid burden.
Results.
Using linear regression models adjusted for demographic characteristics and cardiovascular risk factors, a higher Inflammatory Index was associated with lower connectivity within the Default Mode (β=−0.013; 95% CI: −0.023, −0.003) and the Dorsal Attention Networks (β=−0.017; 95% CI: −0.028, −0.006). The strength of these associations did not vary by amyloid status (positive/negative). However, there was a significant interaction between Inflammatory Index and APOE ε4 status, whereby ε4-positive participants with a higher Inflammatory Index demonstrated lower connectivity. Inflammatory Index was unrelated to connectivity within other large-scale cognitive networks (Control, Limbic, and Salience/Ventral Attention networks).
Conclusion.
Peripheral pro-inflammatory signaling in older adults without dementia, especially among APOE ε4-positive individuals, is associated with altered connectivity within two large-scale cognitive networks.
Keywords: Alzheimer’s disease, Inflammation, Tumor necrosis factor, Interleukin 6, Functional connectivity, Resting-state functional magnetic resonance imaging, Default mode network, Dorsal attention network
1. Introduction
Multiple lines of evidence implicate the involvement of the immune system in Alzheimer’s disease (AD) pathogenesis. For example, genetic studies have identified several late onset AD risk loci in or near genes known to have a primary role in regulating components of the innate immune system (Karch and Goate, 2015). Consistent with these findings, individuals with mild cognitive impairment (MCI) and early AD have been found to have higher levels of inflammatory markers in blood and in cerebral spinal fluid (CSF) (Janelidze et al., 2018; Tarkowski et al., 2003). Additionally, heightened blood inflammatory markers measured during middle adulthood have been associated with accelerated memory decline and late-life structural abnormities in brain regions vulnerable to AD (Walker et al., 2019; Walker et al., 2017). Similarly, recent work within our cohort indicates that elevated levels of blood inflammatory cytokines among cognitively normal participants is also associated with increased risk of progression to MCI (Gross et al., 2019). These findings, which are well-grounded in experimental animal studies, support the idea that pro-inflammatory signaling occurring outside of the central nervous system (systemic inflammation) may have a mechanistic role in the development and progression of AD (Carret-Rebillat et al., 2015; Krstic et al., 2012; Walker et al., 2019).
There are a number of functionally related, yet anatomically distinct brain networks, which are known to play a role in aspects of cognition. A network of brain regions known collectively as the default mode network has been strongly implicated in episodic memory and other aspects of cognition. Abnormalities in default mode network connectivity, defined using resting state functional magnetic resonance imaging (rs-fMRI), emerge in the preclinical phase of AD (perhaps even before ß-amyloid deposition) and become more dysfunctional as disease severity increases (Chhatwal et al., 2018; Jones et al., 2017, 2016; Palmqvist et al., 2017). Experimental evidence suggests that peripheral inflammatory signaling can cause neurophysiological changes which result in abnormal neural activation and aberrant functional connectivity between brain regions (Labrenz et al., 2016). These findings raise the possibility that systemic inflammation may promote cognitive decline and the progression of AD by disrupting connectivity within large-scale functional networks, such as the default mode network, which are known to be abnormal early in the course of AD.
Although systemic inflammation has been implicated in AD pathogenesis and is associated with several AD-specific outcomes, little is known about how peripheral pro-inflammatory signaling may influence connectivity within large-scale cognitive networks in older adults at risk for AD. Several studies, which have examined younger populations have demonstrated that inflammatory signaling via cytokines and classical monocytes (CD14++/CD16−) is associated with altered connectivity in functional networks important for regulating aspects of emotion and cognition (Felger et al., 2016; Lekander et al., 2016; Nusslock et al., 2019). Aging itself has also been associated with changes in multiple large-scale cognitive networks (Chhatwal et al., 2018; Jones et al., 2011). Findings such as these highlight the possibility that inflammation may contribute to the alteration in large-scale functional brain networks known to occur in the context of aging and AD. In the current study, we examined the cross-temporal relationship between blood markers of inflammation and functional connectivity within five large-scale cognitive networks measured six years later in non-demented adults from the BIOCARD cohort with varying levels of cortical amyloid, as defined by positron emission tomography (PET) 11C Pittsburgh compound-B (PiB). We hypothesized that individuals with higher levels of circulating inflammatory markers would show abnormalities in default mode network connectivity, given the vulnerability of this network to Alzheimer’s-related brain changes (Chhatwal et al., 2018; Jones et al., 2017, 2016). Based on the documented relationship between pro-inflammatory signaling and brain amyloid, we also hypothesized that the association between pro-inflammatory signaling and reduced network connectivity would be especially strong among individuals who are amyloid-positive and APOE ε4-positive (Carret-Rebillat et al., 2015; Krstic et al., 2012; Walker et al., 2018).
2. Methods
2.1. Study Participants
The present study included 176 participants from the BIOCARD study, an ongoing longitudinal cohort study initiated in 1995 at the National Institutes of Health (NIH). At baseline, 349 cognitively normal, primarily middle-aged adults were enrolled, approximately 75% of whom had a first degree relative with dementia of Alzheimer’s type. Throughout the course of the study, clinical assessments, cognitive testing, and medical evaluations have been completed annually. All participants received an annual consensus diagnoses of either Cognitively Normal, Mild Cognitive Impairment (MCI), Impaired Not MCI, or Dementia. The consensus diagnosis procedures are detailed in the Supplementary Methods. Details pertaining to participant recruitment, clinical evaluation, and cognitive assessments have been described in detail elsewhere (Albert et al., 2014).
The BIOCARD study was stopped in 2005 and reinitiated at the John Hopkins University (JHU) School of Medicine in 2009. Annual clinical assessments, cognitive testing, and medical evaluations were re-initiated, and blood specimens were collected. The annual visits included a comprehensive neuropsychological battery (for details see Albert et al., 2014) as well as the Clinical Dementia Rating (CDR) (Morris, 1993). Inflammatory measures examined here were derived from the blood specimens collected at the first JHU visit. In 2015, the collection of magnetic resonance imaging (MRI) and cerebrospinal fluid was reinitiated, and amyloid imaging (using PiB PET) was begun. Study design and participant inclusion/exclusion criteria are provided in Figure 1. All study participants provided written and informed consent, and the study was approved by The Johns Hopkins University Institutional Review Board. The present report considers data from 176 participants on whom inflammatory markers were measured from blood collected at their first visit at JHU and MRI scans obtained approximately 6 years later. Data collection for this prospective cohort study is ongoing.
Figure 1. BIOCARD study design and timeline.

a Inflammatory biomarkers were measured primarily (83%) from blood collected in 2009 or 2010; 15% of inflammatory markers were measured from blood collected in 2011; 2% of inflammatory markers were measured at a later date.
Abbreviations: rs-fMRI, resting state functional magnetic resonance imaging; PET, positron emission tomography; PiB, 11C Pittsburgh compound-B
2.2. Biomarker Assessment
Inflammatory markers were measured from plasma collected in 2009 or 2010 for 83% of participants (n=146), in 2011 for 15% of participants (n=27), and in 2012 for 1% of participants (n=2). Inflammatory markers were measured concurrently with fMRI imaging (2016) for one additional participant. The mean duration of blood specimen storage (i.e., time between blood collection and measurement of inflammatory markers was 7.9 years (SD 0.7)). We evaluated two inflammatory markers, which were measured in duplicate, to quantify pro-inflammatory signaling: interleukin 6 (IL-6) and soluble tumor necrosis factor-alpha receptor-1 (sTNFR1). IL-6 was measured using a high-sensitivity Quantikine ELISA (Fisher Scientific, Waltham, MA). sTNFR1 is an isoform of the membrane-bound TNF-α receptor present within the blood, which is believed to propagate TNF-α signaling systemically. Compared to TNF-α, sTNFR1 is a more stable and reliable marker of TNF-α-related inflammatory signaling (Diniz et al., 2010; Wajant et al., 2003). sTNFR1 was measured using a Mesoscale chemiluminiscent singleplex assay (Varadhan et al., 2014). Protein levels were above the limits of detection for IL-6 (0.039pg/ml) and sTNFR1 (0.77pg/ml) assays. The intraassay coefficients of variation for IL-6 and sTNFR1 were 2.8% and 3.5%, respectively. Using IL-6 and sTNFR1, we created an inflammatory index, which is equal to log(IL-6) + 2log(sTNFR1). This inflammatory index, which is intended to capture pro-inflammatory signaling downstream of nuclear factor-kappa B (NF-kB) activation, has been used previously and validated in independent cohorts as a predictor of 10-year mortality in older adults (Varadhan et al., 2014). As described by Varadhan et al. (2014), IL-6 and sTNFR1 were selected from a broader panel of inflammatory proteins known to be elevated following NF-kB activation using a least absolute shrinkage and selection operator (LASSO) approach. This Inflammatory Index was developed in the Cardiovascular Health Study (CHS) and was subsequently validated in the InCHIANTI cohort. IL-6 and sTNFR1 values were log-transformed to correct for skewness.
2.3. Neuroimaging
2.3.1. Resting State fMRI
MRI scans were conducted between 2015 and 2017 on a 3T MR system (Philips Healthcare, Best, The Netherlands). Participants received instructions to not move, keep their eyes closed, and relax their mind while inside the scanner. Resting state blood-oxygenation-level-dependent (BOLD) data were collected using an echo-planar imaging (EPI) sequence with the following parameters: number of slices = 48; field of view (FOV) = 212 × 212 mm2; voxel size = 3.3 × 3.3 × 3.3 mm2; repetition time (TR) / echo time (TE) = 3000 / 30 ms; flip angle = 75°. The duration of each scan session was 420 s and comprised of 140 functional volumes. Magnetization-prepared rapid gradient echo (MPRAGE) sequences were also obtained and used for anatomical reference and image registration (TR = 6.7 ms, TE = 3.2 ms, shot interval 3000 ms, flip angle = 8°, FOV = 240 × 256 mm2, 170 slices with 1 × 1 × 1.2 mm3 voxels).
Preprocessing.
Using SPM and in-house MATLAB scripts, the BOLD data underwent standard pre-processing steps including slice timing correction, realignment, normalization to Montreal Neurologic Institute (MNI) 152 volumetric space via MPRAGE image, spatial smoothing using a Gaussian filter with a full-width half-maximum of 4mm (Hou et al., 2018; Peng et al., 2018). The BOLD image series were detrended and bandpass-filtered to 0.01 – 0.1 Hz to retain the low-frequency fluctuation components.
Motion correction.
To reduce the motion effect on functional connectivity, the preprocessed BOLD data underwent a scrubbing process in which image volumes manifesting a displacement of ≥0.5 mm relative to the prior frame were discarded (Power et al., 2012, 2014). In addition, the frames acquired immediately prior and immediately after displaced frames were also discarded to account for temporal spread of artifactual signal resulting from the temporal filtering in the low-frequency functional signal (Chan et al., 2014).
Functional connectivity (FC).
To evaluate functional connectivity across the cerebral cortex, we used a previously established functional parcellation of cerebral cortex estimated in MNI 152 volumetric space (Betzel et al., 2014; Yeo et al., 2011). The motion scrubbed preprocessed BOLD data were parcellated into 114 region-of-interests (ROIs) based on Yeo et al. (2011) and were grouped into 7 non-overlapping FC networks using an established atlas (Figure 2). Cross-correlation coefficients were calculated between all pairs of ROIs after factoring out nuisance covariates including whole brain signal, white matter signal, CSF signal, and six rigid-body head motion corrections. The correlation coefficients were then converted to z-scores using a Fisher-z transform and formed a 114 × 114 FC matrix. To quantify network-wise FC, the FC matrix was reduced from 114 × 114 to 7 × 7 by averaging values belonging to the same network. For the examination of relationships with inflammatory biomarkers, we focused on five of these networks that are the most relevant to cognitive function, including the executive control network (Control), default mode network (Default), dorsal attention network (DorsAttn), limbic network (Limbic), and combined salience and ventral attention network (SalVentAttn). Relationships between the inflammatory markers and sensory-motor networks were not considered.
Figure 2. Neuroanatomical representation of cognitive and sensory-motor resting state networks.
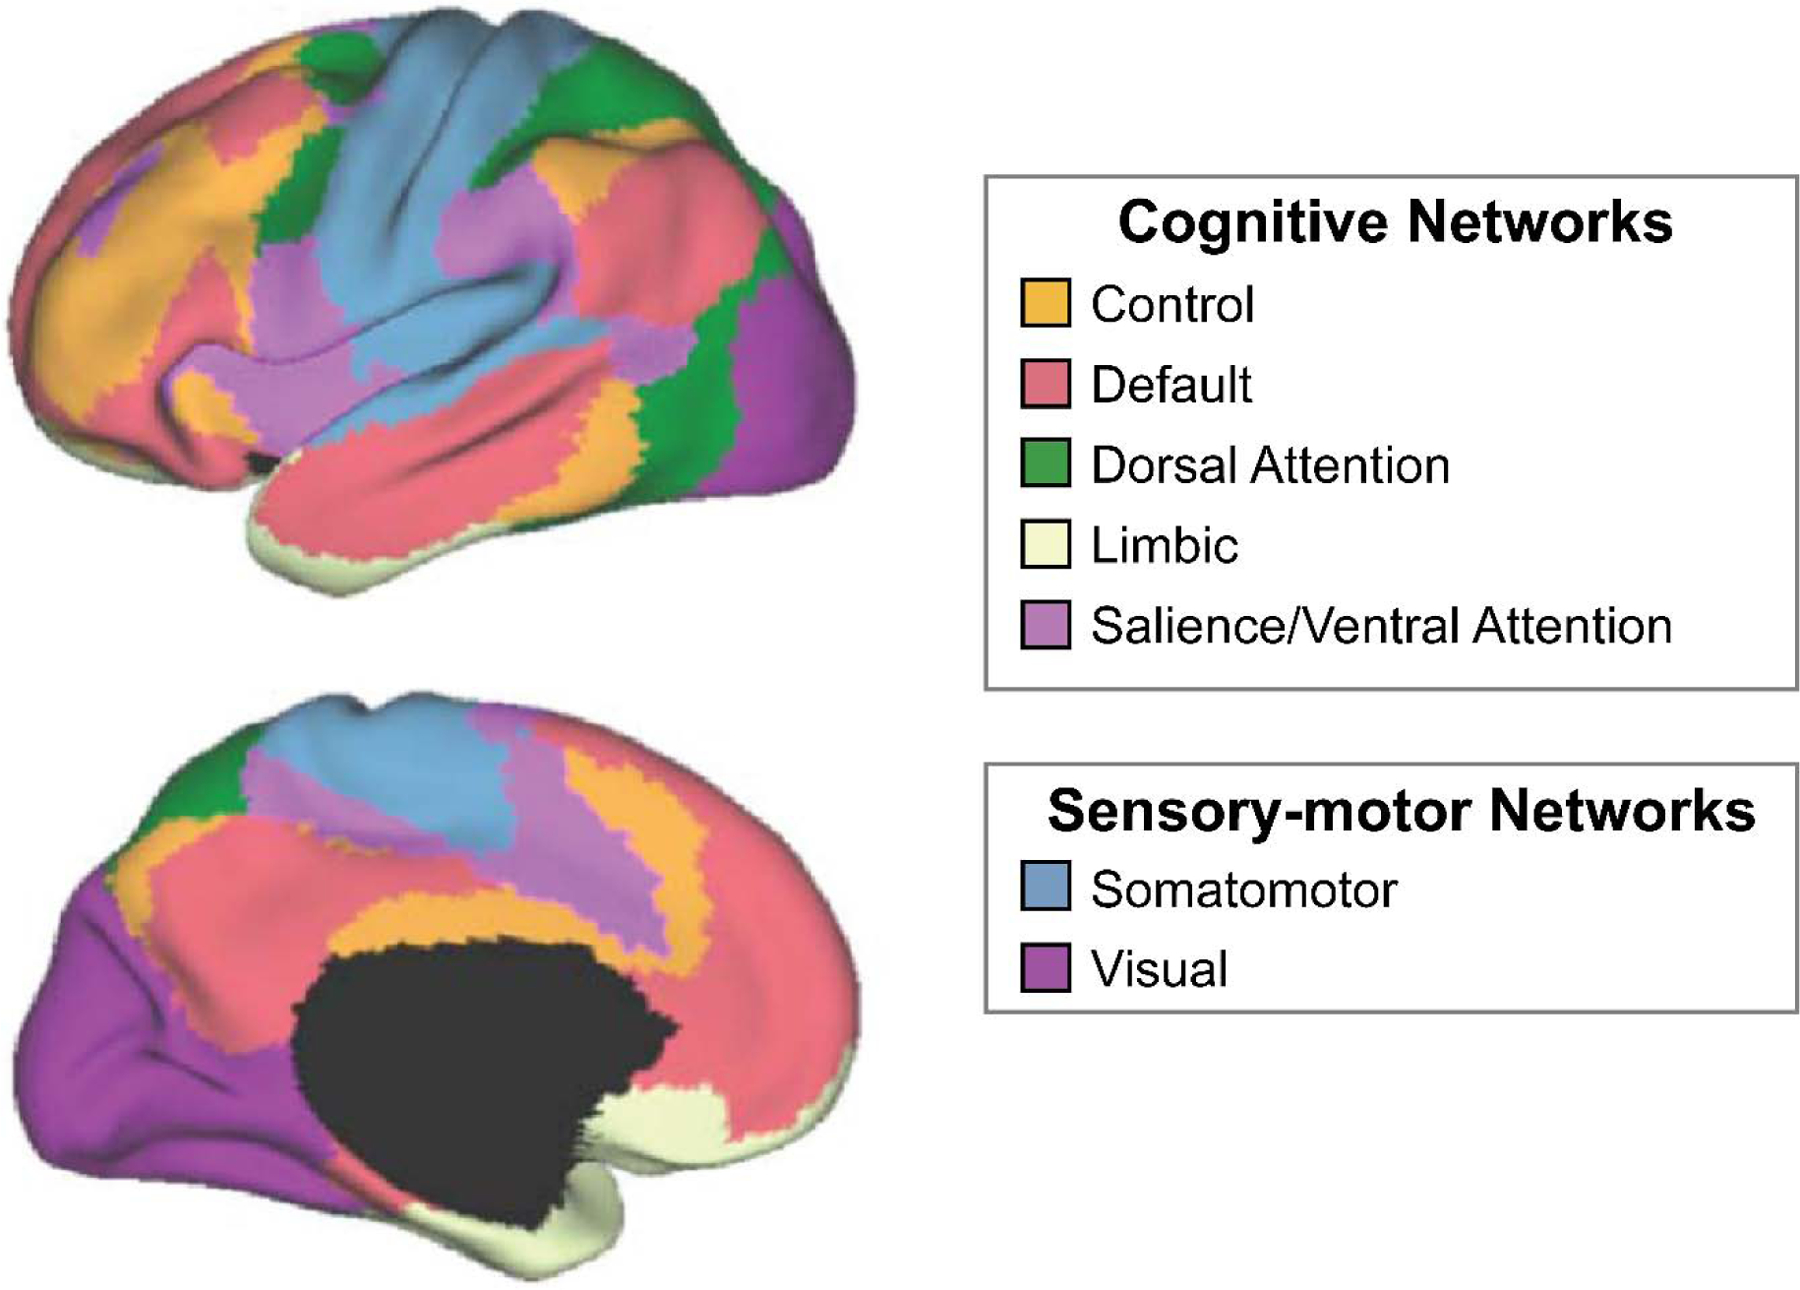
Using resting state functional magnetic resonance imaging (fMRI), we derived seven resting state networks from 114 parcellated brain regions based on methods published by Yeo et al., 2011.
2.3.2. PiB PET Imaging
A subset of 137 participants underwent PiB imaging to assess cortical amyloid burden. The mean time between PiB and MR imaging was 133 days (SD 298). We used a GE Advance scanner in three-dimensional mode to obtain dynamic 11C-PiB PET scans. Data were acquired immediately following the IV bolus injection of 11C-PiB. Anatomical regions were defined on the structural MRI of each participant using MRICloud, and these region definitions were mapped to the native space of each PET image (Mori et al., 2016). Distribution volume ratio (DVR) image was computed from the dynamic PiB-PET data using a simplified reference tissue model with cerebellar gray matter as the reference region (Zhou et al., 2003). We derived the mean cortical DVR (cDVR) by calculating the average of the following brain regions: anterior, middle and posterior cingulate regions, superior, middle and inferior frontal and orbitofrontal, superior parietal, supramarginal and angular gyrus regions, superior, middle and inferior temporal, precuneus, superior, middle and inferior occipital, excluding the sensorimotor strip. We used a threshold of 1.06 to define elevated PiB uptake based on a previous study which used a 2-class Gaussian mixture model fitted to cDVR data to derive the threshold (i.e., the cDVR value corresponding to the intersection of the probability density functions between minimal and higher than minimal levels of PiB retention) (Bilgel et al., 2016).
2.4. Covariates
We adjusted all analyses for participant demographic characteristics, including age at cytokine assessment (discretized into quartiles to accommodate potential nonlinear associations between age and outcome), sex, years of education, APOE ε4 status (0/1/2 ε4 alleles), and baseline anti-inflammatory medication use (yes/no). Analyses were also adjusted for a previously validated vascular risk composite score, calculated as the sum of five dichotomous vascular risk factors: current hypertension, hypercholesterolemia, diabetes, obesity (BMI ≥30), and smoking status (Gottesman et al., 2017). Additionally, analyses were adjusted for MRI head motion (yes/no, reflecting whether >50% of MRI frames were excluded due to motion scrubbing).
2.5. Statistical Analysis
The primary analysis used multivariable linear regressions with robust standard errors to determine the association of the Inflammatory Index with each of the five measures of network functional connectivity (dependent variable), i.e., the Control, Default, DorsAttn, Limbic, and SalVentAttn networks. Separate analyses were run with the Inflammatory Index modeled as a continuous and categorical (quartiles) independent variable. All regression analyses were adjusted for the covariates described above. For functional networks implicated in our primary analyses, we used interaction terms and stratified analyses to examine whether cortical amyloid burden (positive/negative) and APOE ε4 status (0/≥1) modified the association between inflammatory marker levels and network connectivity. For descriptive and exploratory purposes, secondary analyses examined 1) the association of the Inflammatory Index components (IL-6 and sTNFR1) with network functional connectivity, and 2) the association of the Inflammatory Index with node-to-node within-network connectivity using multivariable linear regression models. Within-network analyses were restricted to functional networks associated with the Inflammatory Index in the primary analysis.
Multiple sensitivity analyses were conducted. First, to determine whether associations between inflammation and functional connectivity occurred outside the context of clinically significant cognitive impairment, analyses were repeated after excluding participants classified as MCI at the time of inflammatory marker measurement (n=26). Additionally, analyses were repeated after excluding participants for which >50% of MRI frames were excluded due to motion scrubbing (n=18). We used a two-sided P-value <0.05 as a cutoff for statistical significance. Analyses were conducted using Stata Version 14 (StataCorp, College Station, Tex., USA).
3. Results
A total of 176 participants with available biomarker and rs-fMRI data were included in the primary analysis. Participant characteristics at the time of inflammatory marker assessment are displayed in Table 1. The average age at inflammatory biomarker assessment was 65 (SD 9). At the time inflammatory markers were assessed, 85% (n=150) of participants were classified as cognitively normal (including n=15 impaired not MCI) and 15% (n=26) had a consensus diagnosis of MCI. IL-6 and TNFR1 levels were largely within the normal physiological range. The characteristics of participants with available PiB PET are provided in Supplementary Table 1.
Table 1.
Participant characteristics at time of inflammatory marker measurement
| Characteristic | Full analytic sample (N=176) | Cognitively normal (N=150) | Mild cognitive impairment (N=26) |
|---|---|---|---|
| Demographic Variables | |||
| Age, mean (SD) [range], y | 64.6 (8.7) [28.2–86.0] | 64.3 (8.6) [28.2, 86.0] | 66.3 (9.7) [45.6–81.4] |
| Female, No. (%) | 110 (63) | 95 (63) | 15 (58) |
| White race/ethnicity, No. (%) | 169 (96) | 146 (97) | 23 (88) |
| Education, mean (SD) [range], y | 17.3 (2.3) [12–20] | 17.5 (2.1) [12–20] | 16.2 (2.9) [12–20] |
| Apolipoprotein E ε4 Alleles, No. (%) | |||
| 0 | 119 (68) | 101 (67) | 18 (69) |
| 1 | 47 (27) | 40 (27) | 7 (27) |
| 2 | 10 (6) | 9 (6) | 1 (4) |
| Clinical Variables | |||
| MMSE, mean (SD) [range] | 29.1 (1.2) [24–30] | 29.3 (1.0) [24–30] | 28.4 (1.8) [24–30] |
| Hypertension, No. (%) | 66 (38) | 53 (36) | 13 (50) |
| Hypercholesterolemia, No. (%) | 88 (50) | 74 (49) | 14 (54) |
| Diabetes, No. (%) | 13 (7) | 12 (8) | 1 (4) |
| Obesity (BMI ≥30 kg/m2), No (%) | 38 (22) | 33 (22) | 5 (19) |
| Current smoking status, No. (%) | 8 (5) | 6 (4) | 2 (8) |
| Anti-inflammatory medication use, No. (%) | 45 (26) | 40 (27) | 5 (19) |
| Biomarkers, mean (SD) [range] | |||
| Inflammatory Index | 14.0 (1.0) [11.4–17.3] | 14.0 (1.0) [11.4–17.3] | 14.5 (0.8) [13.1–16.8] |
| IL-6, pg/mL | 2.0 (2.9) [0.4–25.7] | 1.8 (2.4) [0.4–18.7] | 2.8 (4.8) [0.8–25.7] |
| sTNFR1, pg/mL | 983.2 (298.5) [433.6–2300.1] | 970.3 (296.7) [433.6–2300.1] | 1057.8 (299.8) [609.6–1769.5] |
| Time between inflammatory marker measurement and fMRI, mean (SD) [range], y | 5.5 (1.0) [0–8.2] | 5.5 (1.1) [0–8.2] | 5.6 (0.8) [4.0–7.6] |
| Time between inflammatory marker measurement and PiB PET, mean (SD) [range], y | 5.5 (1.0) [0–7.9] | 5.4 (1.0) [0–7.9] | 6.1 (1.0) [4.0–7.7] |
Abbreviations: BMI, body mass index; IL-6, interleukin 6; MMSE, Mini-Mental State Examination; No., number; SD, standard deviation; sTNFR1, soluble tumor necrosis factor-alpha receptor-1; y, years
3.1. Inflammation and Functional Brain Networks
In our primary analysis, a higher Inflammatory Index was associated with reduced connectivity within both the Default and DorsAttn networks after adjusting for covariates (Table 2). The Inflammatory Index was not associated with connectivity within the other three networks examined: the Control, Limbic, and SalVentAttn networks. Findings were similar when the Inflammatory Index was discretized into quartiles (Figure 3; non-standardized results are provided in Supplementary Figure 1). In secondary analyses which examined the Inflammatory Index component biomarkers individually, a higher IL-6 level was associated with reduced DorsAttn and Limbic network connectivity, whereas a higher sTNFR1 level was associated with reduced connectivity within the Default network (Table 2). The strength and direction of these associations remained similar when participants missing >50% of MRI frames due to motion scrubbing (n=18) were excluded (Supplementary Table 2).
Table 2.
Association between Inflammatory Index and intrinsic network connectivity
| Control Network | Default Mode Network | Dorsal Attention Network | Limbic Network | Salience/Ventral Attention Network | |
|---|---|---|---|---|---|
| Blood inflammatory markers | ß (95% CI)a N=176 | ß (95% CI)a N=176 | ß (95% CI)a N=176 | ß (95% CI)a N=176 | ß (95% CI)a N=176 |
| Inflammatory Index (IL6 and sTNFR1) | −0.004 (−0.011, 0.004) | −0.013 (−0.023, −0.003) * | −0.017 (−0.028, −0.006) ** | −0.015 (−0.037, 0.008) | −0.005 (−0.015, 0.004) |
| IL-6 | −0.002 (−0.010, 0.007) | −0.007 (−0.017, 0.003) | −0.017 (−0.026, −0.008) *** | −0.023 (−0.045, −0.001) * | −0.008 (−0.018, 0.002) |
| sTNFR1 | −0.004 (−0.011, 0.003) | −0.014 (−0.024, −0.005) ** | −0.009 (−0.022, 0.004) | 0.003 (−0.022, 0.028) | 0.000 (−0.009, 0.009) |
Analyses were adjusted for baseline age, sex, education, APOE ε4 status, anti-inflammatory medication use, MRI head motion, and vascular risk score, which includes current smoking status, hypertension, hypercholesterolemia, diabetes, and BMI.
Difference in intrinsic connectivity per each standard deviation increase in biomarker level.
Abbreviations: IL-6, interleukin 6; sTNFR1, soluble tumor necrosis factor-alpha receptor-1
P <0.05;
P <0.01;
P<0.001
Figure 3. The association between Inflammatory Index quartiles and estimated intrinsic network connectivity.

Using participants with the lowest level (1st quartile) of the Inflammatory Index as the reference group, intrinsic connectivity within each cognitive network was estimated for each Inflammatory Index quartile using fully adjusted linear regression models (N=176). Intrinsic connectivity estimates and standard errors are displayed for each functional network. Intrinsic connectivity values were standardized to facilitate comparability and interpretability. P-trend values for Inflammation Index quartiles are P=0.013 and P=0.006 for Default Mode Network and Dorsal Attention Network, respectively. *P<.05
We repeated these analyses after excluding participants with MCI at the time of inflammatory marker assessment (n=26). Among participants who were cognitively normal, a higher Inflammatory Index remained significantly associated with reduced connectivity within the Default (ß=−0.013, 95% CI: −0.024, −0.002) and DorsAttn (ß=−0.014, 95% CI: −0.025, −0.002) (Supplementary Tables 3 & 4) networks.
For descriptive purposes, we examined the association between the Inflammatory Index and within-network, node-to-node Default and DorsAttn connectivity. These results are illustrated in Supplementary Figure 2.
3.2. Effect Modification by APOE ε4 Status and Amyloid Status
We then examined the effect of APOE ε4 status and cortical amyloid burden on the association between the Inflammatory Index and connectivity within the Default and DorsAttn networks (Table 3). There was a significant interaction between Inflammatory Index and APOE ε4 status, whereby ε4-positive participants with a higher Inflammatory Index demonstrated lower Default and DorsAttn network connectivity compared to ε4-negative participants. We note, however, that the Inflammatory Index level did not differ between participants with and without an APOE ε4 allele (two-sample t test: t = −0.07; P = 0.94). Among the subset of participants (n=137) who underwent PiB PET imaging, we found no evidence for a modifying effect of amyloid status on the association of Inflammatory Index with Default and DorsAttn network connectivity; all interaction terms were nonsignificant. The associations between higher Inflammatory Index and reduced Default/DorsAttn network connectivity were essentially unchanged when analyses were restricted to amyloid-negative participants Supplementary Table 5. Inflammatory Index level did not differ between participants with positive versus negative amyloid status (two-sample t test: t = 0.91; P = 0.37).
Table 3.
Association between Inflammatory Index and intrinsic network connectivity stratified by APOE ε4 status
| Default Mode Network | |||
|---|---|---|---|
| Blood inflammatory markers | APOE ε4 Negative ß (95% CI)a N=119 | APOE ε4 Positive ß (95% CI)a N=57 | APOE ε4 Interaction P-value |
| Inflammatory Index | −0.008 (−0.019, 0.003) | −0.025 (−0.051, 0.001) | 0.032 |
| IL-6 | −0.005 (−0.015, 0.006) | −0.008 (−0.036, 0.020) | 0.596 |
| sTNFR1 | −0.008 (−0.020, 0.003) | −0.030 (−0.050, −0.010) ** | 0.007 |
| Dorsal Attention Network | |||
| Blood inflammatory markers | APOE ε4 Negative ß (95% CI)a N=119 | APOE ε4 Positive ß (95% CI)a N=57 | APOE ε4 Interaction P-value |
| Inflammatory Index | −0.011 (−0.022, 0.001) | −0.045 (−0.071, −0.019) ** | 0.008 |
| IL-6 | −0.012 (−0.022, −0.002) * | −0.030 (−0.061, 0.000) | 0.077 |
| sTNFR1 | −0.004 (−0.017, 0.010) | −0.036 (−0.063, −0.008) * | 0.074 |
Analyses were adjusted for baseline age, sex, education, anti-inflammatory medication use, MRI head motion, and vascular risk score, which includes current smoking status, hypertension, hypercholesterolemia, diabetes, and BMI.
Difference in intrinsic connectivity per each standard deviation increase in biomarker level.
Abbreviations: IL-6, interleukin 6; sTNFR1, soluble tumor necrosis factor-alpha receptor-1
P<0.05;
P<0.01
4. Discussion
The current study characterized the relationship between peripheral pro-inflammatory signaling and subsequent measures of intrinsic connectivity within five large-scale functional brain networks among cognitively normal individuals and those with MCI. An elevated level of circulating pro-inflammatory proteins was associated with reduced connectivity within the Default and DorsAttn networks 6 years later, especially among APOE ε4-positive individuals. Inflammation was associated with reduced Default and DorsAttn connectivity in the group as a whole, as well as in the subset of individuals who were cognitively normal when inflammatory markers were measured. Importantly, these associations were observed after adjusting for demographic characteristics and cardiovascular risk factors, suggesting that inflammation has an association with Default and DorsAttn connectivity that is independent of other factors which may promote network dysfunction and adverse neurocognitive outcomes. In contrast, our primary analyses found no relationship between level of circulating pro-inflammatory proteins and connectivity within the Control, Limbic, and SalVentAttn networks.
It has been hypothesized that Default network dysfunction represents an early abnormality during the development of AD that may be a marker of the spread of ß-amyloid (Buckner, 2005; Jones et al., 2016; Palmqvist et al., 2017) and accelerated hyperphosphorylation of tau (Jones et al., 2017). Abnormal DorsAttn network connectivity has also been shown to occur in AD, but current evidence suggests DorsAttn abnormalities emerge later in the disease course, in conjunction with the onset of clinical symptoms (Chhatwal et al., 2018; Li et al., 2012). The current findings, which suggest that peripheral pro-inflammatory signaling is associated with both Default and DorsAttn network dysfunction, highlight one pathway through which inflammation may promote cognitive decline and perhaps facilitate the spread of neurodegenerative pathology in older adults.
In support of the current findings, previous work has demonstrated a robust relationship between inflammation, neurophysiological changes, and altered functional connectivity. For example, experimental studies of young and middle-aged adults show that exposure to an endotoxin (a potent inflammatory stimulus) causes changes in functional connectivity and abnormalities in task-dependent BOLD signal (Eisenberger et al., 2010; Labrenz et al., 2016). While some, but not all, studies have found associations between elevated levels of circulating inflammatory markers and reduced default mode network connectivity (Dev et al., 2017; Marsland et al., 2017), other studies in younger samples have found that inflammation is associated with altered connectivity in limbic and ventral attention networks (Felger et al., 2016; Lekander et al., 2016; Nusslock et al., 2019). For example, Nusslock and colleagues recently demonstrated an association between higher circulating levels of peripheral inflammatory markers and reduced connectivity within the emotion regulation network (similar to our Limbic Network) in two independent samples of adolescent and young adult African American participants. Although we observed an association between higher IL-6 and reduced Limbic network connectivity in secondary analyses, the current study did not find evidence for an association between pro-inflammatory signaling and altered connectivity in Salience/Ventral attention regions. There are a number of potential reasons for this discrepancy, including age-related differences in immune-brain signaling (Barrientos et al., 2012), and participant racial, socioeconomic, and demographic differences that may affect immune function (our cohort is mostly white and highly educated). Discrepant findings may also be accounted for by differences in study design, as a recent meta-analysis found that the changes to the salience network occur more often in the context of experimental manipulation of inflammation (e.g., endotoxin exposure) (Kraynak et al., 2018).
Though the current study provides evidence for an association between Default and DorsAttn network connectivity and inflammation, it raises questions about the biological properties or external factors that might make these two cognitive networks especially vulnerable to the downstream effects of peripheral inflammatory signaling. One hypothesis is that inflammation may alter connectivity within these networks by promoting existing pathology, which in the case of AD, is reported to emerge early in the preclinical phase of disease along the Default network (Buckner, 2005; Jones et al., 2017; Palmqvist et al., 2017). Although we did not find support for this hypothesis with regard to cortical amyloid burden, it is possible that inflammation promotes other aspects of AD pathology, such as tau hyperphosphorylation or synaptic dysfunction, which may also emerge and progress along select large-scale functional networks (Chavan et al., 2012; Jones et al., 2017; Popp et al., 2017; Varma et al., 2017). In support of this notion, previous work has demonstrated a relationship between inflammatory markers, subsequent region-specific atrophy and FDG PET neurometabolic changes which overlap neuroanatomically with hubs of Default network connectivity (Schmidt et al., 2016; Walker et al., 2017; Warren et al., 2018). An alternative hypothesis is that inflammation may simply serve as a byproduct of, or a compensatory mechanism in response to, an AD-related pathological process which selectively influence Default and DorsAttn connectivity.
We also note that pro-inflammatory markers IL-6 and sTNFR1 were in the normal physiological range for nearly all participants. The finding that modest elevations in circulating inflammatory markers were associated with lower network connectivity is consistent with the idea that low-grade inflammation may confer risk for adverse neurocognitive outcomes in later life (Cunningham and Hennessy, 2015). Interestingly, sTNFR1 appeared to be the primary measure driving the association between the Inflammatory Index and Default connectivity, whereas the association with the DorsAttn network was driven by IL-6. Moreover, we have recently shown that sTNFR1 is associated with increased risk of progression from normal cognition to MCI, whereas this is not the case for IL-6 (Gross et al., 2019). Taken together, these results suggest that distinct pro-inflammatory cytokines may have differential effects on discrete functional brain networks and risk of progression, though future studies are needed to replicate these findings.
The current results suggest that cortical amyloid levels do not modify the relationship between inflammation and connectivity within either the Default or DorsAttn networks. Rather, these results suggest that the association between peripheral pro-inflammatory signaling and intrinsic network connectivity occurs independent of PET-defined amyloid pathology. In contrast, APOE genotype does appear to act as a moderator. Consistent with previous work which suggests that inflammation and APOE ε4 allele possession may act synergistically to promote neurodegenerative changes and increase AD risk (Tao et al., 2018), our results indicate that APOE ε4 allele possession magnifies the association between inflammation and reduced network connectivity. This association between APOE genotype and inflammation is consistent with previous findings which suggests that APOE ε4 allele possession and apolipoprotein level augment inflammatory signaling by regulating NF-kB and complement C1q activity, respectively (Ophir et al., 2005; Yin et al., 2019).
Taken together, the current study provides additional support for the role of inflammation in AD and extends previous work by demonstrating that inflammation is associated with reduced connectivity within two large-scale cognitive networks that are known to be disrupted during the course of AD. Although this study provides novel insights into the potential role of peripheral pro-inflammatory signaling in brain health, the current results should be interpreted within the context of several limitations. First, inflammatory markers were measured at only one time-point and may therefore be subject to random measurement error due to normal physiologic variability, potential occult medical illness, and other factors. Although there is evidence for stability of inflammatory proteins and receptors (especially sTNFR1) outside the context of acute illness (Dibbs et al., 1999; Hardikar et al., 2014), future studies are needed to evaluate these relationships using repeated measurement of inflammatory markers and inflammatory markers measured concurrently with neuroimaging. The current study focused on two inflammatory proteins that have been previously implicated in AD pathogenesis. However, the decision to focus our analysis on these two inflammatory markers limited the study’s ability to provide a broader understanding of how pro-inflammatory and anti-inflammatory signaling networks may relate to functional connectivity. Future analyses should include a more comprehensive measure of inflammatory mediators, including anti-inflammatory cytokines such as IL-10 and other widely used markers such as C-reactive protein.
Although the current study was powered to detect a main effect of inflammation on intrinsic network connectivity, our analyses may have been underpowered to detect an interaction by amyloid status, as PiB data were only available in a subset of the current cohort. It is also important to note that the Yeo et al. (2011) method we used to construct the FC networks relies on a parcellations of cortical structures. Thus, we are unable to determine how inflammation may relate to connectivity within subcortical structures, such as the hippocampus, and within brainstem regions that are implicated in AD and may be affected by inflammation. The absence of repeated neuroimaging also precludes our ability to determine whether inflammation is related to changes in network connectivity over time. Thus, it is possible that the reduced connectivity associated with inflammation was present at the time inflammatory proteins were measured. Lastly, as is the case with observational studies, the observed associations may be subject to residual confounding due to factors such as subclinical or unmeasured disease.
Despite these limitations, the current study provides evidence for the potential role of peripheral pro-inflammatory signaling in brain changes that lead to the disruption of multiple large-scale functional brain networks previously implicated in AD. Future work will be needed to understand the process(es) through which these changes in immune function might influence intrinsic connectivity within the Default and DorsAttn networks. In particular, exploring how peripheral pro-inflammatory signaling interacts with neuroinflammation, synaptic function, and tau pathology to affect select cognitive networks will be important as techniques improve for measuring these processes in vivo.
Supplementary Material
Highlights.
Inflammation is associated with brain functional connectivity in older adults
Inflammation linked to lower default mode and dorsal attention network connectivity
Association of inflammation with functional connectivity magnified by APOE ε4
Brain β-amyloid did not modify the inflammation-functional connectivity association
Acknowledgments
The BIOCARD Study consists of 7 Cores with the following members: (1) the Administrative Core (Marilyn Albert, Barbara Rodzon), (2) the Clinical Core (Marilyn Albert, Anja Soldan, Rebecca Gottesman, Ned Sacktor, Leonie Farrington, Maura Grega, Scott Rudow, Rostislav Brichko, Gay Rudow), (3) the Imaging Core (Michael Miller, Susumu Mori, Tilak Ratnanather, Timothy Brown, Anthony Kolasny, Kenichi Oishi, Laurent Younes), (4) the Biospecimen Core (Richard O’Brien, Abhay Moghekar, Jacqueline Darrow), (5) the Informatics Core (Roberta Scherer, David Shade, Ann Ervin, Jennifer Jones, Hamadou Coulibaly), the (6) Biostatistics Core (Mei-Cheng Wang, Jiangxia Wang, Yuxin Zhu, and (7) the Neuropathology Core (Juan Troncoso, Olga Pletnikova, Gay Rudow, Karen Fisher).
Additional Contributions: We would like to acknowledge the contributions to BIOCARD of the Geriatric Psychiatry Branch (GPB) of the intramural program of the NIMH who initiated the study (PI: Dr. Trey Sunderland).
Funding
This study was supported by a number of grants from the National Institutes of Health (NH), including: R01 AG050560 and P30 AG021334 (for the Johns Hopkins Claude D. Pepper Older Americans Independence Center), U19-AG03365, P50-AG005146 and S10OD021648 (for the BIOCARD study). Dr. Walker was supported by K23-AG064122 and T32-AG027668, and Dr. Gross was supported by K01-AG050699. This research was also supported in part by the Intramural Research Program of the National Institute on Aging, NIH.
Footnotes
Publisher's Disclaimer: This is a PDF file of an unedited manuscript that has been accepted for publication. As a service to our customers we are providing this early version of the manuscript. The manuscript will undergo copyediting, typesetting, and review of the resulting proof before it is published in its final form. Please note that during the production process errors may be discovered which could affect the content, and all legal disclaimers that apply to the journal pertain.
Conflict of Interests and Disclosure
KAW: None
ALG: None
ARM: None
AS: None
CP: None
XH: None
HL: None
AJA: None
MB: None
MIM: None
MSA: Dr. Albert is a consultant for Eli Lilly
JW: None
Contributor Information
Keenan A. Walker, Department of Neurology, Johns Hopkins University, Baltimore, MD.
Alden L. Gross, Department of Epidemiology, Johns Hopkins Bloomberg School of Public Health, Baltimore, MD.
Alfonso J. Alfini, Department of Mental Health, Johns Hopkins Bloomberg School of Public Health, Baltimore, MD.
Murat Bilgel, Laboratory of Behavioral Neuroscience, Intramural Research Program, National Institute on Aging, Baltimore, MD.
Michael I. Miller, Department of Biomedical Engineering, Johns Hopkins University, Baltimore, MD.
Marilyn S. Albert, Department of Neurology, Johns Hopkins University School of Medicine, Baltimore, MD.
Jeremy Walston, Division of Geriatric Medicine and Gerontology, Center on Aging and Health, Johns Hopkins University School of Medicine, Baltimore, MD.
References
- Albert M, Soldan A, Gottesman R, McKhann G, Sacktor N, Farrington L, Grega M, Turner R, Lu Y, Li S, Wang M-C, Selnes O, 2014. Cognitive changes preceding clinical symptom onset of mild cognitive impairment and relationship to ApoE genotype. Curr. Alzheimer Res 11, 773–84. [DOI] [PMC free article] [PubMed] [Google Scholar]
- Barrientos RM, Frank MG, Watkins LR, Maier SF, 2012. Aging-related changes in neuroimmune-endocrine function: Implications for hippocampal-dependent cognition. Horm. Behav 10.1016/j.yhbeh.2012.02.010 [DOI] [PMC free article] [PubMed] [Google Scholar]
- Betzel RF, Byrge L, He Y, Goñi J, Zuo XN, Sporns O, 2014. Changes in structural and functional connectivity among resting-state networks across the human lifespan. Neuroimage 102, 345–357. 10.1016/j.neuroimage.2014.07.067 [DOI] [PubMed] [Google Scholar]
- Bilgel M, An Y, Zhou Y, Wong DF, Prince JL, Ferrucci L, Resnick SM, 2016. Individual estimates of age at detectable amyloid onset for risk factor assessment. Alzheimer’s Dement. 12, 373–379. 10.1016/j.jalz.2015.08.166 [DOI] [PMC free article] [PubMed] [Google Scholar]
- Buckner RL, 2005. Molecular, Structural, and Functional Characterization of Alzheimer’s Disease: Evidence for a Relationship between Default Activity, Amyloid, and Memory. J. Neurosci 25, 7709–7717. 10.1523/JNEUROSCI.2177-05.2005 [DOI] [PMC free article] [PubMed] [Google Scholar]
- Carret-Rebillat A-S, Pace C, Gourmaud S, Ravasi L, Montagne-Stora S, Longueville S, Tible M, Sudol E, Chang RC-C, Paquet C, Mouton-Liger F, Hugon J, 2015. Neuroinflammation and Aβ accumulation linked to systemic inflammation are decreased by genetic PKR down-regulation. Sci. Rep 5, 8489 10.1038/srep08489 [DOI] [PMC free article] [PubMed] [Google Scholar]
- Chan MY, Park DC, Savalia NK, Petersen SE, Wig GS, 2014. Decreased segregation of brain systems across the healthy adult lifespan. Proc. Natl. Acad. Sci. U. S. A 111, E4997–5006. 10.1073/pnas.1415122111 [DOI] [PMC free article] [PubMed] [Google Scholar]
- Chavan SS, Huerta PT, Robbiati S, Valdes-Ferrer SI, Ochani M, Dancho M, Frankfurt M, Volpe BT, Tracey KJ, Diamond B, 2012. HMGB1 mediates cognitive impairment in sepsis survivors. Mol. Med 18, 930–7. 10.2119/molmed.2012.00195 [DOI] [PMC free article] [PubMed] [Google Scholar]
- Chhatwal JP, Schultz AP, Johnson KA, Hedden T, Jaimes S, Benzinger TLS, Jack C, Ances BM, Ringman JM, Marcus DS, Ghetti B, Farlow MR, Danek A, Levin J, Yakushev I, Laske C, Koeppe RA, Galasko DR, Xiong C, Masters CL, Schofield PR, Kinnunen KM, Salloway S, Martins RN, McDade E, Cairns NJ, Buckles VD, Morris JC, Bateman R, Sperling RA, 2018. Preferential degradation of cognitive networks differentiates Alzheimer’s disease from ageing. Brain 141, 1486–1500. 10.1093/brain/awy053 [DOI] [PMC free article] [PubMed] [Google Scholar]
- Cunningham C, Hennessy E, 2015. Co-morbidity and systemic inflammation as drivers of cognitive decline: new experimental models adopting a broader paradigm in dementia research. Alzheimers. Res. Ther 7, 33 10.1186/s13195-015-0117-2 [DOI] [PMC free article] [PubMed] [Google Scholar]
- Dev SI, Moore RC, Soontornniyomkij B, Achim CL, Jeste DV, Eyler LT, 2017. Peripheral inflammation related to lower fMRI activation during a working memory task and resting functional connectivity among older adults: a preliminary study. Int. J. Geriatr. Psychiatry 32, 341–349. 10.1002/gps.4482 [DOI] [PMC free article] [PubMed] [Google Scholar]
- Dibbs Z, Thornby J, White BG, Mann DL, 1999. Natural variability of circulating levels of cytokines and cytokine receptors in patients with heart failure: implications for clinical trials. J. Am. Coll. Cardiol 33, 1935–42. [DOI] [PubMed] [Google Scholar]
- Diniz BS, Teixeira AL, Ojopi EB, Talib LL, Mendonça VA, Gattaz WF, Forlenza OV, 2010. Higher serum sTNFR1 level predicts conversion from mild cognitive impairment to Alzheimer’s disease. J. Alzheimer’s Dis 22, 1305–1311. 10.3233/JAD-2010-100921 [DOI] [PubMed] [Google Scholar]
- Eisenberger NI, Berkman ET, Inagaki TK, Rameson LT, Mashal NM, Irwin MR, 2010. Inflammation-induced anhedonia: Endotoxin reduces ventral striatum responses to reward. Biol. Psychiatry 68, 748–754. 10.1016/j.biopsych.2010.06.010 [DOI] [PMC free article] [PubMed] [Google Scholar]
- Felger JC, Li Z, Haroon E, Woolwine BJ, Jung MY, Hu X, Miller AH, 2016. Inflammation is associated with decreased functional connectivity within corticostriatal reward circuitry in depression. Mol. Psychiatry 21, 1358–1365. 10.1038/mp.2015.168 [DOI] [PMC free article] [PubMed] [Google Scholar]
- Gottesman RF, Schneider ALC, Zhou Y, Coresh J, Green E, Gupta N, Knopman DS, Mintz A, Rahmim A, Sharrett AR, Wagenknecht LE, Wong DF, Mosley TH, 2017. Association Between Midlife Vascular Risk Factors and Estimated Brain Amyloid Deposition. JAMA 317, 1443 10.1001/jama.2017.3090 [DOI] [PMC free article] [PubMed] [Google Scholar]
- Gross AL, Walker KA, Abhay M, Pettigre C, Soldan A, Albert MS, Walston J, 2019. Plasma markers of inflammation linked to clinical progression and decline during preclinical AD. Front. Aging Neurosci 10.3389/fnagi.2019.00229 [DOI] [PMC free article] [PubMed] [Google Scholar]
- Hardikar S, Song X, Kratz M, Anderson GL, Blount PL, Reid BJ, Vaughan TL, White E, 2014. Intraindividual variability over time in plasma biomarkers of inflammation and effects of long-term storage. Cancer Causes Control 25, 969–976. 10.1007/s10552-014-0396-0 [DOI] [PMC free article] [PubMed] [Google Scholar]
- Hou X, Liu P, Gu H, Chan M, Li Y, Peng S-L, Wig G, Yang Y, Park D, Lu H, 2018. Estimation of brain functional connectivity from hypercapnia BOLD MRI data: Validation in a lifespan cohort of 170 subjects. Neuroimage 186, 455–463. https://doi.org/S1053811918321062 [DOI] [PMC free article] [PubMed] [Google Scholar]
- Janelidze S, Mattsson N, Stomrud E, Lindberg O, Palmqvist S, Zetterberg H, Blennow K, Hansson O, 2018. CSF biomarkers of neuroinflammation and cerebrovascular dysfunction in early Alzheimer disease. Neurology 91, e867–e877. 10.1212/WNL.0000000000006082 [DOI] [PMC free article] [PubMed] [Google Scholar]
- Jones DT, Graff-Radford J, Lowe VJ, Wiste HJ, Gunter JL, Senjem ML, Botha H, Kantarci K, Boeve BF, Knopman DS, Petersen RC, Jack CR, 2017. Tau, amyloid, and cascading network failure across the Alzheimer’s disease spectrum. Cortex 97, 143–159. 10.1016/j.cortex.2017.09.018 [DOI] [PMC free article] [PubMed] [Google Scholar]
- Jones DT, Knopman DS, Gunter JL, Graff-Radford J, Vemuri P, Boeve BF, Petersen RC, Weiner MW, Jack CR, 2016. Cascading network failure across the Alzheimer’s disease spectrum. Brain 139, 547–562. 10.1093/brain/awv338 [DOI] [PMC free article] [PubMed] [Google Scholar]
- Jones DT, MacHulda MM, Vemuri P, McDade EM, Zeng G, Senjem ML, Gunter JL, Przybelski SA, Avula RT, Knopman DS, Boeve BF, Petersen RC, Jack CR, 2011. Age-related changes in the default mode network are more advanced in Alzheimer disease. Neurology 77, 1524–1531. 10.1212/WNL.0b013e318233b33d [DOI] [PMC free article] [PubMed] [Google Scholar]
- Karch CM, Goate AM, 2015. Alzheimer’s disease risk genes and mechanisms of disease pathogenesis. Biol. Psychiatry 10.1016/j.biopsych.2014.05.006 [DOI] [PMC free article] [PubMed] [Google Scholar]
- Kraynak TE, Marsland AL, Wager TD, Gianaros PJ, 2018. Functional neuroanatomy of peripheral inflammatory physiology: A meta-analysis of human neuroimaging studies. Neurosci. Biobehav. Rev 10.1016/j.neubiorev.2018.07.013 [DOI] [PMC free article] [PubMed] [Google Scholar]
- Krstic D, Madhusudan A, Doehner J, Vogel P, Notter T, Imhof C, Manalastas A, Hilfiker M, Pfister S, Schwerdel C, Riether C, Meyer U, Knuesel I, 2012. Systemic immune challenges trigger and drive Alzheimer-like neuropathology in mice. J. Neuroinflammation 9, 151 10.1186/1742-2094-9-151 [DOI] [PMC free article] [PubMed] [Google Scholar]
- Labrenz F, Wrede K, Forsting M, Engler H, Schedlowski M, Elsenbruch S, Benson S, 2016. Alterations in functional connectivity of resting state networks during experimental endotoxemia - An exploratory study in healthy men. Brain. Behav. Immun 54, 17–26. 10.1016/j.bbi.2015.11.010 [DOI] [PubMed] [Google Scholar]
- Lekander M, Karshikoff B, Johansson E, Soop A, Fransson P, Lundström JN, Andreasson A, Ingvar M, Petrovic P, Axelsson J, Nilsonne G, 2016. Intrinsic functional connectivity of insular cortex and symptoms of sickness during acute experimental inflammation. Brain. Behav. Immun 56, 34–41. 10.1016/j.bbi.2015.12.018 [DOI] [PubMed] [Google Scholar]
- Li R, Wu X, Fleisher AS, Reiman EM, Chen K, Yao L, 2012. Attention-related networks in Alzheimer’s disease: A resting functional MRI study. Hum. Brain Mapp 33, 1076–1088. 10.1002/hbm.21269 [DOI] [PMC free article] [PubMed] [Google Scholar]
- Marsland AL, Kuan DC-H, Sheu LK, Krajina K, Kraynak TE, Manuck SB, Gianaros PJ, 2017. Systemic inflammation and resting state connectivity of the default mode network. Brain. Behav. Immun 62, 162–170. 10.1016/j.bbi.2017.01.013 [DOI] [PMC free article] [PubMed] [Google Scholar]
- Mori S, Wu D, Ceritoglu C, Li Y, Kolasny A, Vaillant MA, Faria AV, Oishi K, Miller MI, 2016. MRICloud: Delivering high-throughput MRI neuroinformatics as cloud-based software as a service. Comput. Sci. Eng 18, 21–35. 10.1109/MCSE.2016.93 [DOI] [Google Scholar]
- Morris JC, 1993. The Clinical Dementia Rating (CDR): current version and scoring rules. Neurology 43, 2412–2414. 10.1212/WNL.43.11.2412-a [DOI] [PubMed] [Google Scholar]
- Nusslock R, Brody GHH, Armstrong CCC, Carroll ALL, Sweet LHH, Yu T, Barton AWW, Hallowell ESS, Chen E, Higgins JPP, Parrish TBB, Wang L, Miller GEE, 2019. Higher Peripheral Inflammatory Signaling Associated With Lower Resting-State Functional Brain Connectivity in Emotion Regulation and Central Executive Networks. Biol. Psychiatry 86, 153–162. 10.1016/j.biopsych.2019.03.968 [DOI] [PMC free article] [PubMed] [Google Scholar]
- Ophir G, Amariglio N, Jacob-Hirsch J, Elkon R, Rechavi G, Michaelson DM, 2005. Apolipoprotein E4 enhances brain inflammation by modulation of the NF-κB signaling cascade. Neurobiol. Dis 20, 709–718. 10.1016/j.nbd.2005.05.002 [DOI] [PubMed] [Google Scholar]
- Palmqvist S, Schöll M, Strandberg O, Mattsson N, Stomrud E, Zetterberg H, Blennow K, Landau S, Jagust W, Hansson O, 2017. Earliest accumulation of β-amyloid occurs within the default-mode network and concurrently affects brain connectivity. Nat. Commun 8, 1214 10.1038/s41467-017-01150-x [DOI] [PMC free article] [PubMed] [Google Scholar]
- Peng SL, Chen X, Li Y, Rodrigue KM, Park DC, Lu H, 2018. Age-related changes in cerebrovascular reactivity and their relationship to cognition: A four-year longitudinal study. Neuroimage 174, 257–262. 10.1016/j.neuroimage.2018.03.033 [DOI] [PMC free article] [PubMed] [Google Scholar]
- Popp J, Oikonomidi A, Tautvydaitė D, Dayon L, Bacher M, Migliavacca E, Henry H, Kirkland R, Severin I, Wojcik J, Bowman GL, 2017. Markers of neuroinflammation associated with Alzheimer’s disease pathology in older adults. Brain. Behav. Immun 62, 203–211. 10.1016/j.bbi.2017.01.020 [DOI] [PubMed] [Google Scholar]
- Power JD, Barnes KA, Snyder AZ, Schlaggar BL, Petersen SE, 2012. Spurious but systematic correlations in functional connectivity MRI networks arise from subject motion. Neuroimage 59, 2142–2154. 10.1016/j.neuroimage.2011.10.018 [DOI] [PMC free article] [PubMed] [Google Scholar]
- Power JD, Mitra A, Laumann TO, Snyder AZ, Schlaggar BL, Petersen SE, 2014. Methods to detect, characterize, and remove motion artifact in resting state fMRI. Neuroimage 84, 320–341. 10.1016/j.neuroimage.2013.08.048 [DOI] [PMC free article] [PubMed] [Google Scholar]
- Schmidt MF, Freeman KB, Windham BG, Griswold ME, Kullo IJ, Turner ST, Mosley THJ, 2016. Associations Between Serum Inflammatory Markers and Hippocampal Volume in a Community Sample. J. Am. Geriatr. Soc 64, 1823–1829. 10.1111/jgs.14283 [DOI] [PMC free article] [PubMed] [Google Scholar]
- Tao Q, Ang TFA, DeCarli C, Auerbach S, Devine S, Qiu WQ, Zhang X, Au R, Auerbach SH, DeCarli C, Stein TD, Ang TFA, Massaro J, Tao Q, 2018. Association of Chronic Low-grade Inflammation With Risk of Alzheimer Disease in ApoE4 Carriers. JAMA Netw. Open 1, e183597 10.1001/jamanetworkopen.2018.3597 [DOI] [PMC free article] [PubMed] [Google Scholar]
- Tarkowski E, Andreasen N, Tarkowski A, Blennow K, 2003. Intrathecal inflammation precedes development of Alzheimer’s disease. J. Neurol. Neurosurg. Psychiatry 74, 1200–5. 10.1136/jnnp.74.9.1200 [DOI] [PMC free article] [PubMed] [Google Scholar]
- Varadhan R, Yao W, Matteini A, Beamer BA, Xue QL, Yang H, Manwani B, Reiner A, Jenny N, Parekh N, Daniele Fallin M, Newman A, Bandeen-Roche K, Tracy R, Ferrucci L, Walston J, 2014. Simple biologically informed infammatory index of two serum cytokines predicts 10 year all-cause mortality in older adults. Journals Gerontol. - Ser. A Biol. Sci. Med. Sci 69 A, 165–173. 10.1093/gerona/glt023 [DOI] [PMC free article] [PubMed] [Google Scholar]
- Varma VR, Varma S, An Y, Hohman TJ, Seddighi S, Casanova R, Beri A, Dammer EB, Seyfried NT, Pletnikova O, Moghekar A, Wilson MR, Lah JJ, O’Brien RJ, Levey AI, Troncoso JC, Albert MS, Thambisetty M, 2017. Alpha-2 macroglobulin in Alzheimer’s disease: a marker of neuronal injury through the RCAN1 pathway. Mol. Psychiatry 22, 13–23. 10.1038/mp.2016.206 [DOI] [PMC free article] [PubMed] [Google Scholar]
- Wajant H, Pfizenmaier K, Scheurich P, 2003. Tumor necrosis factor signaling. Cell Death Differ. 10, 45–65. 10.1038/sj.cdd.4401189 [DOI] [PubMed] [Google Scholar]
- Walker KA, Ficek BN, Westbrook R, 2019. Understanding the Role of Systemic Inflammation in Alzheimer’s Disease. ACS Chem. Neurosci. acschemneuro 9b00333 10.1021/acschemneuro.9b00333 [DOI] [PubMed] [Google Scholar]
- Walker KA, Gottesman RF, Wu A, Knopman DS, Gross AL, Mosley TH, Selvin E, Windham BG, 2019. Systemic inflammation during midlife and cognitive change over 20 years. Neurol. ® 92, 1–12. 10.1212/WNL.0000000000007094 [DOI] [PMC free article] [PubMed] [Google Scholar]
- Walker KA, Windham BG, Brown CH, Knopman DS, Jack CR, Mosley TH, Selvin E, Wong DF, Hughes TM, Zhou Y, Gross AL, Gottesman RF, 2018. The Association of Mid- and Late-Life Systemic Inflammation with Brain Amyloid Deposition: The ARIC-PET Study. J. Alzheimer’s Dis 1–12. 10.3233/JAD-180469 [DOI] [PMC free article] [PubMed] [Google Scholar]
- Walker KAKA, Hoogeveen RCRC, Folsom AR, Ballantyne CMCM, Knopman DSDS, Windham BGG, Jack CRCR, Gottesman RFRF, 2017. Midlife systemic inflammatory markers are associated with late-life brain volume: The ARIC study. Neurology 89 10.1212/WNL.0000000000004688 [DOI] [PMC free article] [PubMed] [Google Scholar]
- Warren KN, Beason-Held LL, Carlson O, Egan JM, An Y, Doshi J, Davatzikos C, Ferrucci L, Resnick SM, 2018. Elevated Markers of Inflammation Are Associated With Longitudinal Changes in Brain Function in Older Adults. Journals Gerontol. Ser. A 10.1093/gerona/glx199 [DOI] [PMC free article] [PubMed] [Google Scholar]
- Yeo TBT, Krienen FM, Sepulcre J, Sabuncu MR, Lashkari D, Hollinshead M, Roffman JL, Smoller JW, Zöllei L, Polimeni JR, Fischl B, Liu H, Buckner RL, 2011. The organization of the human cerebral cortex estimated by intrinsic functional connectivity. J. Neurophysiol 106, 1125–1165. 10.1152/jn.00338.2011 [DOI] [PMC free article] [PubMed] [Google Scholar]
- Yin C, Ackermann S, Ma Z, Mohanta SK, Zhang C, Li Y, Nietzsche S, Westermann M, Peng L, Hu D, Bontha SV, Srikakulapu P, Beer M, Megens RTA, Steffens S, Hildner M, Halder LD, Eckstein HH, Pelisek J, Herms J, Roeber S, Arzberger T, Borodovsky A, Habenicht L, Binder CJ, Weber C, Zipfel PF, Skerka C, Habenicht AJR, 2019. ApoE attenuates unresolvable inflammation by complex formation with activated C1q. Nat. Med 25, 496–506. 10.1038/s41591-018-0336-8 [DOI] [PMC free article] [PubMed] [Google Scholar]
- Zhou Y, Endres CJ, Brasić JR, Huang SC, Wong DF, 2003. Linear regression with spatial constraint to generate parametric images of ligand-receptor dynamic PET studies with a simplified reference tissue model. Neuroimage 18, 975–89. [DOI] [PubMed] [Google Scholar]
Associated Data
This section collects any data citations, data availability statements, or supplementary materials included in this article.