

Abstract
Background
Oxaliplatin and irinotecan are generally used to treat advanced colorectal cancer (CRC) patients. Antibiotics improve the cytotoxicity of oxaliplatin but not irinotecan in a colon cancer cell line in vitro. This study retrospectively assessed whether antibiotics improve the treatment efficacy of oxaliplatin- but not irinotecan-based therapy in advanced CRC patients. Patients and Methods. The medical records of 220 advanced CRC patients who underwent oxaliplatin- or irinotecan-based therapy were retrospectively reviewed. The oxaliplatin and irinotecan groups were further divided into antibiotic-treated (group 1) and antibiotic-untreated (group 2) subgroups.
Results
In oxaliplatin groups 1 and 2, the response rate (RR) was 58.2% and 30.2%, while the disease control rate (DCR) was 92.5% and 64.2%, respectively; the median progression-free survival (PFS) was 10.5 months (95% confidence interval (CI) = 7.5–12.2) and 7.0 months (95% CI = 17.0–26.0), respectively, and the median overall survival (OS) was 23.8 months (95% CI = 5.1–9.1) and 17.4 months (95% CI = 13.1–24.9), respectively. In irinotecan groups 1 and 2, the RR was 17.8% and 20.0%, while the DCR was 75.6% and 69.1%, respectively; the median PFS was 8.2 months (95% CI = 6.2–12.7) and 7.9 months (95% CI = 12.0–23.0), respectively, and the median OS was 16.8 months (95% CI = 5.9–10.6) and 13.1 months (95% CI = 10.4–23.7), respectively.
Conclusion
To improve the treatment efficacy of oxaliplatin-based therapy in advanced CRC patients, adding antibiotics is a potential therapeutic option.
1. Introduction
Oxaliplatin and irinotecan are anticancer agents used to treat cancer patients [1, 2] and in colorectal cancer (CRC) patients, oxaliplatin-, and irinotecan-based therapy is generally used as first- or second-line treatment [3–6]. However, their treatment efficacy in advanced CRC patients is limited. Some types of bacteria mediate the resistance to gemcitabine in the pancreatic cancer cell line and to oxaliplatin but not to irinotecan in the colon cancer cell line [7]. A retrospective study revealed that antibiotics improve the treatment efficacy of gemcitabine-based therapy in advanced cancer patients [8]. We hypothesized that improvement in the treatment efficacy of cytotoxic anticancer agents by adding antibiotics is independent of the tumor primary site but dependent on the type of anticancer agent. This retrospective study assessed whether antibiotics improve the treatment efficacy of oxaliplatin-based but not irinotecan-based therapy in advanced CRC patients.
2. Methods
2.1. Patients
The medical records (2011–2018) of patients diagnosed with CRC histopathologically and administered oxaliplatin- or irinotecan-based therapy as first- or second-line treatment were retrospectively reviewed at the Department of Medical Oncology, Tohoku University Hospital, Japan. Inclusion criteria were as follows: (1) patients with histologically confirmed colorectal adenocarcinoma, (2) patients with least one measurable cancer lesion, (3) patients with unresectable or metastatic lesions, (4) patients who underwent at least one course of oxaliplatin- or irinotecan-based therapy, and (5) patients in whom the treatment efficacy of oxaliplatin-or irinotecan-based therapy had been assessed by computed tomography (CT) at least once. Patients who did not met these inclusion criteria were excluded from the study.
Finally, we identified 120 patients who underwent oxaliplatin-based therapy and 100 patients who underwent irinotecan-based therapy. The oxaliplatin group was further subdivided into antibiotic-treated (group 1; n = 67) and antibiotic-untreated (group 2; n = 53) groups. Similarly, the irinotecan group was further subdivided into antibiotic-treated (group 1; n = 53) and antibiotic-untreated (group 2; n = 47) groups.
The study protocol was approved by the ethics committee of Tohoku University Hospital.
2.2. Treatment Methods
The oxaliplatin-based therapy procedures in this study were as follows:
mFOLFOX6: 85 mg/m2 of oxaliplatin and 200 mg/m2 of leucovorin given intravenously over 2 h, followed immediately by 400 mg/mg2 of a fluorouracil (5-FU) intravenous bolus and then 2400 mg/m2 of 5-FU as a 46 h infusion
SOX: 80 mg/m2 of S-1 orally administered on days 1–14 and 130 mg/m2 of oxaliplatin given intravenously on day 1
CapeOX: 1000 mg/2 of capecitabine orally administered twice a day on days 1–14 and 130 mg/m2 of oxaliplatin given intravenously on day 1
The irinotecan-based therapy procedures were as follows:
mFOLFIRI: 150 mg/m2 of irinotecan and 200 mg/m2 of leucovorin given intravenously over 2 h, followed immediately by 400 mg/mg2 of a 5-FU intravenous bolus and then 2400 mg/m2 of 5-FU given as a 46 h infusion
S-1 plus irinotecan: 80 mg/m2 of S-1 orally administered on days 1–14 and 125 mg/m2 of irinotecan given intravenously on day 1
Irinotecan alone: 125 mg/m2 of irinotecan given twice a week intravenously
Both oxaliplatin group 1 and irinotecan group 1 were administered antibiotics from 2 weeks before the start of oxaliplatin- or irinotecan-based therapy, respectively, to the first imaging evaluation of the treatment efficacy of oxaliplatin- or irinotecan-based therapy, respectively, using CT.
2.3. Evaluation
Responses were assessed using the Response Evaluation Criteria in Solid Tumors version 1.0 [9]. The complete response (CR; all signs of cancer disappeared after oxaliplatin- or irinotecan-based therapy) and partial response (PR; ≥30% decrease in the diameter of measurable lesions on CT) rates were combined and defined as the response rate (RR). The CR, PR, and stable disease (SD; <30% decrease and <20% increase in the diameter of measurable lesions on CT) rates were combined and defined as the disease control rates (DCR). The relative dose intensity of oxaliplatin- or irinotecan was defined as the ratio of the total actual dose to the planned dose. Hematological toxicity was reviewed from medical records and evaluated according to the Common Terminology Criteria for Adverse Events version 4.0 [10].
2.4. Statistical Analysis
The median progression-free survival (PFS) and the median overall survival (OS) were calculated using the Kaplan–Meier method. P values of the RR and DCR between groups 1 and 2 were based on Fisher's exact test. Univariate and multivariate analyses were performed for the relationship between the response to oxaliplatin- or irinotecan-based therapy and the patients' background and severe neutropenia. Statistical analyses, including univariate analysis, multivariate analysis, Pearson's chi-square test, and Fisher's exact test, were performed using JMP® 11 (SAS Institute Inc., Cary, NC, USA). P < 0.05 was considered statistically significant.
3. Results
3.1. Patient Characteristics
Patient characteristics are presented in Table 1. The number of patients who underwent oxaliplatin-based therapy as first- or second-line treatment was comparable between groups 1 and 2. Similarly, the number of patients who underwent irinotecan-based therapy as first- or second-line treatment was comparable between groups 1 and 2. The number of patients who underwent surgery for their primary lesion was significantly high in oxaliplatin group 2 compared to group 1 (Table 1). However, univariate and multivariate analysis showed that the imbalance in the ratio of patients who underwent surgery between oxaliplatin groups 1 and 2 does not influence the correlation between antibiotic treatment and the treatment efficacy of oxaliplatin-based therapy.
Table 1.
Background of patients who underwent oxaliplatin- or irinotecan-based therapy (n = 220).
| Group | Oxaliplatin | P | Irinotecan | P | ||
|---|---|---|---|---|---|---|
| Antibiotic-treated (n = 67) | Antibiotic-untreated (n = 53) | Antibiotic-untreated (n = 53) | Antibiotic-untreated (n = 47) | |||
| Number | 67 | 53 | 53 | 47 | ||
| Sex | ||||||
| Male | 38 (56.7) | 29 (54.7) | 0.9901 | 33 (62.2) | 26 (55.3) | 0.481 |
| Female | 29 (43.3) | 24 (45.3) | 20 (37.8) | 21 (44.7) | ||
| Age (mean) | 68 (27–86) | 66 (24–83) | 70 (32–80) | 66 (38–83) | ||
| Kras status | ||||||
| Wild type | 35 (52.2) | 28 (52.8) | 0.6653 | 22 (41.5) | 26 (55.3) | 0.1677 |
| Mutant type | 32 (48.8) | 25 (47.2) | 31 (58.5) | 21 (44.7) | ||
| Line of oxaliplatin-based or irinotecan-based chemotherapy | ||||||
| First line | 45 (67.1) | 36 (67.9) | 0.7569 | 21 (39.6) | 15 (31.9) | 0.4229 |
| Second-line | 22 (32.8) | 17 (32.1) | 32 (60.4) | 32 (68.1) | ||
| Primary site | ||||||
| Left side colon | 48 (71.6) | 30 (56.6) | 0.1314 | 31 (58.5) | 33 (70.2) | 0.2229 |
| Right side colon | 19 (28.4) | 23 (43.4) | 22 (41.5) | 14 (29.8) | ||
| Relative dose intensity of oxaliplatin (%) | 72.1 | 71.3 | 69.4 | 65.8 | ||
| Resection of primary site | ||||||
| (+) | 39 (58.2) | 47 (88.7) | 0.002 | 37 (69.8) | 36 (76.6) | 0.4456 |
| (−) | 28 (41.8) | 6 (11.3) | 16 (30.2) | 11 (23.4) | ||
| Regimen of first-line chemotherapy (%) | ||||||
| FOLFOX (plus bmab or cmab or pmab) | 53 (79.1) | 33 (62.3) | 0.0521 | |||
| SOX (plus bmab) | 9 (13.4) | 12 (22.6) | 0.1874 | |||
| CapeOX (plus bmab) | 5 (7.5) | 8 (16.9) | 0.1816 | |||
| FOLFORI (plus bmab or rmab or AFL or cmab or pmab) | 38 (71.7) | 32 (68.1) | 0.6939 | |||
| S-1 plus irinotecan | 13 (24.5) | 13 (27.7) | 0.7216 | |||
| CPT11 | 2 (3.8) | 2 (4.3) | 0.9023 | |||
| Average number of treatment (range) | ||||||
| FOLFOX (plus bmab or cmab or pmab) | 17.1 (4–28) | 18.9 (6–29) | ||||
| SOX (plus bmab) | 10.5 (4–14) | 11.2 (5–13) | ||||
| CapeOX (plus bmab) | 9.5 (3–12) | 10.1 (4–13) | ||||
| FOLFORI (plus bmab or rmab or AFL or cmab or pmab) | 16.9 (5–22) | 15.8 (4–23) | ||||
| S-1 plus irinotecan | 10.5 (4–16) | 11.8 (5–15) | ||||
| CPT11 | 16.2 (5–18) | 15.8 (4–21) | ||||
| Postchemotherapy | ||||||
| Irinotecan-based chemotherapy | 35 (52.2) | 27 (50.9) | 0.8879 | 0 (0) | 0 (0) | 1 |
| Oxaliplatin-based chemotherapy | 0 (0) | 0 (0) | 1 | 21 (39.6) | 15 (31.9) | 0.4229 |
| Cmab or pmab plus irinotecan | 7 (10.4) | 5 (9.4) | 0.9011 | 5 (9.4) | 4 (8.5) | 0.8854 |
| Trifluridine, tipiracil | 19 (28.4) | 15 (28.3) | 0.9946 | 21 (39.6) | 14 (29.8) | 0.3034 |
| Regorafenib | 12 (17.9) | 11 (20.8) | 0.6943 | 12 (22.6) | 13 (27.7) | 0.563 |
| Trastuzumab | 1 (1.5) | 0 (0.0) | 0.3718 | 1 (1.9) | 0 (0.0) | 0.3439 |
| Pembrolizumab | 1 (1.5) | 0 (0.0) | 0.3718 | 1 (1.9) | 0 (0.0) | 0.3439 |
FOLFOX: fluorouracil (5-FU) plus oxaliplatin combination therapy; SOX: S-1 plus oxaliplatin combination therapy; CapeOX: capecitabine plus oxaliplatin combination therapy; Bmab: bevacizumab. P was calculated using Pearson's chi-square test.
3.2. Efficacy of Oxaliplatin- or Irinotecan-Based Therapy
The RR and DCR of both oxaliplatin and irinotecan groups 1 and 2 are given in Table 2. Both RR and DCR were significantly high in oxaliplatin group 1 compared to oxaliplatin group 2. The RR of oxaliplatin groups 1 and 2 was 58.2% and 30.2%, respectively, while the DCR was 92.5% and 64.2%, respectively. In contrast, there was no significant difference in the RR and DCR between irinotecan groups 1 and 2. The RR of irinotecan groups 1 and 2 was 17.8% and 20.0%, respectively, while the DCR was 75.6% and 69.1%, respectively.
Table 2.
RRs and DCRs of antibiotic-treated and antibiotic-untreated groups in oxaliplatin- and irinotecan-based therapy.
| Group | Oxaliplatin | Irinotecan | ||||
|---|---|---|---|---|---|---|
| Antibiotic-treated (n = 67) | Antibiotic-untreated (n = 53) | P | Antibiotic-treated (n = 53) | Antibiotic-untreated (n = 47) | P | |
| CR | 0 | 0 | 0 | 0 | ||
| PR | 39 | 19 | 11 | 8 | ||
| SD | 23 | 21 | 27 | 26 | ||
| PD | 5 | 13 | 17 | 11 | ||
| RR (%) | 58.2 | 30.2 | 0.0224 | 20.8 | 17 | 0.7778 |
| DCR (%) | 92.5 | 64.2 | 0.0201 | 71.7 | 72.3 | 0.6724 |
CR: complete response; PR: partial response; SD, stable disease; PD: progressive disease; RR: response rate; DCR: disease control rate. P was calculated using Fisher's exact test.
Both median PFS and median OS were significantly long in oxaliplatin group 1 compared to oxaliplatin group 2. As shown in Figure 1(a), the median PFS of oxaliplatin groups 1 and 2 was 10.5 months (95% confidence interval [CI] = 7.5–12.2) and 7.0 months (95% CI = 5.1–9.1), respectively. As shown in Figure 1(b), the median OS of oxaliplatin groups 1 and 2 was 23.8 months (95% CI = 17.9–26.0) and 17.4 months (95% CI = 13.1–24.9), respectively.
Figure 1.
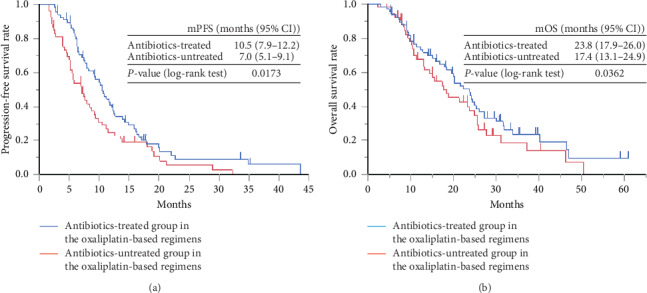
Kaplan–Meier curve of the (a) PFS and (b) OS of antibiotic-treated group (group 1) and antibiotic-untreated group (group 2) in oxaliplatin-based therapy. PFS: progression-free survival; OS: overall survival.
In contrast, there was no significant difference in the median PFS and median OS between irinotecan groups 1 and 2. As shown in Figure 2(a), the median PFS of irinotecan groups 1 and 2 was 8.2 months (95%CI = 6.2–12.7) and 7.9 months (95% CI = 5.9–10.6), respectively. As shown in Figure 2(b), the median OS of irinotecan groups 1 and 2 was 16.8 months (95% CI = 12.0–23.0) and 13.1 months (95% CI = 10.4–23.7), respectively.
Figure 2.
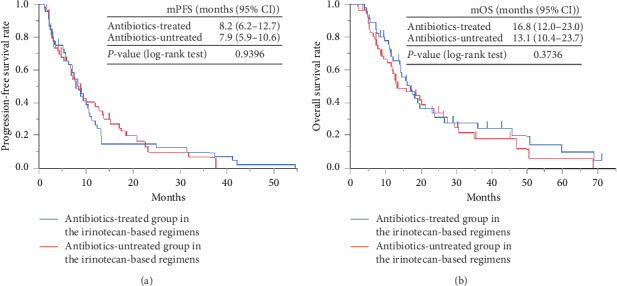
Kaplan–Meier curve of the (a) PFS and (b) OS of the antibiotic-treated group (group 1) and antibiotic-untreated group (group 2) in irinotecan-based therapy. PFS: progression-free survival; OS: overall survival.
We divided oxaliplatin groups 1 and 2 into two groups, respectively. In each group, patients who were treated with fluoropyrimidine intravenously were assigned to oxaliplatin-1-mFOLFOX6 group and oxaliplatin-2-mFOLFOX6 group. In each group, patients who were treated with fluoropyrimidine orally were assigned to oxaliplatin-1-SOX/CapeOX group and oxaliplatin-2-SOX/CapeOX group. We compared the response rate, median PFS and the median OS between oxaliplatin-1-mFOLFOX6 group and oxaliplatin-1-SOX/CapeOX group or between oxaliplatin-2-mFOLFOX6 group oxaliplatin-2-SOX/CapeOX group, respectively. As shown in Supplemental Figure 1 and Supplemental Figure 2, there was no significant difference in median PFS or median OS between oxaliplatin-1-mFOLFOX6 and oxaliplatin-1-SOX/CapeOX or between oxaliplatin-2-mFOLFOX6 group and oxaliplatin-2-SOX/CapeOX group, respectively.
As described in Supplemental Table 1, there was no significant difference in response rate between oxaliplatin-1-mFOLFOX6 and oxaliplatin-1-SOX/CapeOX or between oxaliplatin-2-mFOLFOX6 group and oxaliplatin-2-SOX/CapeOX group, respectively.
3.3. Hematological Toxicity
Hematological toxicity values of both oxaliplatin and irinotecan groups 1 and 2 are given in Table 3. The number of patients with severe leukopenia and neutropenia in oxaliplatin group 1 was significantly high compared to oxaliplatin group 2. The anemia and thrombocytopenia incidence rates and the increase in bilirubin, liver transaminase, and creatinine were similar in oxaliplatin groups 1 and 2. Similarly, the number of patients with severe leukopenia and neutropenia in irinotecan group 1 was significantly high compared to irinotecan group 2. The leukopenia, anemia, and thrombocytopenia incidence rates and the increase in bilirubin, transaminase, and creatinine were similar in irinotecan groups 1 and 2.
Table 3.
Hematological toxicity of antibiotic-treated and antibiotic-untreated groups in oxaliplatin- and irinotecan-based therapy.
| Group | Oxaliplatin-based therapy | Irinotecan-based therapy | ||||
|---|---|---|---|---|---|---|
| Antibiotic-treated (n = 67) | Antibiotic-untreated (n = 53) | P | Antibiotic-treated (n = 53) | Antibiotic- untreated (n = 47) | P | |
| Leukopenia | 9 (13.4) | 1 (1.9) | 0.042 | 11 (20.8) | 5 (10.6) | 0.156 |
| Neutropenia | 22 (32.8) | 5 (9.4) | 0.016 | 20 (37.7) | 6 (12.8) | 0.045 |
| Anemia | 7 (10.4) | 5 (9.4) | 0.854 | 2 (3.8) | 2 (4.3) | 0.751 |
| Thrombocytopenia | 3 (4.5) | 5 (9.4) | 0.281 | 5 (9.4) | 4 (8.5) | 0.881 |
| Elevation of bilirubin | 2 (3.0) | 2 (3.8) | 0.812 | 2 (3.8) | 1 (2.1) | 0.564 |
| Elevation of AST or ALT | 7 (10.4) | 5 (9.4) | 0.854 | 5 (9.4) | 6 (12.8) | 0.441 |
| Elevation of creatinine | 0 (0.0) | 1 (1.9) | 0.2 | 0 (0.0) | 0 (0.0) | 1 |
ALT: alanine aminotransferase; AST: aspartate aminotransferase. P was calculated using Pearson's chi-square test.
3.4. Univariate and Multivariate Analyses
Results of univariate and multivariate analyses are shown in Table 4. We found a statistically significant relationship between the response to oxaliplatin-based therapy and antibiotic treatment (univariate analysis: P=0.0159; multivariate analysis: P=0.0114). The other seven factors were not significantly correlated with the response to oxaliplatin-based therapy. In addition, all eight factors were not significantly correlated with the response to irinotecan-based therapy.
Table 4.
Univariate and multivariate analyses of the relationship between the response to oxaliplatin- or irinotecan-based therapy and the patients' background and severe neutropenia.
| n (%) | Oxaliplatin-based therapy | Irinotecan-based therapy | |||||
|---|---|---|---|---|---|---|---|
| Univariate analysis | Multivariate analysis | P | Univariate analysis | Multivariate analysis | P | ||
| P | OR (95% CI) | P | OR (95% CI) | ||||
| Sex | |||||||
| Male | 67 (55.8) | 0.611 | 1.81 (0.722–3.1222) | 0.5896 | 0.8222 | 1.352 (0.745–3.089) | 0.7856 |
| Female | 53 (44.2) | ||||||
| Age | |||||||
| ≧65 | 68 (56.7) | 0.249 | 1.861 (0.822–2.156) | 0.3902 | 0.3389 | 1.698 (0.722–1.899) | 0.4256 |
| <65 | 52 (43.3) | ||||||
| Antibiotics | |||||||
| Untreated | 53 (44.2) | 0.0159 | 2.815 (1.656–7.228) | 0.0155 | 0.5439 | 1.7989 (0.754–2.156) | 0.6001 |
| Treated | 67 (55.8) | ||||||
| Line of chemotherapy | |||||||
| First line | 81 (67.5) | 0.4489 | 1.525 (0.758–2.115) | 0.4998 | 0.5668 | 1.554 (0.564–2.225) | 0.7054 |
| Second-line | 39 (32.5) | ||||||
| Severe (grade 3 or 4) neutropenia | |||||||
| Negative | 93 (77.5) | 0.5564 | 0.789 (0.252–2.355) | 0.4655 | 0.6612 | 1.882 (0.711–2.225) | 0.5154 |
| Positive | 27 (22.5) | ||||||
| Operation history | |||||||
| Negative | 34 (28.3) | 0.191 | 0.289 (0.896–6.283) | 0.174 | 0.311 | 0.7988 (0.315–8.256) | 0.3598 |
| Positive | 86 (71.7) | ||||||
| Ras status | |||||||
| Wild type | 63 (52.5) | 0.8406 | 1.458 (0.787–1.552) | 0.7154 | 0.7723 | 1.615 (0.498–2.125) | 0.782 |
| Mutant type | 57 (47.5) | ||||||
| Cancer primary site | |||||||
| Right side colon | 42 (35.0) | 0.721 | 0.778 (0.324–2.336) | 0.747 | 0.6129 | 0.756 (0.225–3.089) | 0.7255 |
| Left side colon | 78 (65.0) | ||||||
OR: odds ratio; CI: confidence interval. P was calculated using Pearson's chi-square test.
4. Discussion
A previous study [7] revealed that a decrease in intratumor bacteria by antibiotic treatment augments the antitumor efficacy of gemcitabine in tumor-bearing mice. On the basis of that report [7], we retrospectively demonstrated that antibiotic treatment augments the treatment efficacy of gemcitabine-based therapy in advanced cancer patients [8]. In addition, a decrease in bacteria by adding antibiotics also augments the cytotoxicity of oxaliplatin but not of irinotecan in the CRC cell line in vitro [7], which is consistent with our results in this study. Antibiotic treatment is a factor that is significantly correlated with the efficacy of oxaliplatin-based therapy in advanced CRC patients.
Patients with leukopenia or neutropenia are generally administered antibiotics for prophylaxis [11]. Therefore, it is inevitable that a high number of advanced CRC patients administered antibiotics get leukopenia or neutropenia compared to advanced CRC patients not administered antibiotics. This seems to indicate that adding antibiotics to oxaliplatin- or irinotecan-based therapy does not increase cytotoxicity by oxaliplatin- or irinotecan-based therapy in advanced CRC patients. In addition, there seems to be no correlation between an increase in the incidence rate of leukopenia and improvement in the treatment efficacy of anticancer agents. However, it has been reported that 5-FU and oxaliplatin combination therapy for patients with advanced colorectal cancer has stronger myelotoxicity than SOX therapy or CapeOX therapy for patients with advanced colorectal cancer [12, 13]. There was a higher rate of patients who were treated with mFOLFOX6 regimen in oxaliplatin group 1 when compared to those in oxaliplatin group 2. This might be one explanation to the reason why there were a higher rate of leukopenia and neutropenia in oxaliplatin group 1 than in oxaliplatin group 2.
It has been reported that the primary resection of colorectal cancer worsens the prognosis of patients with advanced colorectal cancer [14]. There was a significantly higher resection rate of the primary site in oxaliplatin group 2 when compared to those in oxaliplatin group 1. The shorter overall survival time of oxaliplatin group 2 when compared to that of oxaliplatin group 1 might be partly attributable to the higher rate of the resection of the primary site in oxaliplatin group 2.
A previous study reported improvement in the treatment efficacy of anticancer agents by adding antibiotics in pancreatic cancer patients [8], indicating that this improvement is independent of the tumor primary site. In contrast, improvement in the treatment efficacy of anticancer agents by adding antibiotics seems to depend on the type of anticancer agent.
This study had a few limitations. First, the study had a retrospective design. Second, the number of patients included was relatively small. Third, cancer type studies were limited to CRC. Both gastric cancer and pancreatic cancer patients undergo oxaliplatin-based therapy in clinical practice [15, 16]. In addition, lung cancer, gastric cancer, and ovarian cancer patients undergo irinotecan-based therapy [2, 17, 18]. However, we did not assess the treatment efficacy and safety of adding antibiotics to oxaliplatin- or irinotecan-based therapy in patients with these types of cancer. Fourth, we could not obtain data on the incidence rate of nonhematological toxicities such as diarrhea. There are trillions of bacteria in the intestinal mucosa [19]. Antibiotic treatment decreases the number of bacteria in the intestinal mucosa and should augment the cytotoxicity of oxaliplatin in the intestinal mucosa, thereby increasing diarrhea. Fifth, we did not assess whether bacteria exist in tumor tissue pathologically in our patients. Fusobacterium nucleatum, which is part of the gut microbiome, is strongly associated with the tumorigenesis of CRC [20] and infiltrates cancer tissue in advanced CRC patients [21, 22]. It is possible that in a large proportion of our patients, bacteria infiltrated CRC tissue. Therefore, improvement in the treatment efficacy of oxaliplatin-based therapy might be attributable to a decrease in bacteria in tumor tissue by adding antibiotics. Further prospective or retrospective studies are required in order to overcome these limitations.
5. Conclusion
Adding antibiotics is a potential therapeutic option to improve the treatment efficacy of oxaliplatin-based but not irinotecan-based therapy in advanced CRC patients. Prospective or retrospective studies to assess the treatment efficacy and safety of adding antibiotics to oxaliplatin- or irinotecan-based therapy are warranted.
Abbreviations
- CRC:
Colorectal cancer
- OS:
Overall survival
- PFS:
Progression-free survival
- CT:
Computed tomography
- RR:
Response rate
- CR:
Complete response
- PR:
Partial response
- SD:
Stable disease
- DCR:
Disease control rate
- PD:
Progressive disease
- ALT:
Alanine aminotransferase
- AST:
Aspartate aminotransferase
- OR:
Odds ratio
- CI:
Confidence interval.
Data Availability
The data used to support the findings are tables and figures included within the work. The detailed retrospective observational data used to support the findings of this study are available from the first author (Hiroo Imai, e-mail: hiroo.imai.d8@tohoku.ac.jp) upon reasonable request. All data in the current study had no personal identifiers and were kept confidential.
Ethical Approval
This study protocol was approved by the ethics committee of Tohoku University Hospital.
Disclosure
All authors agreed to be accountable for all aspects of the work in ensuring that questions related to the accuracy or integrity of any part of the work are appropriately investigated and resolved.
Conflicts of Interest
Chikashi Ishioka, the corresponding author, received research funding from the Tokyo Cooperative Oncology Group, received contributions from Chugai Pharmaceutical, Ono Pharmaceutical, MSD, Pfizer, AstraZeneca, Bristol-Myers Squibb, Janssen Pharmaceutical, Taiho Pharmaceutical, Daiichi Sankyo Company, Limited, and Takeda Pharmaceutical, and is a representative of Tohoku Clinical Oncology Research and Education Society, a specified nonprofit corporation. Masanobu Takahashi received research funding from Ono Pharmaceutical.
Authors' Contributions
Hiroo Imai designed the study and wrote the initial draft of the manuscript. Chikashi Ishioka contributed to the analysis and interpretation of data and assisted in the preparation of the manuscript. All authors have contributed to data collection and interpretation and critically reviewed the manuscript. All authors approved the final version of the manuscript.
Supplementary Materials
Supplemental Table 1: RRs and DCRs of intravenous fluoropyrimidine treatment group and oral fluoropyrimidine treatment group. Supplemental Figure 1: Kaplan–Meier curve of the (a) PFS and (b) OS of oxaliplatin-1-mFOLFOX6 group and oxaliplatin-1-SOX/CapeOX group. PFS: progression-free survival; OS: overall survival. Supplemental Figure 2: Kaplan–Meier curve of the (a) PFS and (b) OS of oxaliplatin-2-mFOLFOX6 group and oxaliplatin-2-SOX/CapeOX group. PFS: progression-free survival; OS: overall survival.
References
- 1.Lim S. H., Shim Y. M., Park S. H., et al. A randomized phase II study of leucovorin/5-fluorouracil with or without oxaliplatin (LV5FU2 vs. FOLFOX) for curatively-resected, node-positive esophageal squamous cell carcinoma. Cancer Research and Treatment. 2017;49(3):816–823. doi: 10.4143/crt.2016.417. [DOI] [PMC free article] [PubMed] [Google Scholar]
- 2.Matsumoto K., Katsumata N., Yamanaka Y., et al. The safety and efficacy of the weekly dosing of irinotecan for platinum- and taxanes-resistant epithelial ovarian cancer. Gynecologic Oncology. 2006;100(2):412–416. doi: 10.1016/j.ygyno.2005.10.013. [DOI] [PubMed] [Google Scholar]
- 3.Hochster H. S., Hart L. L., Ramanathan R. K., et al. Safety and efficacy of oxaliplatin and fluoropyrimidine regimens with or without bevacizumab as first-line treatment of metastatic colorectal cancer: results of the TREE Study. Journal of Clinical Oncology. 2008;26(21):3523–3529. doi: 10.1200/jco.2007.15.4138. [DOI] [PubMed] [Google Scholar]
- 4.Maindrault-Goebel F., de Gramont A., Louvet C., et al. Evaluation of oxaliplatin dose intensity in bimonthly leucovorin and 48-hour 5-fluorouracil continuous infusion regimens (FOLFOX) in pretreated metastatic colorectal cancer. Oncology Multidisciplinary Research Group (GERCOR), Annals of Oncology: Official Journal of the European Society for Medical Oncology. 2000;11(11):1477–1483. doi: 10.1023/a:1026520812351. [DOI] [PubMed] [Google Scholar]
- 5.Hong Y. S., Park Y. S., Lim H. Y., et al. S-1 plus oxaliplatin versus capecitabine plus oxaliplatin for first-line treatment of patients with metastatic colorectal cancer: a randomised, non-inferiority phase 3 trial. The Lancet Oncology. 2012;13(11):1125–1132. doi: 10.1016/s1470-2045(12)70363-7. [DOI] [PubMed] [Google Scholar]
- 6.Muro K., Boku N., Shimada Y., et al. Irinotecan plus S-1 (IRIS) versus fluorouracil and folinic acid plus irinotecan (FOLFIRI) as second-line chemotherapy for metastatic colorectal cancer: a randomised phase 2/3 non-inferiority study (FIRIS study) The Lancet Oncology. 2010;11(9):853–860. doi: 10.1016/s1470-2045(10)70181-9. [DOI] [PubMed] [Google Scholar]
- 7.Geller L. T., Barzily-Rokni M., Danino T., et al. Potential role of intratumor bacteria in mediating tumor resistance to the chemotherapeutic drug gemcitabine. Science. 2017;357(6356):1156–1160. doi: 10.1126/science.aah5043. [DOI] [PMC free article] [PubMed] [Google Scholar]
- 8.Imai H., Saijo K., Komine K., et al. Antibiotic therapy augments the efficacy of gemcitabine-containing regimens for advanced cancer: a retrospective study. Cancer Management and Research. 2019;11:7953–7965. doi: 10.2147/cmar.s215697. [DOI] [PMC free article] [PubMed] [Google Scholar]
- 9.Therasse P., Arbuck S. G., Eisenhauer E. A., et al. New guidelines to evaluate the response to treatment in solid tumors. JNCI: Journal of the National Cancer Institute. 2000;92(3):205–216. doi: 10.1093/jnci/92.3.205. [DOI] [PubMed] [Google Scholar]
- 10.Tobinai K., Kohno A., Shimada Y., et al. Toxicity grading criteria of the Japan clinical Oncology group. Japanese Journal of Clinical Oncology. 1993;23(4):250–257. doi: 10.1093/oxfordjournals.jjco.a039642. [DOI] [PubMed] [Google Scholar]
- 11.Pizzo P. A. Management of patients with fever and neutropenia through the arc of time. Annals of Internal Medicine. 2019;170(6):389–397. doi: 10.7326/m18-3192. [DOI] [PubMed] [Google Scholar]
- 12.Yamada Y., Takahari D., Matsumoto H., et al. Leucovorin, fluorouracil, and oxaliplatin plus bevacizumab versus S-1 and oxaliplatin plus bevacizumab in patients with metastatic colorectal cancer (SOFT): an open-label, non-inferiority, randomised phase 3 trial. The Lancet Oncology. 2013;14(13):1278–1286. doi: 10.1016/s1470-2045(13)70490-x. [DOI] [PubMed] [Google Scholar]
- 13.Xu H.-B., Huang F., Su R., Shen F.-M., Lv Q.-Z. Capecitabine plus oxaliplatin (XELOX) compared with 5-fluorouracil/leucovorin plus oxaliplatin (FOLFOXs) in advanced gastric cancer: meta-analysis of randomized controlled trials. European Journal of Clinical Pharmacology. 2015;71(5):589–601. doi: 10.1007/s00228-015-1828-9. [DOI] [PubMed] [Google Scholar]
- 14.Kleespies A., Füessl K. E., Seeliger H., et al. Determinants of morbidity and survival after elective non-curative resection of stage IV colon and rectal cancer. International Journal of Colorectal Disease. 2009;24(9):1097–1109. doi: 10.1007/s00384-009-0734-y. [DOI] [PubMed] [Google Scholar]
- 15.Yamada Y., Higuchi K., Nishikawa K., et al. Phase III study comparing oxaliplatin plus S-1 with cisplatin plus S-1 in chemotherapy-naïve patients with advanced gastric cancer. Annals of Oncology. 2015;26(1):141–148. doi: 10.1093/annonc/mdu472. [DOI] [PubMed] [Google Scholar]
- 16.Conroy T., Desseigne F., Ychou M., et al. FOLFIRINOX versus gemcitabine for metastatic pancreatic cancer. New England Journal of Medicine. 2011;364(19):1817–1825. doi: 10.1056/nejmoa1011923. [DOI] [PubMed] [Google Scholar]
- 17.Noda K., Nishiwaki Y., Kawahara M., et al. Irinotecan plus cisplatin compared with etoposide plus cisplatin for extensive small-cell lung cancer. New England Journal of Medicine. 2002;346(2):85–91. doi: 10.1056/nejmoa003034. [DOI] [PubMed] [Google Scholar]
- 18.Kang J. H., Lee S. I., Lim D. H., et al. Salvage chemotherapy for pretreated gastric cancer: a randomized phase III trial comparing chemotherapy plus best supportive care with best supportive care alone. Journal of Clinical Oncology. 2012;30(13):1513–1518. doi: 10.1200/jco.2011.39.4585. [DOI] [PubMed] [Google Scholar]
- 19.Jia W., Li H., Zhao L., Nicholson J. K. Gut microbiota: a potential new territory for drug targeting. Nature Reviews Drug Discovery. 2008;7(2):123–129. doi: 10.1038/nrd2505. [DOI] [PubMed] [Google Scholar]
- 20.Tahara T., Yamamoto E., Suzuki H., et al. Fusobacterium in colonic flora and molecular features of colorectal carcinoma. Cancer Research. 2014;74(5):1311–1318. doi: 10.1158/0008-5472.can-13-1865. [DOI] [PMC free article] [PubMed] [Google Scholar]
- 21.Castellarin M., Warren R. L., Freeman J. D., et al. Fusobacterium nucleatum infection is prevalent in human colorectal carcinoma. Genome Research. 2012;22(2):299–306. doi: 10.1101/gr.126516.111. [DOI] [PMC free article] [PubMed] [Google Scholar]
- 22.Kostic A. D., Gevers D., Pedamallu C. S., et al. Genomic analysis identifies association of Fusobacterium with colorectal carcinoma. Genome Research. 2012;22(2):292–298. doi: 10.1101/gr.126573.111. [DOI] [PMC free article] [PubMed] [Google Scholar]
Associated Data
This section collects any data citations, data availability statements, or supplementary materials included in this article.
Supplementary Materials
Supplemental Table 1: RRs and DCRs of intravenous fluoropyrimidine treatment group and oral fluoropyrimidine treatment group. Supplemental Figure 1: Kaplan–Meier curve of the (a) PFS and (b) OS of oxaliplatin-1-mFOLFOX6 group and oxaliplatin-1-SOX/CapeOX group. PFS: progression-free survival; OS: overall survival. Supplemental Figure 2: Kaplan–Meier curve of the (a) PFS and (b) OS of oxaliplatin-2-mFOLFOX6 group and oxaliplatin-2-SOX/CapeOX group. PFS: progression-free survival; OS: overall survival.
Data Availability Statement
The data used to support the findings are tables and figures included within the work. The detailed retrospective observational data used to support the findings of this study are available from the first author (Hiroo Imai, e-mail: hiroo.imai.d8@tohoku.ac.jp) upon reasonable request. All data in the current study had no personal identifiers and were kept confidential.