

Abstract
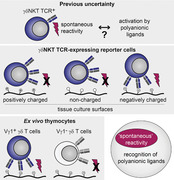
Although γδTCRs were discovered more than 30 yr ago, principles of antigen recognition by these receptors remain unclear and the nature of these antigens is largely elusive. Numerous studies reported that T cell hybridomas expressing several Vγ1‐containing TCRs, including the Vγ1Vδ6 TCR of γδNKT cells, spontaneously secrete cytokines. This property was interpreted as recognition of a self‐ligand expressed on the hybridoma cells themselves. Here, we revisited this finding using a recently developed reporter system and live single cell imaging. We confirmed strong spontaneous signaling by Vγ1Vδ6 and related TCRs, but not by TCRs from several other γδ or innate‐like αβ T cells, and demonstrated that both γ and δ chains contributed to this reactivity. Unexpectedly, live single cell imaging showed that activation of this signaling did not require any interaction between cells. Further investigation revealed that the signaling is instead activated by interaction with negatively charged surfaces abundantly present under regular cell culture conditions and was abrogated when noncharged cell culture vessels were used. This mode of TCR signaling activation was not restricted to the reporter cell lines, as interaction with negatively charged surfaces also triggered TCR signaling in ex vivo Vγ1 γδ T cells. Taken together, these results explain long‐standing observations on the spontaneous reactivity of Vγ1Vδ6 TCR and demonstrate an unexpected antigen presentation‐independent mode of TCR activation by a spectrum of chemically unrelated polyanionic ligands.
Keywords: polyreactivity, TCR signaling, γδ T cells, γδTCR ligands
Synthetic polyanionic ligands, and not a self‐antigen, can cause reactivity of Vγ1 TCRs; offers an alternative explanation to long‐standing observations regarding the spontaneous reactivity of Vγ1 TCRs.
.
Abbreviations
- iNKT cells
Invariant NKT
- MAIT cells
Mucosal‐associated invariant T cells
- NFAT
Nuclear factor of activated T cells
- PDL
Poly‐D‐lysine
- PLZF
Promyelocytic leukemia zinc finger protein
- sFT
Slow fluorescent timer
- αGalCer
α‐Galactosylceramide
1. INTRODUCTION
Three types of antigen receptors—BCR, αβTCR, and γδTCR—define the three types of lymphocytes that constitute the adaptive immune system of all jawed vertebrates.1 Although a lot is known about antigen recognition and functions of B cells and αβ T cells, our knowledge on γδTCR specificities and therefore γδ T cell functions remains rudimentary.2, 3
A relatively small number of self and foreign γδTCR ligands that were suggested to date2 can be split into two categories. The first group includes cell‐surface molecules and in that respect resembles ligands of αβTCRs. However, whereas interaction of γδTCRs with such cell‐surface ligands can involve CDR3 loops,4, 5, 6, 7 in some cases, in contrast to αβTCRs, it may be entirely mediated by germline‐encoded regions.8, 9 The second group includes soluble antigens,10, 11 and in this case γδTCR interaction with such antigens seems to be reminiscent of antibody‐mediated antigen recognition.
Although most γδTCRs remain orphan receptors, a strong indirect evidence for existence of endogenous ligands is present for several γδTCRs, including that of γδNKT cells. γδNKT cells12, 13 are a subset of γδ T cells that exhibit an activated cell‐surface phenotype,13, 14 a molecular signature,15 including expression of TCR‐inducible transcription factor promyelocytic leukemia zinc finger protein (PLZF),16, 17 and innate‐like functional properties13 similar to that of NKT αβ T cell subsets, suggesting that these cells, like their αβ counterparts, undergo agonist selection on endogenous ligands during thymic differentiation.18, 19, 20 Although γδNKT cells are often defined by expression of a TCR composed of Vγ1 (Vγ nomenclature here and below after21) and Vδ6.3 chains in C57BL/6 mice (or allelic variants of the latter—Vδ6.4 in DBA or Vδ6.2 in Balb/c22), few PLZF‐expressing γδ T cells are also detected among Vδ6.3– cells, many of which express Vγ1 with Vδ6λ12 and Vδ4 chains.23 Numerous studies on the characterization of γδ T cell hybridomas described spontaneous cytokine secretion24, 25, 26, 27, 28, 29, 30, 31, 32, 33 or nuclear factor of activated T cells (NFAT) reporter expression34 by some clones. Characterization of the TCR repertoire of such hybridomas revealed that nearly all spontaneously reactive clones expressed Vγ1, and the majority were Vδ6.3 positive, whereas a minority expressed other δ chains, often homologous to Vδ6.3—such as Vδ6λ12 and Vδ4.28, 30, 35 Expression of such TCRs conferred spontaneous cytokine secretion ability to TCR– hybridomas, formally demonstrating that this property was driven by TCR.29, 36 These results led to the idea that these TCRs recognize a self‐ligand expressed by hybridoma cells themselves.24, 25, 26, 27, 28, 29, 30, 31, 32, 33, 34, 37, 38, 39, 40 Early studies also demonstrated that cytokine secretion by such hybridomas was enhanced by mycobacterial Hsp60.24 It was later demonstrated that in addition to Hsp60 itself and peptides derived from this protein,36 cytokine secretion by these hybridomas can be enhanced by synthetic peptides such as poly(Glu, Tyr),41 several lipids including cardiolipin33 and even cultivation under reduced serum concentrations.33 Although “TCR transfer” experiments confirmed that cytokine secretion in response to these stimuli was specific to this group of TCRs, it remained unclear how such a variety of treatments can trigger TCR signaling and how this signaling is related to spontaneous activation of cells with the very same TCRs. As a possible explanation of these phenomena, it was suggested that these treatments may in fact result in further up‐regulation of a self‐ligand, possibly as a result of cellular stress, rather than serve as ligands themselves.40 It was also noted that a lot of these candidate ligands are negatively charged, and it was suggested that polyanionic properties may mediate this broad reactivity.42, 43 Here, we report that spontaneous reactivity of Vγ1 TCR‐expressing cells is unrelated to recognition of a self‐ligand, is independent of contacts between cells and is explained by activation of these TCRs by negatively charged cell culture surfaces such as tissue culture‐treated polystyrene and glass. Taken together with earlier studies, these results demonstrate that several Vγ1 TCRs, including that of γδNKT cells, exhibit broad polyreactivity against anionic ligands.
2. MATERIALS AND METHODS
2.1. TCR constructs
TCRγ‐P2A‐TCRδ cassettes for Vγ5Vδ1, Vγ6Vδ1, and Vγ1Vδ6.4 (DTN40) were generated by overlapping PCRs as described44 and cloned into pMIG vector containing IRES‐GFP using BglII and XhoI sites. DTN40 TCR chains were PCR‐amplified from DNA of DTN40 TCR‐transgenic mouse.16 Vγ5Vδ6.4, Vγ6Vδ6.4, and Vγ1Vδ1 TCR were cloned from the constructs described above using BspEI and BglII or BspEI and XhoI sites.
Vδ4 and Vδ6λ12 TCRδ chains were cloned from Vγ1‐expressing spontaneously reactive hybridomas generated as previously described34 from γδTCR+ cells sorted from C57BL/6 thymi and using BW5147‐NFAT‐slow fluorescent timer (sFT) as fusion partner. RNA was isolated from selected spontaneously reactive hybridomas using Quick‐RNA microprep kit (ZymoResearch, Irvine, CA, USA) and reverse transcribed into cDNA using RevertAid RT Reverse Transcription Kit (ThermoScientific, Waltham, MA, USA) according to the manufacturer's instructions. TCRδ chains were amplified from cDNA by PCR (Q5 High‐Fidelity DNA polymerase, NEB, Ipswich, MA, USA) using V and C region primers introducing BspEI and XhoI sites, respectively. BspEI/XhoI‐digested PCR products were used to replace the Vδ6.4 chain in the BspEI/XhoI‐digested DTN40 Vγ1Vδ6.4 construct described above.
1A1 and 1B1 Vγ1‐IRES‐Vδ6.3 retroviral constructs were cloned from cDNA obtained from γδ T cell hybridomas34 into pMYs‐IRES‐GFP vector. TCRδ coding sequence was inserted between the BamHI and XhoI sites and the TCRγ sequence inserted in place of GFP using NcoI and SalI sites. Previously described invariant NKT (iNKT) and mucosal‐associated invariant T cells (MAIT) TCR constructs45 were a kind gift of Dale Godfrey's lab.
2.2. Retroviral infections
Retrovirus‐containing supernatants were generated by transient cotransfection of PlatE packaging cells with retroviral constructs described above and pCL‐Eco packaging vector using calcium‐phosphate transfection as described.46 Two or three rounds of spin‐infection (500 ×g, 45 min) were performed.
2.3. Generation of TCR expressing reporter lines
BW5147 cells were transduced with NFAT‐sFT reporter construct47 by electroporation. Preliminary experiments demonstrated that transduction of the BW‐sFT cells with TCR‐encoding retroviruses did not result in surface TCR expression, indicating that components of CD3 complex may be missing in these cells. Therefore, BW‐sFT cells were retrovirally transduced with a construct encoding for all murine CD3 subunits and GFP48 (Murine CD3 WTdelta‐F2A‐gamma‐T2A‐epsilon‐P2A‐zeta pMIG II was a gift from Dario Vignali, Addgene plasmid #52092). GFP+ cells were sorted, expanded and used to generate TCR‐expressing lines. All TCRs used in this study were retrovirally transduced into the resulting BW‐sFT‐CD3 cells. 4G4 cells were transduced with TCR‐encoding retroviruses only. Transduced cells were either sorted for TCR expression or used unsorted (with gating on TCR+ cells).
2.4. Cell culture
All cells were kept in humidified atmosphere at 37°C and 5% CO2, BW5147‐based lines were cultured in IMDM (Hyclone, GE Healthcare, Marlborough, MA, USA) supplemented with 10% FCS (Gibco, ThermoScientific, Waltham, MA, USA), 2 mM L‐glutamine (Hyclone), 100U/ml penicillin and 100 µg/ml streptomycin (Hyclone), 20 µM beta‐mercaptoethanol (Gibco). For culture under serum starvation, IMDM was prepared as above without FCS supplementation. 4G4 cells49 (a kind gift from Dr. Francois van Lathem) were cultured in RPMI 1640 (Hyclone) supplemented with 10% FCS (Gibco), 2 mM L‐glutamine (Hyclone), 100U/ml penicillin, and 100 µg/ml streptomycin (Hyclone), 50 µM beta‐mercaptoethanol (Gibco). 4G4 and BW5147 parent lines were tested mycoplasma‐free (LookOut Mycoplasma PCR Detection Kit, Sigma‐Aldrich, Merck, Darmstadt, Germany). Cells were cultured on vacuum gas‐plasma treated (tissue culture‐treated [TC‐treated]) polystyrene (Corning, NY, USA) unless indicated otherwise. Where indicated, glass petri dishes, hydrogel ultra‐low attachment plates (Corning), and nontissue culture‐treated hydrophobic polystyrene plates (Sarstedt, Nümbrecht, Germany) were used.
2.5. Stimulation experiments and antibody‐mediated blocking
Anti‐CD3ε antibody (clone 145‐2C11, Biolegend, San Diego, CA, USA) or anti‐TCRγδ antibody (clone UC7‐13D5, Biolegend) was coated onto plates (2 h at 37°C or overnight at 4°C) at 10 µg/ml. For blocking experiments, anti‐CD3ε antibody (clone 145‐2C11, Biolegend, San Diego, CA, USA) or anti‐TCRγδ antibody (clone UC7‐13D5, Biolegend) was added directly to the cells at 10 µg/ml in culture medium. For poly‐D‐lysine (PDL) coating, plates were treated with PDL (Merck Millipore, Darmstadt, Germany) at 100 µg/ml for 24–48 h. For α‐galactosylceramide (αGalCer) stimulation of iNKT TCR‐expressing reporter cells, cells were cultured in the presence of 100 ng/ml αGalCer (Funakoshi Tokyo, Japan). Poly(Glu, Tyr) (Glu:Tyr (1:1), Sigma‐Aldrich) was dissolved in dH2O at 2 mg/ml and added to cells at concentrations indicated. For stimulation with nucleic acids, RNA (Quick‐RNA microprep kit [ZymoResearch]) and genomic DNA were isolated from 4G4 cells, and 75 nucleotide‐long DNA oligos were obtained from Eurofins Genomics, Ebersberg, Germany. For stimulation with anti‐TCRγδ‐coated beads, Streptavidin Mag Sepharose beads (GE healthcare, Marlborough, MA, USA) were coated with anti‐TCRγδ‐biotin (clone UC7‐13D5, eBioscience); beads were incubated with 33.3 µg/ml antibody for 45 min and 2.5 µl beads per 20 000 cells were used.
All stimulation experiments were performed overnight unless stated otherwise.
2.6. Mice
All mice used in this study had C57BL/6 genetic background. Mice were bred and maintained at Comparative Medicine Biomedicum facility of Karolinska Institutet (Stockholm, Sweden). All animal experiments were carried out according to valid project licenses, which were approved and regularly controlled by the Swedish Veterinary Authorities.
2.7. Thymocyte culture
Thymocytes were isolated from C57BL/6 mice. γδ T cells were enriched from total thymocytes by depletion of CD8+, TCRβ+, and CD19+ cells using anti‐CD8b APC (H35‐17.2, Miltenyi Biotec, Bergisch Gladbach, Germany), anti‐TCRβ‐APC (REA318, Miltenyi), and anti‐CD19‐APC (6D5, BioLegend) in combination with anti‐APC microbeads (Miltenyi) and LD columns (Miltenyi) according to the manufacturer's instructions. Cells were cultured at a density of 1 × 10⁵/well in 96‐well plates for 4 h in either RPMI 1640 with supplements as described above or without FCS supplementation.
2.8. Flow cytometry
Samples were acquired on BD LSR Fortessa flow cytometer and analyzed in FlowJo software (TreeStar). The following antibodies were used: TCRγδ APC (GL3, Biolegend), TCRγδ PE‐Cy7 (GL3, BioLegend), CD3 APC (REA641, Miltenyi), CD3 APC‐Vio770 (REA641, Miltenyi), CD3 PerCP‐Cy5.5 (145‐2C11, Biolegend), CD3 AF488 (17A2, BioLegend), Vγ1 PerCP‐Cy5.5 (2.11, BioLegend), Vδ6.3 APC (C504.17C, BioLegend), TCRβ PerCP‐Vio700 (REA318, Miltenyi), IL‐2 APC (JES6‐5H4, Miltenyi), TNF PE (MP6‐XT22, BioLegend), and fixable viability dye eFluor780 (eBioscience). To detect intracellular cytokines, BrefeldinA (eBioscience) was added to cultures. Staining was performed using BD Cytofix/Cytoperm fixation/permeabilization solution kit (BD Biosciences, San Jose, CA, USA) according to the manufacturer's instructions.
2.9. Live cell imaging
Single cell imaging was performed using a microwell chip (with a glass‐bottom surface and silicon walls of the wells)50 placed in a confocal microscope (Zeiss LSM880), Oberkochen, Germany equipped with a motorized stage and an incubation chamber allowing physiologic conditions (37°C, 5% CO2). Time‐lapse images were acquired at multiple positions every 90 min. For signal quantification, images from single cells trapped in individual wells were exported as TIFF files every 5 frames (7.5 h) and analyzed in ImageJ/Fiji (version 1.52 h). Cell area was marked manually using the freehand selection tool and the mean fluorescence intensity from sFT‐blue and sFT‐red within the region was quantified.
2.10. Modeling and alignment
Homology modelling using SWISS‐MODEL51 (Swiss Institute of Bioinformatics, Biozentrum, University of Basel, Switzerland), based on sequence alignments with evolutionary related structures was performed. The model was built from the amino acid sequence of the individual chains of the TCR using ProMod3 2.0.0. The model with the lowest QMEAN score was selected. The final model is based on template 1hxm.1 (structure of human Vγ9Vδ2 TCR52) from the SWISS‐MODEL template library (version 2019‐11‐19, PDB release 2019‐10‐25). For graphical representation the open‐source software PyMOL was used (Schrodinger, LLC. 2010. The PyMOL Molecular Graphics System, Version 2.1.). Trgv sequences were retrieved from NCBI gene (with gene IDs Trgv1: 21632; Trgv2: 21636; Trgv4: 21638; Trgv5: 21639; Trgv6: 21640; Trgv7: 21641), coding regions were translated to amino acid sequence using ExPASy and aligned using ClustalOmega default settings.
2.11. Statistics
Statistical analyses were performed in GraphPad Prism 8 (GraphPad Software, Inc.) using unpaired two‐tailed Mann‐Whitney test for comparison of sFT‐blue levels in reporter cells transduced with different TCRs.
3. RESULTS
3.1. Unique spontaneous reactivity of the γδNKT TCR
To study signaling properties of γδTCRs, we utilized BW5147 murine thymic lymphoma cells engineered to express subunits of the CD3 complex and a sFT reporter under the control of an NFAT‐dependent promoter. In this system, TCR signaling induces expression of the sFT reporter and this protein shifts its fluorescence from blue to red over time, thereby allowing to distinguish recent and past NFAT activation47, 53 (Fig. 1A). We used these cells to express a panel of TCRs representing major murine γδ T cell subsets that included invariant Vγ5Vδ1 TCR from epidermal γδ T cells, invariant Vγ6Vδ1 TCR, and Vγ1Vδ6.4 γδNKT TCR. The latter TCR originates from DTN40 γδ T cell hybridoma13 and transgenic expression of this TCR was sufficient to drive differentiation of large numbers of γδNKT cells in vivo.16 All TCRs were functional as judged by normal cell‐surface expression and induction of the reporter upon crosslinking with plate‐bound anti‐TCRγδ or anti‐CD3ε antibodies (Fig. 1B and data not shown). In line with previous reports on spontaneous reactivity of Vγ1Vδ6.4 TCR, expression of this but not the other two receptors resulted in induction of the reporter without any deliberate stimulation (Fig. 1C,D). As it was previously shown that cultivation under reduced serum concentration enhanced spontaneous cytokine secretion by several Vγ1 TCR‐expressing cell lines,33 we next tested if this treatment can also further increase the reporter expression in our system. Indeed, serum starvation resulted in an enhancement of sFT expression by Vγ1Vδ6.4‐expressing cells whereas this culture condition did not affect reporter levels in cells expressing the other TCRs (Fig. 1C,D). Serum starvation resulted in decreased surface expression of Vγ1Vδ6.4 TCR but not Vγ5Vδ1 TCR (used here and below as an example of a nonspontaneously reactive TCR) (Fig. 1E), suggesting that this treatment may enhance interaction of the TCR with a putative ligand present in this system, that in turn induces increased TCR internalization. In line with earlier reports,24, 26, 30 soluble anti‐TCRγδ and anti‐CD3ε antibodies efficiently blocked induction of the reporter in serum‐free medium (Fig. 1F and data not shown), indicating that these antibodies may interfere with interaction of the TCR with a putative ligand. Consistent with earlier reports,41 Vγ1Vδ6.4 TCR reactivity was further enhanced in the presence of the synthetic polypeptide poly(Glu,Tyr) (Fig. 1G). To exclude the possibility that this spontaneous reactivity is an idiosyncratic feature of a particular Vγ1Vδ6.4 TCR used in these experiments, we tested two other Vγ1Vδ6.3 receptors cloned from γδ T cell hybridomas34 which had drastically different CDR3δ regions (Table 1). Expression of these two Vγ1Vδ6.3 TCRs in the reporter cell line resulted in spontaneous induction of the reporter, although the level of this induction differed between the TCRs (Fig. 1H), indicating that whereas CDR3 regions contribute to the spontaneous reactivity, a variety of CDR3δ sequences are compatible with spontaneous activation. We concluded that, in agreement with previous reports, signaling by γδNKT TCRs, but not TCRs from the other two γδ T cell lineages was spontaneously activated under standard cell culture conditions.
Figure 1.
Spontaneous TCR reactivity is unique to γδNKT TCRs. (A) Kinetics of sFT‐blue and sFT‐red NFAT reporter expression in Vγ5Vδ1 cells stimulated with plate‐bound anti‐CD3ε antibody overnight or left unstimulated. Time points indicate hours after withdrawal of anti‐CD3 stimulus. (B‐D) Flow cytometric analysis of sFT‐blue expression by reporter cells transduced with indicated TCRγδ constructs; gated on TCRγδ+ cells. (B) Verification of functional TCRγδ signaling by stimulation with plate‐bound anti‐CD3ε antibody. (C) Expression level of sFT‐blue in cells cultured in complete medium (10% FCS, left) or cultured overnight without serum (0% FCS, right). (D) Quantification (geometric mean fluorescence intensity—geoMFI) of sFT‐blue levels in Vγ5Vδ1 and Vγ1Vδ6.4 cells cultured as in (C) across five independent experiments. ** – P < 0.01 (Mann‐Whitney test). (E) Flow cytometric analysis of TCRγδ cell‐surface expression after incubation for 8 h in complete medium (10% FCS) or under serum starvation (0% FCS) for the indicated TCRs. (F) Blocking of sFT‐blue reporter induction under serum starvation (0% FCS) by addition of soluble anti‐CD3ε antibody. (G) sFT‐blue expression after stimulation of Vγ5Vδ1‐ or Vγ1Vδ6.4‐expressing reporter cells with 5 µg/ml poly(Glu,Tyr) (Glu:Tyr 1:1) in complete medium. (H) Flow cytometric analysis of sFT‐blue expression as in (C) for cells expressing Vγ5Vδ1, Vγ1Vδ6.4 (DTN40), and Vγ1Vδ6.3 (1A1 and 1B1) TCRs. Narrow gating on identical TCRγδ expression level was applied. (I) Analysis of sFT‐blue expression as in (C) for reporter cells transduced with indicated TCRs or nontransduced control. Gated on CD3+TCRβ+ for iNKT TCR+ and MAIT TCR+, CD3+TCRγδ+ for Vγ1Vδ6.4+ cells, or GFP+ for nontransduced control. (J) sFT‐blue expression levels upon αGalCer stimulation of iNKT TCR‐transduced BW5147 NFAT‐sFT reporter cells at different cell densities, low: 1 × 10⁴ cells per well of 6‐well plate, intermediate: 1 × 10⁶ cells per well of 6‐well plate, high: 5 × 10⁴ cells per well of 96‐well U‐bottom plate. Gated on CD3+TCRβ+. (B, C, F‐I) Numbers in plots indicate geometric mean fluorescence intensity of sFT‐blue in each condition. Results are representative of two (A) or three or more (B, C, E‐I) independent experiments
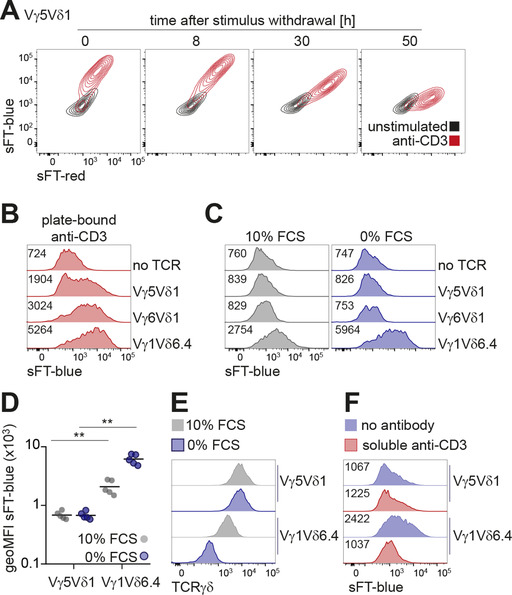
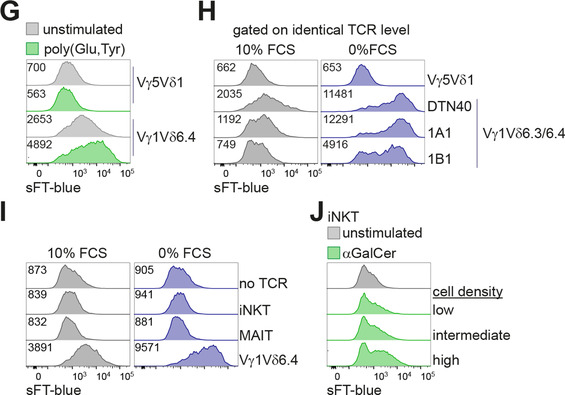
Table 1.
Vγ1 TCRs used in this study
| CDR3δ | CDR3γ | ||||||||
|---|---|---|---|---|---|---|---|---|---|
| Name | TCR | V gene δ | V | D+N | J | V gene γ | V | N | J |
| DTN40 | Vγ1Vδ6.4 | Trav15d‐1/dv6d‐1 | CALWE | HIGGIRA | TD | Trgv1 | CAVWI | GTS | |
| 1A1 | Vγ1Vδ6.3 | Trav15d‐1/dv6d‐1 | CALWE | PDIGGIRAP | D | Trgv1 | CAVWI | S | GTS |
| 1B1 | Vγ1Vδ6.3 | Trav15d‐1/dv6d‐1 | CALWEL | WDTPP | TD | Trgv1 | CAVW | SS | GTS |
| A10 | Vγ1Vδ4 | Trdv2‐2 | CALMER | GRHIGGIRAA | D | Trgv1 | γ chain from DTN40 used | ||
| A2 | Vγ1Vδ6λ12 | Trav15d‐2/dv6d‐2 | CALSEL | NGGS | TD | Trgv1 | γ chain from DTN40 used | ||
| 68 | Vγ1Vδ6λ12 | Trav15d‐2/dv6d‐2 | CALS | SDRRRA | TD | Trgv1 | γ chain from DTN40 used | ||
As Vγ1Vδ6 T cells belong to a family of NKT‐like cells we next tested if TCRs cloned from iNKT and MAIT cells likewise exhibit spontaneous reactivity. Expression of these αβTCRs did not result in any measurable induction of the reporter in complete or serum‐free media (Fig. 1), whereas sFT expression was readily activated by addition of αGalCer to iNKT TCR‐expressing cells in a cell density‐dependent manner (Fig. 1J) in line with CD1d expression by BW5147 cells (data not shown). We therefore concluded that spontaneous reactivity within the extended NKT cell family is restricted to TCRs from γδNKT cells.
We next tested if both Vγ1 and Vδ6.4 chains contributed to the spontaneous reactivity. To this end we generated reporter cells expressing “chimeric” Vγ5Vδ6.4, Vγ6Vδ6.4, and Vγ1Vδ1 TCRs. All three TCRs exhibited normal cell‐surface expression (Fig. 2A) and were readily activated by plate‐bound anti‐CD3ε (Fig. 2B). However, expression of these TCRs did not result in spontaneous up‐regulation of the reporter in cells cultured in complete medium (Fig. 2C). Serum starvation resulted in very low reporter induction in cells expressing Vγ5Vδ6.4 and Vγ6Vδ6.4 TCRs, whereas Vγ1Vδ1 TCR induced intermediate level of the reporter under these conditions (Fig. 2C). We concluded that both γ and δ chains contribute to spontaneous reactivity, with Vγ1 possibly playing a more important role in this process.
Figure 2.
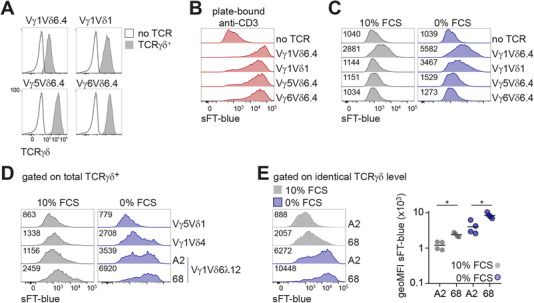
TCRγ and TCRδ chain requirements for spontaneous reactivity. (A) Flow cytometric analysis of TCRγδ cell‐surface expression on BW5147 NFAT‐sFT reporter cells transduced with Vγ1Vδ6.4 TCR, indicated “chimeric” TCRγδ or nontransduced control. TCRγδ‐transduced cells were gated on TCRγδ+, nontransduced cells were gated as GFP+. (B‐C) sFT‐blue expression by reporter cells transduced with the indicated TCR constructs (gated on TCRγδ+) or a nontransduced control (gated on GFP+). Cells were stimulated overnight with plate‐bound anti‐CD3ε antibody (B) or cultured overnight in medium with 0% (C, right) or 10% (C, left) FCS. (D‐E) Flow cytometric analysis of sFT‐blue expression in reporter cells transduced with TCRs containing TCRδ cloned from γδ T cell hybridomas displaying spontaneous reactivity. Cells were cultured overnight in medium with 0% or 10% FCS. Gating on all TCRγδ+ cells (D) or narrow gating on identical TCRγδ expression level (E) was applied. Representative histograms (E, left) and quantification of sFT‐blue geometric mean fluorescence intensity (geoMFI) (E, right) across several independent experiments. * – P < 0.05 (Mann‐Whitney test). (B‐E) Numbers in plots indicate geometric mean fluorescence intensity of sFT blue in each condition. Results are representative of two (B) or four (C‐E) independent experiments
It was previously reported that Vγ1+ hybridomas with several TCRδ chains distinct from but related to Vδ6.3/Vδ6.4 also exhibit spontaneous cytokine secretion.25, 28 In line with these findings, we also observed spontaneous cytokine production by hybridomas expressing Vγ1Vδ4 and Vγ1Vδ6λ12 TCRs (data not shown). Expression of the DTN40 TCR‐derived Vγ1 chain in combination with δ chains cloned from these hybridomas conferred spontaneous reactivity in our reporter system (Fig. 2D). Interestingly, whereas the two Vγ1Vδ6λ12 TCRs only differed in their CDR3δ regions (Table 1), their expression resulted in different levels of reporter up‐regulation even when gating on identical levels of TCR expression was applied (Fig. 2E), indicating that CDR3δ sequence can modulate spontaneous reactivity.
Taken together, these results confirmed that Vγ1Vδ6.3/Vδ6.4 and related receptors possess the ability to activate TCR signaling in cultured reporter cells without any deliberate stimulation, demonstrated that the spontaneous reactivity is unique to this group of TCRs and not observed for receptors cloned from other γδ or innate‐like αβ T cells, and showed that Vγ1 and certain TCRδ chains both contribute to this spontaneous reactivity.
3.2. Spontaneous reactivity of the γδNKT TCR does not require cell‐cell contact
It was long thought that spontaneous cytokine production by the γδNKT TCR‐expressing hybridomas reflects recognition of a self‐ligand expressed by the hybridoma cells themselves.24, 25, 26, 27, 28, 29, 30, 31, 32, 33, 34, 37, 38, 39, 40 We reasoned that if this was the case and this process required interaction with a ligand on neighboring cells, then reporter induction will be decreased when cells are cultured at a lower density due to a decrease in cell contacts. Unexpectedly, and in stark contrast with iNKT TCR‐expressing cells pulsed with αGalCer (Fig. 1J), the reporter in Vγ1Vδ6.4 cells was expressed at comparable levels in cells cultivated at very low density in flat‐bottom wells and at high density in U‐bottom wells both in complete medium and upon serum starvation (Fig. 3A). These results suggested that γδNKT TCR activation in this system may not involve recognition of a ligand expressed on neighboring cells.
Figure 3.
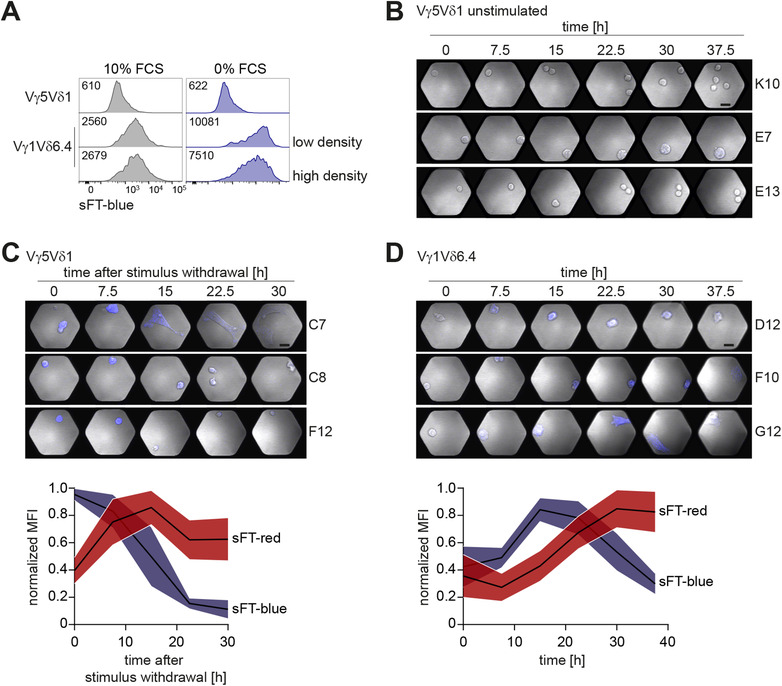
Spontaneous reactivity of γδNKT TCR is cell‐cell contact independent. (A) Flow cytometric analysis of sFT‐blue expression in TCRγδ‐transduced reporter cells upon overnight culture at low (1 × 10⁴ cells per well of 6‐well plate) or high (5 × 10⁴ cells per well of 96‐well U‐bottom plate) density in complete medium (10% FCS, left) or under serum starvation (0% FCS, right). Histograms representative of three independent experiments. Numbers in plots indicate geometric mean fluorescence intensity of sFT‐blue in each condition. (B‐D) sFT‐blue expression analysis by live single cell imaging of unstimulated Vγ5Vδ1‐expressing reporter cells (B), after overnight stimulation of Vγ5Vδ1‐expressing reporter cells with plate‐bound anti‐CD3ε antibody and stimulation withdrawal at the time of imaging (C), or of unstimulated Vγ1Vδ6.4‐expressing reporter cells (D), black bars: 20 µm. Representative images (top) and sFT‐blue/sFT‐red signal quantification (C and D, bottom) for n = 11 (Vγ5Vδ1) and n = 21 (Vγ1Vδ6.4) individual cells analyzed at indicated time points. For some cells analysis was terminated before the last time point due to cell death (as judged based on changes cell morphology and loss of GFP signal). Graphs display normalized mean fluorescence intensity (MFI) of sFT‐blue and sFT‐red over time (quantification was done every 7.5 h), mean and 95% CI are shown. Normalization based on highest MFI value for each individual cell
To formally test if induction of the reporter can occur without contacts between cells, we next performed live cell imaging using a silicon‐glass microchip that allows to spatially confine single cells in microwells.54 Reporter expression was not detected in this system in unstimulated control Vγ5Vδ1 cells (Fig. 3B). Vγ5Vδ1 cells stimulated overnight with plate‐bound anti‐CD3ε and deprived of this stimulus upon plating on the chip exhibited high starting levels of the sFT‐blue reporter that declined over time, concomitant with an increase in sFT‐red signal (Fig. 3C). Expression of the reporter was also readily detected in unstimulated Vγ1Vδ6.4 cells even when analysis was restricted to single cells trapped in a well that did not undergo cell division during the observation period (Fig. 3D). The reporter levels were not enhanced when multiple cells were present in the same well (data not shown) and the level of reporter expression fluctuated over time (Fig. 3D). Reporter up‐regulation by Vγ1Vδ6.4 cells was often followed by loss of round shape and cell stretching (Fig. 3D). Similar morphologic changes were observed in stimulated (Fig. 3C) but not unstimulated (Fig. 3B) Vγ5Vδ1 cells, indicating that this change in morphology reflects an activated status of the cell. Taken together, these results demonstrate that activation of Vγ1Vδ6.4 TCR signaling in this system does not require any form of intercellular communication.
3.3. Spontaneous reactivity of Vγ1 TCRs is induced by interaction with negatively charged cell culture surfaces
Two models could explain cell interaction‐independent induction of the reporter described above. First, it was conceivable that Vγ1Vδ6 TCR is capable of cell‐autonomous signaling similar to that of pre‐TCR or pre‐BCR. Second, it was possible that the TCR is triggered by an exogenous ligand present in the cell culture environment. In line with the latter possibility, live single cell imaging demonstrated that, whereas different temporal patterns of the reporter expression were observed (data not shown), the majority of the cells exhibited a remarkably synchronous wave of reporter up‐regulation (Fig. 3D), suggesting an induction event. As culture medium was not exchanged upon transfer onto the glass chip, this result suggested that culture of Vγ1Vδ6.4‐expressing cells on a glass surface can result in activation of TCR signaling. Indeed, strong up‐regulation of the reporter expression was also detected by flow cytometry after cells were plated on glass dishes (Fig. 4A). Glass surfaces are negatively charged, as is vacuum gas plasma‐treated tissue culture polystyrene (TC‐treated polystyrene)—the most commonly used type of tissue culture plastic.55 We therefore next compared Vγ1Vδ6.4 signaling in cells cultured on a variety of tissue culture surfaces. Strikingly, whereas replating Vγ1Vδ6.4‐expressing cells on previously unused negatively charged surfaces (glass and TC‐treated polystyrene) induced a new wave of sFT‐blue reporter that was further enhanced upon serum starvation, reporter induction was absent in Vγ1Vδ6.4 cells cultured on noncharged (untreated polystyrene and hydrogel‐coated ultra‐low attachment plates) or positively charged (PDL coated) surfaces (Fig. 4A). Furthermore, enhancement of reporter expression by serum starvation was completely abrogated on noncharged or positively charged culture surfaces (Fig. 4A). The reporter exhibited the expected blue‐to‐red conversion when the TCR signaling was abrogated by replating of cells from negatively charged to noncharged surface (Supporting Information Fig. S1A).
Figure 4.
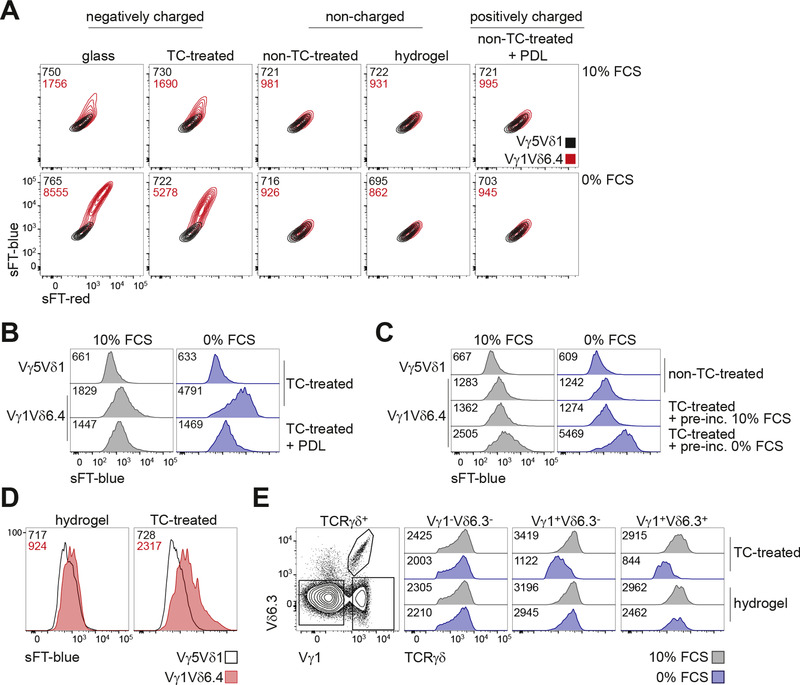
Negatively charged cell culture surfaces induce “spontaneous” reactivity of Vγ1 γδTCRs. (A) Flow cytometric analysis of sFT‐blue and sFT‐red expression in Vγ5Vδ1‐ or Vγ1Vδ6.4‐expressing reporter cells cultured overnight on indicated cell culture surfaces in complete medium (10% FCS, top) or under serum starvation (0% FCS, bottom). (B‐C) Analysis of sFT‐blue expression by Vγ1Vδ6.4+ or Vγ5Vδ1+ reporter cells by flow cytometry upon masking of negative charges of TC‐treated polystyrene by preincubation with poly‐D‐lysine (B) or FCS‐containing medium (C). Cells cultured overnight in complete medium (10% FCS) or under serum starvation (0% FCS). (D) Flow cytometric analysis of sFT‐blue expression in reporter cells transduced with the indicated TCR‐encoding constructs and further cultured on noncharged plastic and then replated daily for the last three days on previously unused TC‐treated or hydrogel‐coated wells in complete medium. Gated on TCRγδ+ cells. (E) Flow cytometric analysis of TCRγδ cell‐surface expression level on the indicated γδ T cell subsets after 4 h culture on TC‐treated or hydrogel surface in complete medium (10% FCS) or under serum starvation (0% FCS). (A‐E) Numbers in plots indicate geometric mean fluorescence intensity of sFT‐blue in each condition. Results representative of at least two independent experiments (A‐E)
As the majority of previous reports describing spontaneous reactivity of Vγ1 TCRs used cytokine secretion as a read‐out for activation of TCR signaling, we next tested if interaction with negatively charged cell culture surfaces also induces cytokine production. Indeed, a fraction of Vγ1Vδ6.4‐expressing BW5147 cells produced TNF and IL‐2 when cultured on TC‐treated but not hydrogel‐coated surfaces, whereas Vγ5Vδ1‐expressing BW5147 cells did not produce the cytokines on either surface (Supporting Information Fig. S1B). Similar results, but with higher frequency of cytokine‐positive cells, were obtained when a TCR‐negative hybridoma 4G449 was transduced with these TCRs (Supporting Information Fig. S1C). Lack of reporter induction on noncharged surfaces was not due to generic attenuation of TCR signaling, as the reporter was readily induced on these plates by anti‐TCRγδ coated beads (Supporting Information Fig. S1D). Coating of negatively charged TC‐treated polystyrene with positively charged PDL strongly attenuated reporter induction (Fig. 4B), suggesting that masking of “epitopes” in this setting interferes with TCR activation. We hypothesized that enhanced Vγ1Vδ6.4 TCR signaling observed under serum starvation conditions may likewise at least in part reflect epitope masking by serum components. Indeed, whereas a new wave of reporter induction was observed upon replating of Vγ1Vδ6.4 cells to TC polystyrene surface, this wave was abrogated if this surface was preincubated with complete but not serum free medium (Fig. 4C). These results suggest that increased levels of the reporter observed in Vγ1Vδ6.4 cells under regular cell culture conditions may be explained by waves of signaling induced by replating onto negatively charged culture surfaces. Indeed, when cells were transduced with Vγ1Vδ6.4 TCR and further maintained on noncharged surfaces, the reporter expression was close to background level (Fig. 4D), but it was readily up‐regulated upon replating to negatively charged plastic (Fig. 4D). We therefore conclude that “spontaneous” reactivity of cultured Vγ1Vδ6.4 cells long thought to reflect recognition of a self‐ligand is in fact explained by activation of this receptor by several types of negatively charged cell culture surfaces.
We next tested if activation of TCR signaling by negatively charged cell culture surfaces holds true for ex vivo cells expressing Vγ1 TCRs. To this end TCRβ/CD8/CD19‐depleted thymocytes were cultured for 4 h on TC‐treated or hydrogel plates in the presence or absence of serum, cells were stained for γδTCR, Vγ1 and Vδ6.3 and TCR down‐regulation was measured as an event proximal to the initiation of TCR signaling. Vγ1+ but not Vγ1– cells exhibited a strong decrease in surface TCR expression when cultured without serum on TC‐treated but not hydrogel plates (Fig. 4E) whereas all three subsets exhibited comparable TCR down‐regulation when plated on anti‐CD3 antibody coated plates (data not shown). Interestingly, this down‐regulation was not obviously influenced by the presence of the Vδ6.3 chain. Thus, interaction with negatively charged surfaces can readily activate TCR signaling in ex vivo Vγ1+ γδ T cells.
4. DISCUSSION
T cell hybridomas expressing Vγ1Vδ6 and few related TCRs were reported to exhibit two modes of reactivity. First, cells with these TCRs were known to spontaneously secrete cytokines in culture—a phenomenon that was always interpreted as recognition of a self‐ligand.24, 25, 26, 27, 28, 29, 30, 31, 32, 33, 34, 37, 38, 39, 40 Second, this secretion was enhanced by a wide variety of chemically unrelated compounds, including bacterial Hsp60,24, 25 negatively charged amino acid‐containing peptides derived from Hsp60,36 synthetic poly(Glu, Tyr) peptide,41 and several negatively charged lipids such as cardiolipin33 that were all suggested to function as ligands for these TCRs. Our findings reported here demonstrate that spontaneous signaling by the Vγ1Vδ6 TCR is unrelated to self‐antigen recognition and is instead induced by commonly used negatively charged cell culture surfaces. Taken together with earlier reports, these results suggest that both “spontaneous” and “induced” modes of Vγ1Vδ6 activation are likely to be underlain by the same mechanism—recognition of a broad spectrum of anionic ligands.
Although the exact mechanisms that activate this TCR upon exposure to such a wide range of organic and even inorganic compounds remain to be determined, the presence of negative charges is a common feature, and, as previously noted,42 many of these compounds represent polyanions. It is therefore plausible that anionic properties are required for interaction of a compound with the Vγ1Vδ6 TCR. Although the direct physical interaction of this TCR with the polyanionic ligands remains to be shown and the responsible paratope has to be mapped, our results reported here demonstrate that specific γ and δ chains both contribute to this reactivity. It was previously suggested that structural properties of Vγ1 chain may mediate recognition of polyanionic ligands.42 Indeed, molecular modeling suggests that several positively charged amino acids in Vγ1 framework 3 region (R74, K79, K81, K82) are exposed at the “apical” surface of the TCR (Supporting Information Fig. S1E and F). These amino acids are absent from Vγ5, Vγ6, and Vγ7 sequences but are present in Vγ2 and/or Vγ4 chains (Supporting Information Fig. S1G). However, lysins 59 and 60 in framework 2 region, that are, according to the model, also exposed on the “lateral” TCR surface, are unique for the Vγ1 chain (Supporting Information Fig. S1G). Although it remains to be tested if any of these positively charged amino acids in the framework regions are involved in recognition of the polyanionic ligands, it is interesting to note that germline‐encoded Vγ sequences were recently shown to be involved in recognition of butyrophilin family members by mouse Vγ7 and human Vγ4 TCRs.8, 9 Results reported here also demonstrate that the amino acid sequences of CDR3 regions impact the strength of spontaneous reactivity. Although the exact features of CDR3 regions responsible for that phenomenon remain to be characterized, it is interesting to note that 1A1 Vγ1Vδ6.3 TCR that has an arginine in its CDR3δ loop exhibited higher spontaneous reactivity than 1B1 TCR that does not have positively charged amino acids in this region. Although for these TCRs minor differences in CDR3γ may also contribute to differences in spontaneous signaling, the two Vγ1Vδ6λ12 TCRs used here only differed by their CDR3δ regions. Again, the 68 TCR that has three arginines in CDR3δ exhibited spontaneous reactivity stronger than that of A2 TCR with no positively charged amino acids in its CDR3δ loop. Thus, CDR3δ sequence modulates the intensity of the signaling, possibly through positively charged amino acids in that region. Overall, the results reported here with a limited number of naturally occurring and chimeric TCRs suggest that responsiveness to polyanionic ligands is “a quantitative trait” that can be influenced by both γ and δ chain sequences, with Vγ1 possibly making a more important contribution to this interaction.
Although the polyanionic nature seems to be a common property of Vγ1Vδ6 TCR activators, not all negatively charged substances can induce this signaling and a number of polypeptides containing negatively charged amino acids failed to activate this receptor.41 Likewise, in our own experiments, dsDNA, ssDNA and RNA did not induce TCR signaling in Vγ1Vδ6.4‐expressing cells (Supporting Information Fig. S1H). Thus, in addition to the negative charge, other yet to be understood properties are required to activate Vγ1Vδ6 TCR.
Among the TCRs from three major γδ T cell populations and two innate‐like αβ T cell subsets tested in this study only Vγ1Vδ6 TCR was activated by negatively charged tissue culture surfaces. Moreover, in numerous studies that described γδ T cell hybridomas spontaneously secreting cytokines, the repertoire of such hybridomas was dominated by the Vγ1Vδ6 and few related TCRs.28, 30, 35 As the generation of T cell hybridomas is widely used in mouse immunology, and no spontaneous reactivity was to our knowledge reported for hybridomas using unrelated αβ or γδTCRs, this reactivity to synthetic polyanionic ligands is highly restricted to a narrow subset of γδTCRs. Lack of technology to generate hybridomas with human T cells may explain why γδTCRs with such properties were not discovered to date in humans. Although further studies are required to test evolutionary conservation of these unusual signaling properties, it is interesting to note that repertoire sequencing studies in manatees revealed that about 50% of peripheral blood TCRδ sequences utilize TRAV‐15 gene segments56 closely homologous to Vδ6.3 (Trav15d‐1/dv6d‐1) and about 50% of TCRγ sequences use TRGV3‐3 segments56 homologous to murine Vγ1 and Vγ2 chains. As Sirenia and rodents belong to the evolutionary divergent branches of placental mammals,57 this observation suggests that γδNKT TCR is evolutionary conserved in this group, at least at the level of individual chains.
Although recognition of polyanionic ligands is restricted to a narrow subset of TCRs, these few TCRs seem to be capable of recognizing a remarkably broad spectrum of ligands ranging from glass surfaces to lipids and synthetic peptides. This breadth of reactivity of these TCRs is reminiscent of polyreactivity suggested for antigen receptors of another innate‐like lymphocyte subset—B‐1 cells.58 Polyreactive antibodies produced by these cells are thought to provide a first line of defense against pathogens by binding to their membranes and cell walls.58 Although the physiologic relevance of Vγ1Vδ6 TCR polyreactivity remains to be determined, it is interesting to note that whereas occurrence of polyanionic surfaces in mammals is limited,59 cell walls of Gram‐positive and Gram‐negative bacteria are negatively charged.60 Whether Vγ1 TCRs can recognize negatively charged cell walls and whether such recognition could be physiologically relevant remains to be investigated. Nevertheless, it is interesting to note that Vγ1Vδ6.3 TCR‐expressing cells are crucial in the immune response to several pathogens,61, 62 including response to Listeria.63, 64
Ample evidence, including expression of the TCR‐inducible transcription factor PLZF, activated cell‐surface phenotype and ability to rapidly produce cytokines upon stimulation,13, 16, 17 suggests that γδNKT cells, similarly to many other γδ T cell subsets as well as iNKT and MAIT cells, undergo agonist selection during their thymic development. Moreover, whereas only a fraction of Vγ1+Vδ6.3– γδ T cells express PLZF, the majority of these cells exhibit an activated cell‐surface phenotype,17 again suggestive of agonist selection. These observations strongly suggest existence of self‐ligand(s) for the Vγ1Vδ6 (and, possibly, other Vγ1 TCRs) expressed in the thymus. It is conceivable that such a ligand would represent a specific cell‐surface protein. However, in light of the findings reported here, it also seems possible that agonist selection that results in acquisition of activated cell‐surface phenotype and innate‐like functional properties would occur through recognition of a broad spectrum of negatively charged cell‐surface molecules or extracellular matrix components. Further studies are required to test these possibilities.
In this report we describe an unusual mode of direct specific TCR activation by negatively charged surfaces of both organic (polystyrene) and inorganic (glass) nature. The information on this unique mode of TCR signaling induction can instruct directions to search for physiologically relevant self‐ or pathogen‐derived ligands for the γδNKT TCR and provide information necessary for utilization of synthetic ligands to manipulate immune responses mediated by these cells in vivo.
AUTHORSHIP
T.K. and J.D. designed the experiments. J.D., V.G., and L.E. performed most of the experiments. P.A.S. and B.Ö. designed and performed the live cell imaging experiments. J.K. provided reagents, contributed ideas crucial for the design of the study, and performed experiments that were not included in the final version of the manuscript. T.K. and J.D. wrote the manuscript. All authors edited the manuscript. T.K. supervised the study. J.D., V.G., and L.E. contributed equally to this study.
DISCLOSURES
J.K. is a cofounder of Tepthera Ltd. The other authors declare no conflicts of interest.
Supporting information
Supporting Information
ACKNOWLEDGMENTS
We thank Dale Godfrey's laboratory (University of Melbourne) for the MAIT and iNKT TCR constructs and Yaroslav Nikolaev (ETH Zürich) for helpful discussions. This study was supported by the Swedish Research Council (grant 2017‐01118 to T.K.), Cancerfonden (grant CAN 2018/710 to T.K), Åke Wibergs Stiftelse (grant M18‐0094 to T.K.), a stipend from Wenner‐Gren Foundations (to T.K.), and the Knut and Alice Wallenberg Foundation (grant KAW 2018.0106 to B.Ö.).
Dunst J, Glaros V, Englmaier L, et al. Recognition of synthetic polyanionic ligands underlies “spontaneous” reactivity of Vγ1 γδTCRs. J Leukoc Biol. 2020;107:1033–1044. 10.1002/JLB.2MA1219-392R
REFERENCES
- 1. Boehm T, Hirano M, Holland SJ, Das S, Schorpp M, Cooper MD. Evolution of alternative adaptive immune systems in vertebrates. Annu Rev Immunol. 2018;36:19‐42. [DOI] [PubMed] [Google Scholar]
- 2. Willcox BE, Willcox CR. γδ TCR ligands: the quest to solve a 500‐million‐year‐old mystery. Nat Immunol. 2019;20:121‐128. [DOI] [PubMed] [Google Scholar]
- 3. Kreslavsky T, von Boehmer H. gammadeltaTCR ligands and lineage commitment. Semin Immunol. 2010;22:214‐221. [DOI] [PMC free article] [PubMed] [Google Scholar]
- 4. Adams EJ, Chien YH, Garcia KC. Structure of a gammadelta T cell receptor in complex with the nonclassical MHC T22. Science. 2005;308:227‐231. [DOI] [PubMed] [Google Scholar]
- 5. Shin S, El‐Diwany R, Schaffert S, et al. Antigen recognition determinants of gammadelta T cell receptors. Science. 2005;308:252‐255. [DOI] [PubMed] [Google Scholar]
- 6. Luoma AM, Castro CD, Mayassi T, et al. Crystal structure of Vδ1 T cell receptor in complex with CD1d‐Sulfatide shows MHC‐like recognition of a self‐lipid by human γδ T cells. Immunity. 2013;39:1032‐1042. [DOI] [PMC free article] [PubMed] [Google Scholar]
- 7. Benveniste PM, Roy S, Nakatsugawa M, et al. Generation and molecular recognition of melanoma‐associated antigen‐specific human γδ T cells. Sci Immunol. 2018;3:eaav4036. [DOI] [PubMed] [Google Scholar]
- 8. Melandri D, Zlatareva I, Chaleil RAG, et al. The γδTCR combines innate immunity with adaptive immunity by utilizing spatially distinct regions for agonist selection and antigen responsiveness. Nat Immunol. 2018;19:1352‐1365. [DOI] [PMC free article] [PubMed] [Google Scholar]
- 9. Willcox CR, Vantourout P, Salim M, et al. Butyrophilin‐like 3 directly binds a human Vγ4+ T cell receptor using a modality distinct from clonally‐restricted antigen. Immunity. 2019;51:813‐825.e4. [DOI] [PMC free article] [PubMed] [Google Scholar]
- 10. Zeng X, Wei Y‐L, Huang J, et al. γδ T cells recognize a microbial encoded B cell antigen to initiate a rapid antigen‐specific interleukin‐17 response. Immunity. 2012;37:524‐534. [DOI] [PMC free article] [PubMed] [Google Scholar]
- 11. Zeng X, Meyer C, Huang J, et al. Gamma delta T cells recognize haptens and mount a hapten‐specific response. eLife. 2014;3:e03609. [DOI] [PMC free article] [PubMed] [Google Scholar]
- 12. Vicari AP, Mocci S, Openshaw P, O'Garra A, Zlotnik A. Mouse γδ TCR+NK1.1+ thymocytes specifically produce interleukin‐4, are major histocompatibility complex class I independent, and are developmentally related to αβ TCR+NK1.1+ thymocytes. Eur J Immunol. 1996;26:1424‐1429. [DOI] [PubMed] [Google Scholar]
- 13. Azuara V, Levraud JP, Lembezat MP, Pereira P. A novel subset of adult gamma delta thymocytes that secretes a distinct pattern of cytokines and expresses a very restricted T cell receptor repertoire. Eur J Immunol. 1997;27:544‐553. [DOI] [PubMed] [Google Scholar]
- 14. Prinz I, Sansoni A, Kissenpfennig A, Ardouin L, Malissen M, Malissen B. Visualization of the earliest steps of gammadelta T cell development in the adult thymus. Nat Immunol. 2006;7:995‐1003. [DOI] [PubMed] [Google Scholar]
- 15. Narayan K, Sylvia KE, Malhotra N, et al. Intrathymic programming of effector fates in three molecularly distinct γδ T cell subtypes. Nat Immunol. 2012;13:511‐518. [DOI] [PMC free article] [PubMed] [Google Scholar]
- 16. Kreslavsky T, Savage AK, Hobbs R, et al. TCR‐inducible PLZF transcription factor required for innate phenotype of a subset of gammadelta T cells with restricted TCR diversity. Proc Natl Acad Sci U S A. 2009;106:12453‐12458. [DOI] [PMC free article] [PubMed] [Google Scholar]
- 17. Alonzo ES, Gottschalk RA, Das J, et al. Development of promyelocytic zinc finger and ThPOK‐expressing innate {gamma}{delta} T cells is controlled by strength of TCR signaling and Id3 3. J Immunol. 2009. [DOI] [PMC free article] [PubMed] [Google Scholar]
- 18. Sumaria N, Martin S, Pennington DJ. Developmental origins of murine γδ T‐cell subsets. Immunology. 2019;156:299‐304. [DOI] [PMC free article] [PubMed] [Google Scholar]
- 19. Muñoz‐Ruiz M, Sumaria N, Pennington DJ, Silva‐Santos B. Thymic determinants of γδ T cell differentiation. Trends Immunol. 2017;38:336‐344. [DOI] [PubMed] [Google Scholar]
- 20. Prinz I, Silva‐Santos B, Pennington DJ. Functional development of γδ T cells. Eur J Immunol. 2013;43:1988‐1994. [DOI] [PubMed] [Google Scholar]
- 21. Heilig JS, Tonegawa S. Diversity of murine gamma genes and expression in fetal and adult T lymphocytes. Nature. 1986;322:836‐840. [DOI] [PubMed] [Google Scholar]
- 22. Azuara V, Grigoriadou K, Lembezat MP, Nagler‐Anderson C, Pereira P. Strain‐specific TCR repertoire selection of IL‐4‐producing Thy‐1 dull gamma delta thymocytes. Eur J Immunol. 2001;31:205‐214. [DOI] [PubMed] [Google Scholar]
- 23. Pereira P, Berthault C, Burlen‐Defranoux O, Boucontet L. Critical role of TCR specificity in the development of Vγ1Vδ6.3+ innate NKTγδ cells. J Immunol. 2013;191:1716‐1723. [DOI] [PubMed] [Google Scholar]
- 24. O'Brien RL, Happ MP, Dallas A, Palmer E, Kubo R, Born WK. Stimulation of a major subset of lymphocytes expressing T cell receptor gamma delta by an antigen derived from Mycobacterium tuberculosis. Cell. 1989;57:667‐674. [DOI] [PubMed] [Google Scholar]
- 25. O'Brien RL, Fu YX, Cranfill R, et al. Heat shock protein Hsp60‐reactive gamma delta cells: a large, diversified T‐lymphocyte subset with highly focused specificity. Proc Natl Acad Sci U S A. 1992;89:4348‐4352. [DOI] [PMC free article] [PubMed] [Google Scholar]
- 26. Roberts K, Yokoyama WM, Kehn PJ, Shevach EM. The vitronectin receptor serves as an accessory molecule for the activation of a subset of gamma/delta T cells. J Exp Med. 1991;173:231‐240. [DOI] [PMC free article] [PubMed] [Google Scholar]
- 27. Wilde DB, Roberts K, Sturmhofel K, Kikuchi G, Coligan JE, Shevach EM. Mouse autoreactive gamma/delta T cells. I. Functional properties of autoreactive T cell hybridomas. Eur J Immunol. 1992;22:483‐489. [DOI] [PubMed] [Google Scholar]
- 28. Ezquerra A, Wilde DB, McConnell TJ, et al. Mouse autoreactive gamma/delta T cells. II. Molecular characterization of the T cell receptor. Eur J Immunol. 1992;22:491‐498. [DOI] [PubMed] [Google Scholar]
- 29. Kikuchi GE, Roberts K, Shevach EM, Coligan JE. Gene transfer demonstrates that the V gamma 1.1C gamma 4V delta 6C delta T cell receptor is essential for autoreactivity. J Immunol. 1992;148:1302‐1307. [PubMed] [Google Scholar]
- 30. Nagler‐Anderson C, McNair LA, Cradock A. Self‐reactive, T cell receptor‐gamma delta+, lymphocytes from the intestinal epithelium of weanling mice. J Immunol. 1992;149:2315‐2322. [PubMed] [Google Scholar]
- 31. Roark CE, Vollmer MK, Cranfill RL, Carding SR, Born WK, O'Brien RL. Liver gamma delta T cells. TCR junctions reveal differences in heat shock protein‐60‐reactive cells in liver and spleen. J Immunol. 1993;150:4867‐4875. [PubMed] [Google Scholar]
- 32. Reardon CL, Vollmer M, Cranfill R, van der Zee R, O'Brien RL, Born WK. Response of a murine epidermal Vγ1/Vδ6‐TCR+hybridoma to heat shock protein HSP‐60. J Invest Dermatol. 1994;103:544‐546. [DOI] [PubMed] [Google Scholar]
- 33. Born WK, Vollmer M, Reardon C, et al. Hybridomas expressing gammadelta T‐cell receptors respond to cardiolipin and beta2‐glycoprotein 1 (apolipoprotein H). Scand J Immunol. 2003;58:374‐381. [DOI] [PubMed] [Google Scholar]
- 34. Kisielow J, Tortola L, Weber J, Karjalainen K, Kopf M. Evidence for the divergence of innate and adaptive T‐cell precursors before commitment to the αβ and γδ lineages. Blood. 2011;118:6591‐6600. [DOI] [PubMed] [Google Scholar]
- 35. Happ MP, Kubo RT, Palmer E, Born WK, O'Brien RL. Limited receptor repertoire in a mycobacteria‐reactive subset of gamma delta T lymphocytes. Nature. 1989;342:696‐698. [DOI] [PubMed] [Google Scholar]
- 36. Fu YX, Vollmer M, Kalataradi H, et al. Structural requirements for peptides that stimulate a subset of gamma delta T cells. J Immunol. 1994;152:1578‐1588. [PubMed] [Google Scholar]
- 37. Hayday AC. γδ cells: a right time and a right place for a conserved third way of protection. Annu Rev Immunol. 2000;18:975‐1026. [DOI] [PubMed] [Google Scholar]
- 38. Allison JP. γδ T‐cell development. Curr Opin Immunol. 1993;5:241‐246. [DOI] [PubMed] [Google Scholar]
- 39. Haas W, Pereira P, Tonegawa S. Gamma/delta cells. Annu Rev Immunol. 1993;11:637‐685. [DOI] [PubMed] [Google Scholar]
- 40. O'Brien RL, Roark CL, Jin N, et al. gammadelta T‐cell receptors: functional correlations. Immunol Rev. 2007;215:77‐88. [DOI] [PubMed] [Google Scholar]
- 41. Cady CT, Lahn M, Vollmer M, et al. Response of murine gamma delta T cells to the synthetic polypeptide poly‐Glu50Tyr50. J Immunol. 2000;165:1790‐1798. [DOI] [PubMed] [Google Scholar]
- 42. Born WK, Kemal Aydintug M, O'Brien RL. Diversity of γδ T‐cell antigens. Cell Mol Immunol. 2012;10:13. [DOI] [PMC free article] [PubMed] [Google Scholar]
- 43. Born W, Cady C, Jones‐Carson J, Mukasa A, Lahn M, O'Brien R. Immunoregulatory functions of γδ T cells In: Dixon FJ, ed. Advances in Immunology. Volume 71 Academic Press; Cambridge, MA, USA: 1998:77‐144. [PubMed] [Google Scholar]
- 44. Holst J, Szymczak‐Workman AL, Vignali KM, Burton AR, Workman CJ, Vignali DA. Generation of T‐cell receptor retrogenic mice. Nat Protoc. 2006;1:406‐417. [DOI] [PubMed] [Google Scholar]
- 45. Koay H‐F, Gherardin NA, Xu C, et al. Diverse MR1‐restricted T cells in mice and humans. Nat Commun. 2019;10:2243. [DOI] [PMC free article] [PubMed] [Google Scholar]
- 46. Fellmann C, Zuber J, McJunkin K, et al. Functional identification of optimized RNAi triggers using a massively parallel sensor assay. Mol Cell. 2011;41:733‐746. [DOI] [PMC free article] [PubMed] [Google Scholar]
- 47. Kisielow J, Obermair F‐J, Kopf M. Deciphering CD4+ T cell specificity using novel MHC–TCR chimeric receptors. Nat Immunol. 2019;20:652‐662. [DOI] [PubMed] [Google Scholar]
- 48. Holst J, Wang H, Eder KD, et al. Scalable signaling mediated by T cell antigen receptor–CD3 ITAMs ensures effective negative selection and prevents autoimmunity. Nat Immunol. 2008;9:658. [DOI] [PubMed] [Google Scholar]
- 49. DiGiusto DL, Palmer E. An analysis of sequence variation in the β chain framework and complementarity determining regions of an allo‐reactive T cell receptor. Mol Immunol. 1994;31:693‐699. [DOI] [PubMed] [Google Scholar]
- 50. Frisk TW, Khorshidi MA, Guldevall K, Vanherberghen B, Önfelt B. A silicon‐glass microwell platform for high‐resolution imaging and high‐content screening with single cell resolution. Biomed Microdevices. 2011;13:683‐693. [DOI] [PubMed] [Google Scholar]
- 51. Waterhouse A, Bertoni M, Bienert S, et al. SWISS‐MODEL: homology modelling of protein structures and complexes. Nucleic Acids Res. 2018;46:W296‐W303. [DOI] [PMC free article] [PubMed] [Google Scholar]
- 52. Allison TJ, Winter CC, Fournié J‐J, Bonneville M, Garboczi DN. Structure of a human γδ T‐cell antigen receptor. Nature. 2001;411:820‐824. [DOI] [PubMed] [Google Scholar]
- 53. Subach FV, Subach OM, Gundorov IS, et al. Monomeric fluorescent timers that change color from blue to red report on cellular trafficking. Nat Chem Biol. 2009;5:118‐126. [DOI] [PMC free article] [PubMed] [Google Scholar]
- 54. Guldevall K, Brandt L, Forslund E, et al. Microchip screening platform for single cell assessment of NK cell cytotoxicity. Front Immunol. 2016;7:119. [DOI] [PMC free article] [PubMed] [Google Scholar]
- 55. Ryan JA. Evolution of cell culture surfaces. BioFiles. 2008;3:21. [Google Scholar]
- 56. Breaux B, Hunter ME, Cruz‐Schneider MP, Sena L, Bonde RK, Criscitiello MF. The Florida manatee (Trichechus manatus latirostris) T cell receptor loci exhibit V subgroup synteny and chain‐specific evolution. Dev Comp Immunol. 2018;85:71‐85. [DOI] [PubMed] [Google Scholar]
- 57. Springer MS, Stanhope MJ, Madsen O, de Jong WW. Molecules consolidate the placental mammal tree. Trends Ecol Evol. 2004;19:430‐438. [DOI] [PubMed] [Google Scholar]
- 58. Baumgarth N. The double life of a B‐1 cell: self‐reactivity selects for protective effector functions. Nat Rev Immunol. 2011;11:34‐46. [DOI] [PubMed] [Google Scholar]
- 59. Gorbet MB, Sefton MV. Biomaterial‐associated thrombosis: roles of coagulation factors, complement, platelets and leukocytes. Biomaterials. 2004;25:5681‐5703. [DOI] [PubMed] [Google Scholar]
- 60. Nuri R, Shprung T, Shai Y. Defensive remodeling: how bacterial surface properties and biofilm formation promote resistance to antimicrobial peptides. Biochim Biophys Acta. 2015;1848:3089‐3100. [DOI] [PubMed] [Google Scholar]
- 61. Sell S, Dietz M, Schneider A, Holtappels R, Mach M, Winkler TH. Control of murine cytomegalovirus infection by γδ T cells. PLoS Pathog. 2015;11:e1004481. [DOI] [PMC free article] [PubMed] [Google Scholar]
- 62. Mamedov MR, Scholzen A, Nair RV, et al. A macrophage colony‐stimulating‐factor‐producing γδ T cell subset prevents malarial parasitemic recurrence. Immunity. 2018;48:350‐363.e7. [DOI] [PMC free article] [PubMed] [Google Scholar]
- 63. Belles C, Kuhl AK, Donoghue AJ, et al. Bias in the gamma delta T cell response to Listeria monocytogenes. V delta 6.3+ cells are a major component of the gamma delta T cell response to Listeria monocytogenes. J Immunol. 1996;156:4280‐4289. [PubMed] [Google Scholar]
- 64. Egan PJ, Carding SR. Downmodulation of the inflammatory response to bacterial infection by γδ T cells cytotoxic for activated macrophages. J Exp Med. 2000;191:2145‐2158. [DOI] [PMC free article] [PubMed] [Google Scholar]
Associated Data
This section collects any data citations, data availability statements, or supplementary materials included in this article.
Supplementary Materials
Supporting Information