Abstract
Primary familial brain calcification (PFBC) is an age‐dependent and rare neurodegenerative disorder characterized by microvascular calcium phosphate deposits in the deep brain regions. Known genetic causes of PFBC include loss‐of‐function mutations in genes involved in either of three processes—platelet‐derived growth factor (PDGF) signaling, phosphate homeostasis or protein glycosylation—with unclear molecular links. To provide insight into the pathogenesis of PFBC, we analyzed murine models of PFBC for the first two of these processes in Pdgfbret/ret and Slc20a2 −/− mice with regard to the structure, molecular composition, development and distribution of perivascular calcified nodules. Analyses by transmission electron microscopy and immunofluorescence revealed that calcified nodules in both of these models have a multilayered ultrastructure and occur in direct contact with reactive astrocytes and microglia. However, whereas nodules in Pdgfbret/ret mice were large, solitary and smooth surfaced, the nodules in Slc20a2 −/− mice were multi‐lobulated and occurred in clusters. The regional distribution of nodules also differed between the two models. Proteomic analysis and immunofluorescence stainings revealed a common molecular composition of the nodules in the two models, involving proteins implicated in bone homeostasis, but also proteins not previously linked to tissue mineralization. While the brain vasculature of Pdgfbret/ret mice has been reported to display reduced pericyte coverage and abnormal permeability, we found that Slc20a2 −/− mice have a normal pericyte coverage and no overtly increased permeability. Thus, lack of pericytes and increase in permeability of the blood–brain barrier are likely not the causal triggers for PFBC pathogenesis. Instead, gene expression and spatial correlations suggest that astrocytes are intimately linked to the calcification process in PFBC.
Keywords: brain calcification, mass spectrometry, PDGFB retention motive knockout, PFBC, Slc20a2 knockout
Introduction
Primary familial brain calcification (PFBC), also known as Fahr’s disease, is a rare, age‐dependent neurological condition characterized by bilateral symmetrical calcifications along capillaries in specific regions of the brain parenchyma 7, 10, 18, 19, 27, 43. While approximately one‐third of the affected individuals stay asymptomatic, a wide variety of neuropsychiatric and motor dysfunctions have been reported for the symptomatic individuals, including Parkinsonism, dementia, psychosis and cognitive inabilities. Sporadic as well as inherited autosomal dominant and autosomal recessive cases of PFBC have been reported 26, 27, 43, 45, the underlying mechanisms of which have not been fully elucidated. Over the past years, causative mutations in five genes have been discovered: solute carrier family 20 (phosphate transporter) member 2 (SLC20A2) 42, xenotropic and polytropic retrovirus receptor 1 (XPR1) 20, platelet‐derived growth factor‐B (PDGFB) 17, platelet‐derived growth factor receptor‐β (PDGFRB) 29 and myogenesis‐regulating glycosidase (MYORG) 45. SLC20A2 and XPR1 encode phosphate transporters, providing a link between phosphate imbalance and PFBC. On the other hand, while several different loss‐of‐function mutations have been described in PDGFB and its cognate receptor‐coding gene PDGFRB in PFBC families, it is currently unknown how loss of PDGF‐B/PDGFRβ signaling triggers onset of brain calcification. It is also unclear how loss of the glycosidase MYORG, which is specifically expressed in astrocytes in the brain, cause PFBC.
To date, mouse mutants of Slc20a2, Pdgfb and Myorg (also annotated as AI464131) have been reported to mimic PFBC. Homozygous knockouts for the Slc20a2 gene (Slc20a2 −/− ) develop cerebral calcifications from as early as 1 month of age. Interestingly, vascular‐associated calcifications have been reported also in other organs of Slc20a2 −/− mice 14, 41. A second mouse model for PFBC carries a homozygous deletion of the retention motif of PDGF‐B (Pdgfbret/ret) 22, 30, preventing accumulation of the growth factor PDGF‐B in the perivascular matrix, while still allowing receptor binding and biological activity. Pdgfbret/ret mice have severely reduced numbers of pericytes in the brain and display a dysfunctional blood–brain barrier (BBB) 4. From 2 months of age, they display brain perivascular mineralized nodules with a histological appearance and anatomical location closely resembling the human PFBC pathology 17. Myorg −/− mice display calcified nodules in the thalamic region of the brain at 9 months of age, seemingly at lower abundance than what has been reported in Slc20a2 −/− and Pdgfbret/ret mice 14, 17, 45.
In the present study, we analyzed and compared the ultrastructure of calcifications in Pdgfbret/ret and Slc20a2 −/− mice. This revealed both similarities and differences in the morphology and location of the calcified nodules. We also found that the nodules in both models were in direct contact with at least two cell types: astrocytes and microglia. Using microdissected and laser‐captured material for mass spectrometry analysis, we analyzed the protein content of the matrix that builds up the nodules in Pdgfbret/ret mice and used this knowledge to provide new insights into their possible origin and growth.
Results
Transmission electron microscopy reveals a layered structure and cellular associations of perivascular calcifications in Pdgfb ret/ret mice
We have previously described the occurrence of calcified nodules in the Pdgfbret/ret mouse model and their phenotypic resemblance to the brain calcifications observed in human PFBC 17. In order to gain further insight into the structure of calcifications, we investigated calcification‐prone deep brain regions of adult Pdgfbret/ret mice by transmission electron microscopy (TEM). This analysis revealed that calcified nodules display a conspicuously layered structure, suggesting a discrete, possibly singular, point of origin (nidus) from which they grow through the addition of external layers, similar to the annual rings of a tree stem (Figure 1A–G). At high magnification, the variable electron densities of the different layers were clearly apparent (Figure 1A–C). We observed speckles of highly electron dense material within the nodules, consistent with the presence of calcium phosphate deposits (Figure 1C, red arrowheads). We further observed a variation in the surfaces of the calcified nodules, with some being rugged (Figure 1D, black arrowheads) and others smooth (Figure 1e–g, black arrows). These differences correlated with the outline of the deeper layers, suggesting that a net deposition of matrix take place at both surfaces, possibly faster at sites where layers are broader (compare Figure 1D and 1E, white arrowheads). Often, these differences were seen at different areas of the same nodule. In keeping with the microvascular association of the nodules, we often found blood vessels profiles in the close vicinity of the nodules (Figure 1B). Moreover, we observed that two different cell types were often found in direct physical contact with the nodules. Astrocytes, recognizable through the presence of a light (electron permissive) cytoplasm containing electron‐dense granules (interpreted as glycogen deposits) (Figure 1E, red arrowhead) and dense bundles of intermediate filaments (Figure 1E, red arrow), were apposed to the nodules and directly touching their calcified matrix at both rugged and smooth edges. We also found microglial/macrophage‐type cells (henceforth referred to as microglia for brevity) directly contacting the calcified matrix. These cells were characterized by their electron‐dense cytoplasm and an abundance of mitochondria (Figure 1F). In order to corroborate these observations, the alternative apposition of astrocytes and microglia to the nodules was also supported by immunofluorescence (Figure 5, Supplementary Movies S1 and S2).
Figure 1.
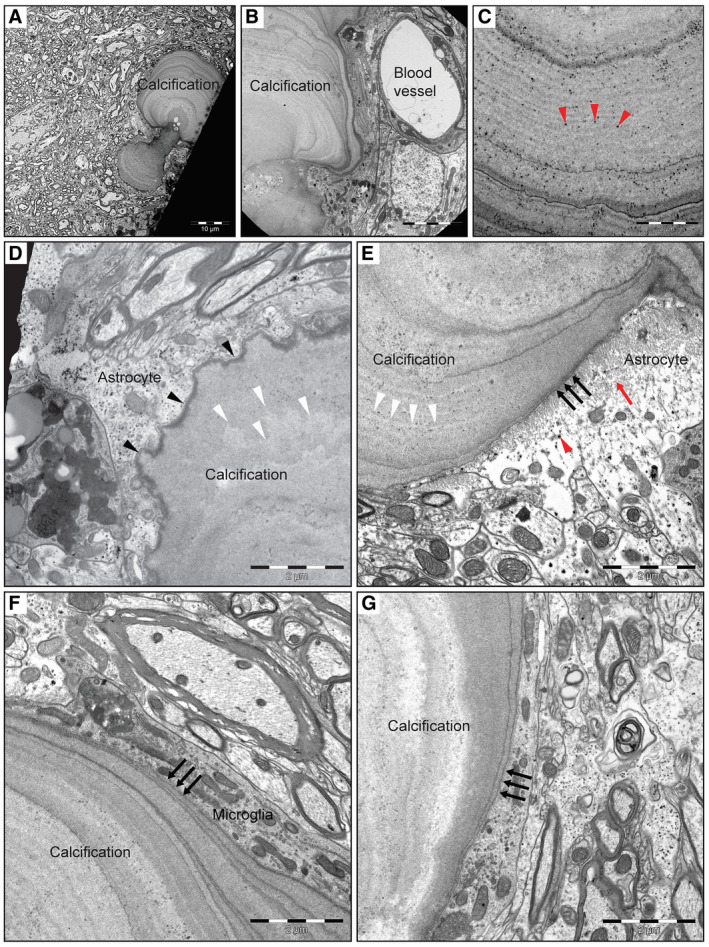
TEM analysis of Pdgfbret/ret mouse deep brain regions reveals nodules with layered structure and cellular association. A. Representative image of a calcification with two nodules with both a “rugged” and smooth surface area found in the deep brain region of a 5‐month‐old mouse. B. Magnified view of a multilayered calcification with varying electron density in close vicinity to a blood vessel. Red arrowheads in (C) show the presence of calcium phosphate crystals in the nodule. D. An illustration of a nodule with a “rugged” surface area (black arrowheads) in close proximity to an astrocyte. The surface structure (black arrowheads) correlates with the deeper layering (white arrowheads in D and E). E. Representative image of the immediate association of a smooth‐surfaced (black arrows) calcified nodule with an astrocyte. Red arrowhead indicate electron dense glycogen granules and red arrow indicates cytoplasmic intermediate filaments. (F, G) Microglia in direct contact with a nodule with smooth surface area (black arrows).
Figure 5.
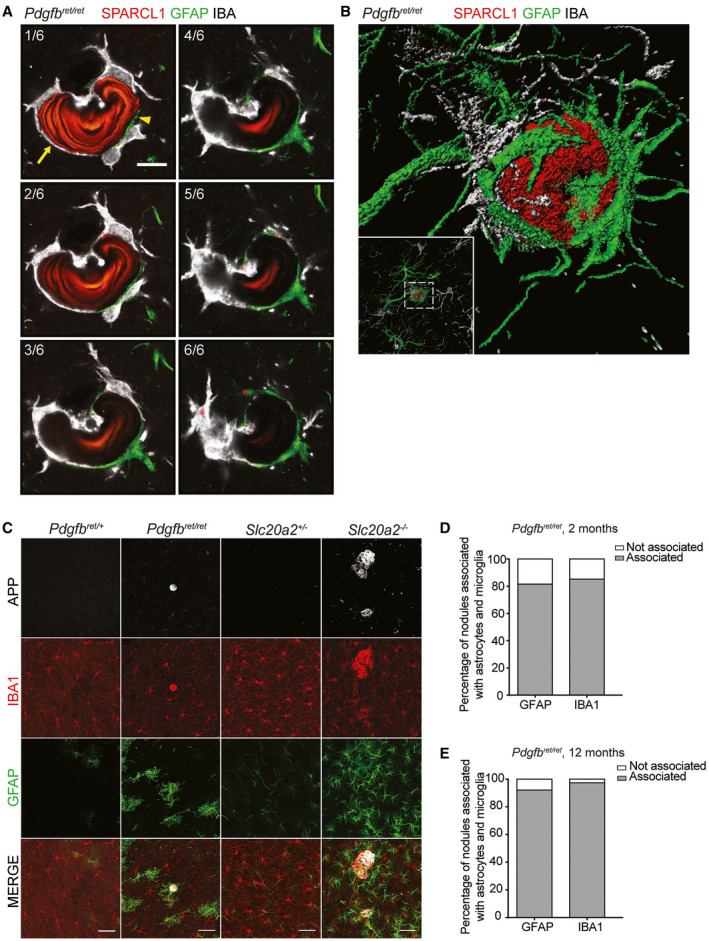
Astrocyte and microglia processes encompass most of the nodule circumference. A. Representative confocal images of six optical stacks showing co‐immunolabeling for SPARCL1, GFAP and IBA1. Arrow indicates the surface area of the nodule in contact with IBA‐positive microglia and arrowheads indicate the surface area of the nodule in direct contact with GFAP‐positive reactive astrocyte processes. Scale bar, 10 µm. B. Volumetric 3D rendering of a nodule stained with APP (red) associated with a GFAP‐positive astrocyte (green) and IBA1‐positive microglia (white). C. Co‐immunolabeling with APP, IBA1 and GFAP confirming the association of nodules with astrocytes and microglia in both Pdgfbret/ret and Slc20a2 −/− mice. Scale bars, 50 µm. D, E. Percentage of calcifications associated with astrocytes and microglia in deeper brain regions in (D) 2‐ (n = 4) and (E) 12‐month‐old (n = 3) Pdgfbret/ret mice.
Taken together, these observations suggest that the calcified nodules grow by the addition of external matrix layers, are in direct contact with at least two cell types—astrocytes and microglia.
Calcifications in Pdgfb ret/ret mice are composed of both pro‐ and anti‐osteogenic proteins
To investigate the molecular composition of the calcified nodules, we explored their protein content using mass spectrometry (Figure 2). First, we isolated calcified lesions from Pdgfbret/ret brains by manual microdissection under a fluorescent stereomicroscope. By exciting the tissue at 488 nm, we could easily distinguish the nodules from the surrounding brain matter in the green spectrum. During this procedure, vascular association of the nodules was easily observed. A similar‐sized area of neighboring neuropil was used as a control. From this material, proteins were extracted, and after digestion, liquid chromatography and tandem mass spectrometry (LC‐MS/MS) were performed in order to identify the protein content (Supplementary Table S1). From the calcified nodules, we could identify 456 proteins, whereas the control neuropil yielded 545 proteins. Of all detected proteins, 97 were found in the calcifications only (Supplementary Table S2).
Figure 2.
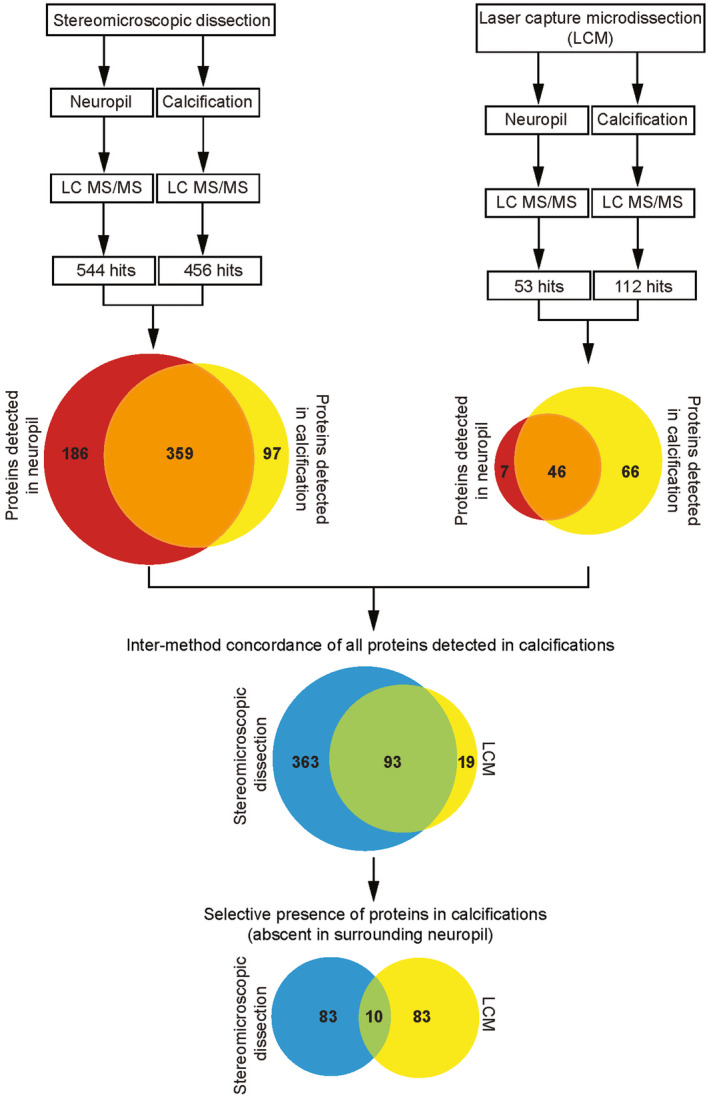
Flow chart for proteomics analysis. Schematic overview of the isolation of lesions from fresh brain tissue of Pdgfbret/ret mice using fluorescent stereomicroscope microdissection (left side) (n = 1), and from paraffin embedded tissue with laser capture microdissection (LCM), right side (n = 3). The number of detected proteins in neuropil and calcifications is depicted in the upper Venn diagrams (red and yellow respectively). The lower Venn diagram illustrates the high overlap of proteins that were detected in calcifications using both techniques. Of these 93 proteins, 10 were found to be exclusively present in calcifications.
Next, we performed a more accurate method of sample isolation, namely laser capture microdissection (LCM). We isolated nodules from Pdgfbret/ret mouse brain cryosections and used again a similar‐sized area of surrounding neuropil as control. Extraction of proteins from such small amounts of calcified material proved to be challenging with existing protocols, and a new method for demineralization was developed (see material and methods). After demineralization, we detected 112 proteins, of which 66 were found only in the nodules (Supplementary Table S3). Comparing the two different methods revealed that 93 proteins were detected using both microdissection and LCM. Finally, of these 93 proteins, 10 were detected exclusively in the calcified nodules (Table 1). Three of the 10 proteins have previously been associated with regulation of bone mineralization: fetuin A (alpha 2‐Heremans schmid glycoprotein, AHSG), matrix gla protein (MGP) and osteopontin (OPN). Intriguingly, OPN, AHSG and MGP have all been shown to inhibit bone formation 6, 13, 24. Three other proteins play roles in nervous system and neuronal development, as well as in neuronal synapse activity, namely amyloid precursor protein (APP), amyloid precursor‐like protein 2 (APLP2) and the neurosecretory protein VGF (VGF) 2, 44. Secretogranin‐1 (CHGB) and chromogranin A (CHGA), believed to have hormonal activity, are found as the major components of secretory granules in endocrine and neuroendocrine cells 11. Sparc‐like 1 (SPARCL1) is a constituent of the extracellular matrix, a secreted calcium‐binding phosphoprotein and the evolutionary ancestor of proteins involved in tissue mineralization in tetrapods 16. Like SPARCL1, MGP also possesses calcium‐binding activity 11, 35. Lastly, cathepsin Z (CTSZ) belongs to the family of cysteine cathepsins and is a lysosomal proteinase 36.
Table 1.
Overview of the detected proteins in calcified nodules. The selective presence of peptides uniquely identified in calcified nodules obtained by regular microdiessection and laser capture microdiessection (LCM).
| Uniprot ID | Ensembl ID | Protein names | Gene names |
|---|---|---|---|
| P12023‐2 | ENSMUSG00000022892 | Amyloid beta A4 protein | App |
| P16014 | ENSMUSG00000027350 | Secretogranin‐1 | Chgb |
| Q06335 | ENSMUSG00000031996 | Amyloid‐like protein 2 | Aplp2 |
| P70663 | ENSMUSG00000029309 | SPARC‐like protein 1 | Sparcl1 |
| P26339 | ENSMUSG00000021194 | Chromogranin‐A | Chga |
| Q0VGU4 | ENSMUSG00000037428 | Vgf | Vgf |
| P10923 | ENSMUSG00000029304 | Osteopontin | Spp1 |
| P29699 | ENSMUSG00000022868 | Alpha‐2‐HS‐glycoprotein | Ahsg |
| P19788 | ENSMUSG00000030218 | Matrix Gla protein | Mgp |
| Q9WUU7 | ENSMUSG00000016256 | Cathepsin Z | Ctsz |
Calcifications in Pdgfb ret/ret and Slc20a2 −/− have similar protein content but distinct morphology
After elucidation of the protein composition of the calcified nodules, we verified the protein composition of nodules in adult brain tissue sections from Pdgfbret/ret mice using immunofluorescence (IF) and confocal imaging. While antibodies against APP, APLP2, SPARCL1, OPN, VGF and CHGA specifically labeled calcifications, MGP and CTSZ could not be detected in the calcifications using our tested antibodies (Figure 3A,B). The reason for this is unclear but may have to do with the availability of antigenic determinants in the nodular matrix. We could not verify the presence of CHGB or AHSG using our tested antibodies, neither in the calcifications, nor in any specific cell type in the adult mouse brain.
Figure 3.
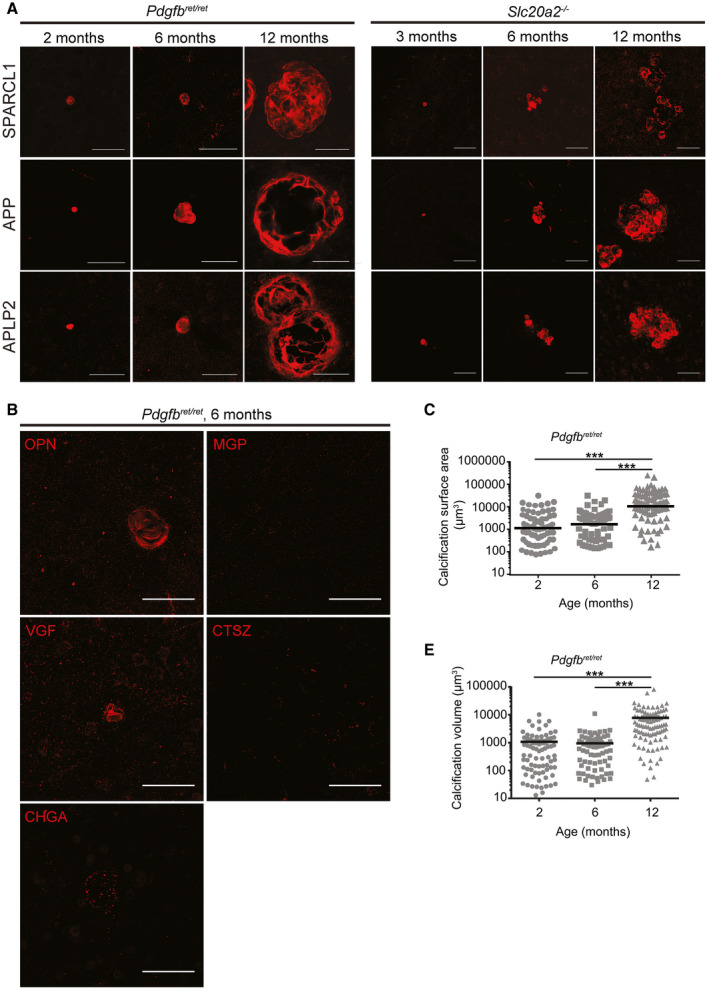
Calcifications in Pdgfbret/ret and Slc20a2−/− mice grow in size and number with age and are composed of both pro‐ and anti‐osteogenic proteins. Representative images of immunohistochemical verification of the proteomic analysis in Pdgfbret/ret and Slc20a2 −/− using antibodies targeting SPARCL1, APP and APLP2 (A). B. Weak (OPN, CHGA, VGF) or negative (CTSZ and MGP) immunostaining in Pdgfbret/ret with antibodies targeting enriched proteins in calcifications with proteomics. Scale bars, 50 µm. C. Measurements of the calcification surface area and volume (D) in 2‐ (n = 4), 6‐ (n = 3) and 12‐month‐old (n = 3) Pdgfbret/ret mice. A one‐way ANOVA with Bonferroni correction for multiple comparisons demonstrates statistically significant difference between 6 and 12 months analyzed mice (***P < 0.001).
Because visualization of the nodules was made possible by IF staining of some of their constituent proteins, we compared the morphology, composition, cellular association and growth of the calcifications between Pdgfbret/ret and Slc20a2 −/− mice. In both models, the nodules increased in both number and size over time (Figure 3A,C,D and 4A). By IF, we also concluded that they share a similar protein composition, i.e. they stained positively and with similar intensity using the same antibodies (Figure 3A). Moreover, by TEM analysis, nodules in Slc20a2 −/− mice were found to display a multi‐layered structure similar to that observed in Pdgfbret/ret nodules (Figure 4C). However, whereas Pdgfbret/ret mice showed solitary large calcifications concentrated to the dorsal pons, thalamus, hypothalamus and midbrain, the nodules in Slc20a2 −/− mice were generally smaller, more evenly spread throughout the deeper brain regions and were also occasionally found in the cortex, cerebellum and hippocampus (Figure 4A,B). In addition, the nodules in Slc20a2 −/− mice displayed a multi‐lobulated mulberry‐like morphology, as opposed to the round pearl‐like shapes of Pdgfbret/ret nodules (Figure 3A and 4A,C–D). While the occurrence of brain calcifications has previously been reported in heterozygous Slc20a2 knockouts (Slc20a2 +/−) 40, we were not able to detect nodules in Slc20a2 +/− mice. The reason for this is unclear, but similarly we have failed to detect calcifications in mice heterozygous for Pdgfbret, or heterozygous for Pdgfb or Pdgfrb knockout alleles 39 (and data not shown).
Figure 4.
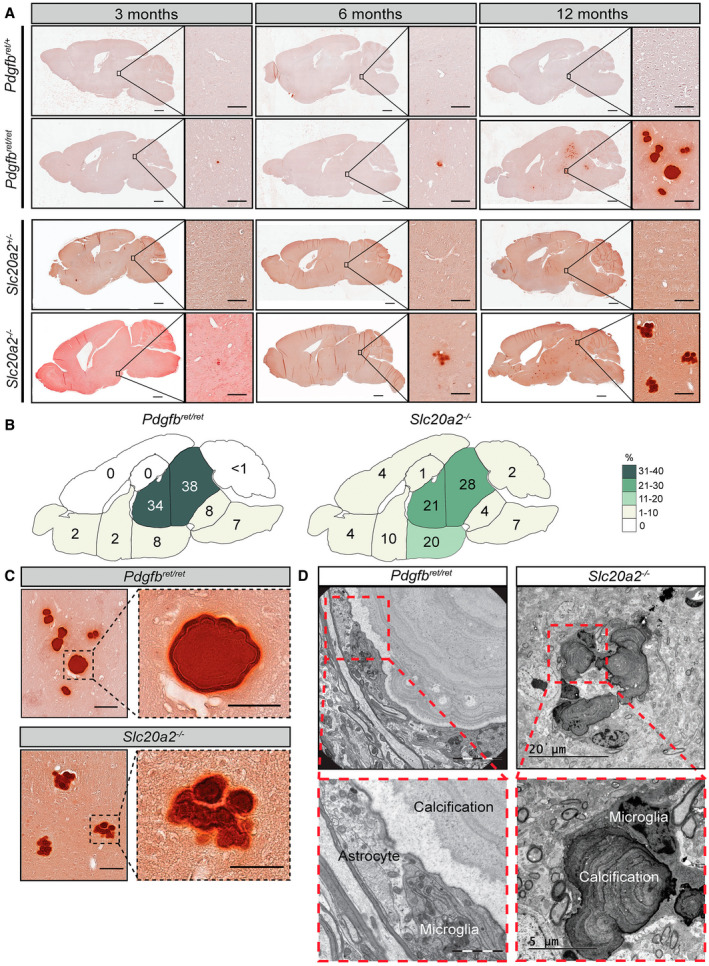
Nodules found in Pdgfbret/ret and Slc20a2−/− mice differ in anatomical location and morphology. A. Representative images of Alizarin red stainings performed on sections from 3‐, 6‐ and 12‐month‐old Pdgfbret/ret and Slc20a2 −/− demonstrate the increase in both size and number of the nodules in both models. Calcifications were absent in Pdgfbret/+ and Slc20a2 +/− controls. Scale bars, 1000 µm in overview pictures and 100 µm in higher magnification. B. Distribution of nodules in different brain regions in 3‐, 6‐ and 12‐ ‐month‐old Pdgfbret/ret (n = 9) and Slc20a2 −/− (n = 6). The numbers are displayed as the percentage of nodules found in each area compared to the total number of nodules found for all time points. C. High magnification views from 12‐month‐old Pdgfbret/ret and Slc20a2 −/− showing the difference in morphology. Scale bars, 100 µm in overview pictures and 50 µm in higher magnification. D. Representative images of the close association between astrocytes and microglia to calcified nodules detected in a 5‐month‐old Pdgfbret/ret (n = 1) and 6‐month‐old Slc20a2 −/− mice visualized with EM (n = 2).
Astrocytes and microglia/macrophages are apposed to the calcified nodules
As shown, TEM analysis indicates that the calcified nodules are in direct contact with cells displaying ultrastructural signs of astrocytes and microglial/macrophage cells (Figure 1D–G and 1, 4D). To confirm that the nodules were indeed in contact by these two cell types, we made IF stainings on tissue sections from Slc20a2 −/− and Pdgfbret/ret mice using antibodies against astrocytes (glial fibrillary acidic protein (GFAP)) and microglia (allograft inflammatory factor 1 (IBA1)). Note that IBA1 antibodies recognize both microglia and macrophages. These analyses confirmed the tight apposition of calcifications with astrocytes and microglia and further showed that the same nodule displayed an alternating contact with the two cell types, such that part of its surface was contacting one or more microglial cells, and part of the surface contacted one or more astrocytes (Figure 5). All nodules analyzed in this way displayed contact with both cell types, and together, the astrocyte and microglial contacts encompassed most or all of the nodular circumference (Figure 5A–E and Supplementary Videos S1 and S2). IF analysis also showed that the nodules in both mouse models were tangentially apposed to blood vessels at 2 and 12 months of age (Figure 6A–C and Supplementary Video S2). Interestingly, we also noted that in Pdgfbret/ret mice, calcifications were often associated with pericyte‐covered capillaries, despite the general reduction in vessel pericyte coverage in this mouse model 4 (Figure 6A).
Figure 6.
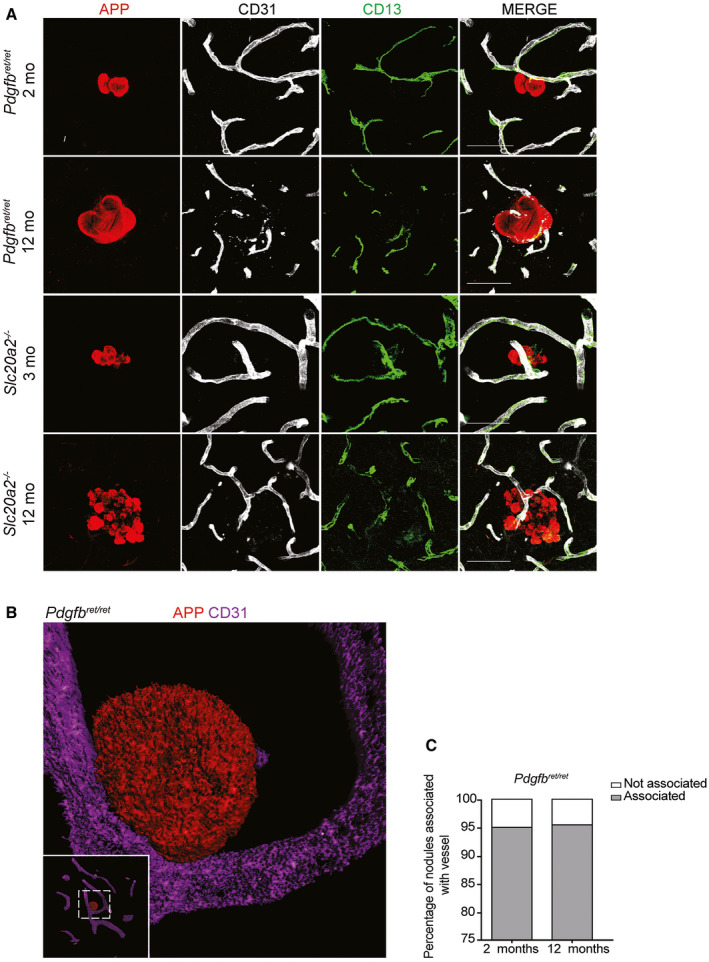
Nodules in Pdgfbret/ret and Slc20a2−/− are confirmed to be vessel associated. A. Small vessel association of calcifications in Pdgfbret/ret and Slc20a2 −/− mice verified by co‐immunolabeling with APP, CD13 and CD31 on vibratome sections. Scale bars, 50 µm. B. Volumetric 3D rendering of a calcification in Pdgfbret/ret (red) attached to a CD31‐positive vessel (purple). C. Percentage of calcifications associated with vessels in deeper brain regions in 2‐ (n = 4) and 12‐month‐old (n = 3) Pdgfbret/ret mice.
Slc20a2−/− mice show normal pericyte coverage and blood–brain barrier disruption permeability
A hallmark of Pdgfbret/ret mice is their reduced pericyte coverage and prominent BBB permeability through widespread endothelial transcytosis. We have previously suggested that these features may trigger brain calcification in this mouse model, as well as in human PFBC 4, 17. We therefore asked if pericyte coverage and BBB function was abnormal also in Slc20a2 −/− mice. We found that the Slc20a2 −/− mice had a normal pericyte coverage at both 3 and 12 months of age in the cortex as well as in deeper brain regions, i.e. sites affected by brain calcification in this model (Figure 7A–C). Also, the BBB of the Slc20a2 −/− mice did not display a general increase in permeability, as assessed by circulation of 1 kDa Alexa Fluor 555 cadaverine, a dye that strongly extravasates from the blood into the entire brain in Pdgfbret/ret mice (Figure 7D).
Figure 7.
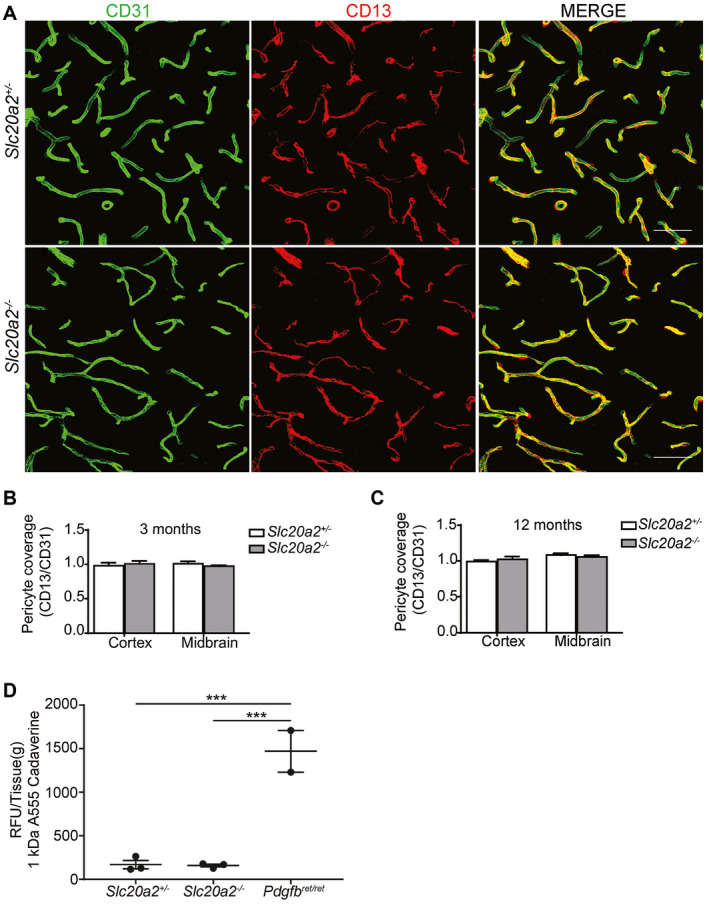
Assessment of pericyte coverage and blood–brain barrier integrity in Slc20a2−/− . A. Representative images from hypothalamus of 3‐month‐old Slc20a2 +/− and Slc20a2 −/− mice. Co‐immunolabeling with CD31 and CD13 was performed on 50 µm thick sagittal vibratome sections. Scale bars, 50 µm. B, C. The capillary surface coverage ratio in 3‐ and 12‐month‐old Slc20a2 +/− mice compared to Slc20a2 −/− (n = 4). Two‐tailed Student’s t‐test demonstrates no statistically significant difference between the different genotypes or different regions within the same genotype. D. 1 kDa Alexa Flour 555 conjugated cadaverine (25 µg/g body weight) was injected into the tail vein to assess for blood–brain barrier integrity. The relative fluorescence unit per gram of tissue (RFU/Tissue [g]) was measured in brain homogenate of 3‐month‐old Slc20a2 +/−, Pdgfbret/ret and Slc20a2 −/− (n = 3). A one‐way ANOVA with Bonferroni correction for multiple comparisons indicates statistical significance (***P < 0.001).
Multiple cellular sources of nodular matrix proteins
In order to get an indication of the cellular origin(s) of the protein constituents of the calcifications and to explore the potential role they play in the inception of the disease, we explored two mouse brain single‐cell sequencing databases. First, we investigated specific expression of the genes in the cells comprising or associated with the BBB 38. Next, we investigated the whole brain dataset from Zeisel et al 47 to get a broad overview of gene expression also in non‐vascular cell types in the brain.
By single‐cell RNA sequencing, App and Aplp2 expressions were observed in all cell types of the BBB (Figure 8A), with the highest expression in neurons (Figure 8B). Similarly, Sparcl1 was expressed by almost all cells of the brain, with the highest expression in astrocytes (Figure 8A,B). Considering the close apposition between astrocytes and calcified nodules, this may suggest that astrocytes are the main source of the SPARCL1 protein deposited into the nodules. Conversely, Ctsz is also expressed by almost all cell types, but most prominently by microglia, the second cell type apposing the calcified nodules (Figure 8A,B), suggesting a microglial origin of CTSZ protein in the nodules. As these proteins were produced by almost all cell types of the brain, we investigated if regional difference in expression might explain the occurrence of calcifications predominantly in the deeper brain regions of Pdgfbret/ret mice. We extracted microvascular fragments of the cortex and deeper brain regions and compared expression levels of App, Aplp2 and Sparcl1. Interestingly, the level of Sparcl1 mRNA was higher in the deeper brain regions compared to cortex, with a tendency for the highest production in Pdgfbret/ret mice (Figure 8C).
Figure 8.
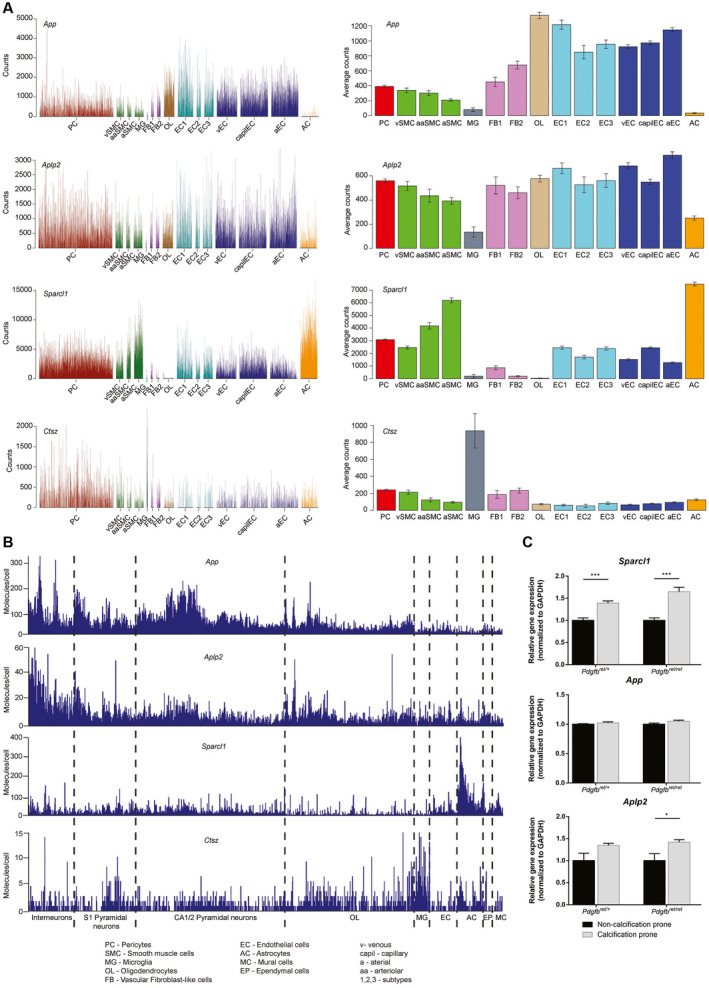
App, Aplp2, Sparcl1 and Ctsz are common components of the brain extracellular matrix. Broad expression of App, Aplp2, Sparcl1 and Ctsz can be detected in different cells of (A) the blood–brain barrier (http://betsholtzlab.org/VascularSingleCells/database.html) and (B) the whole brain (http://linnarssonlab.org/cortex/). Every spike represents the expression level in an individual cell. C. qPCR for the expression of App, Aplp2 and Sparcl1 in microvascular fragments of calcification prone and non‐calcification prone regions of Pdgfbret/+ and Pdgfbret/ret mice. A two‐tailed Student’s t‐test indicates significant differences (*P < 0.05, ***P < 0.001).
Ahsg, Chga, Chgb and Vgf were not produced by the BBB cells (Figure 9A), but Chga, Chgb and Vgf were prominently expressed by neurons (Figure 9B), suggesting that these proteins may passively adhere to and become integrated with the growing nodules, rather than being actively deposited by the nodule‐associated cells. Ahsg could not be detected in the whole brain dataset, most likely due to rare expression of the gene or insufficient detection sensitivity of the single‐cell technology used. Alternatively, it is produced in the periphery and gets incorporated into the nodules following BBB passage.
Figure 9.
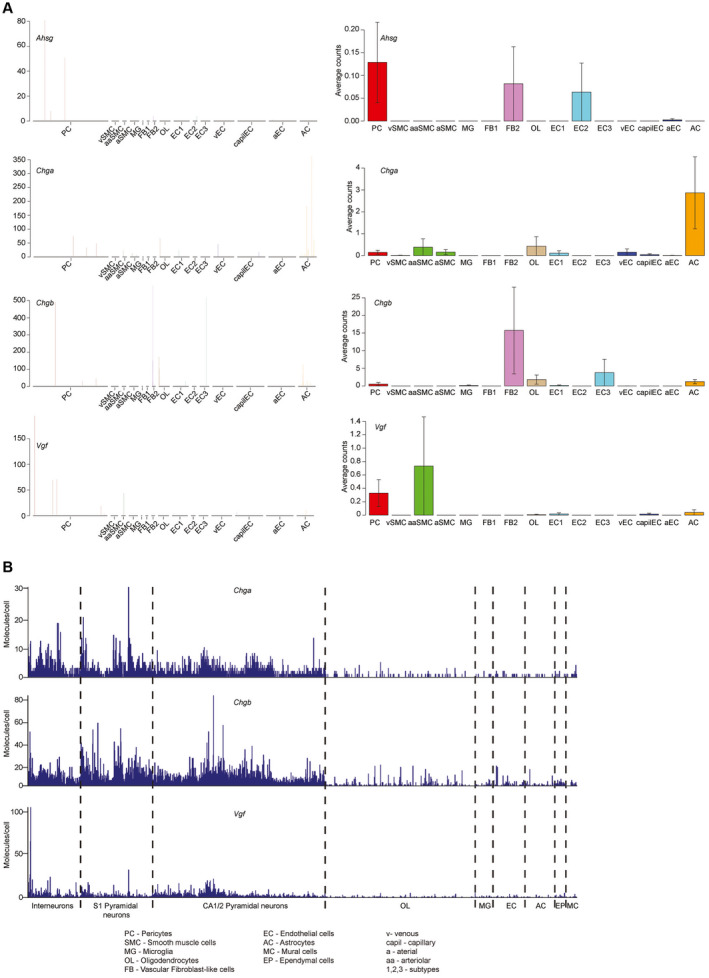
Ahsg, Chga, Chgb and Vgf are not expressed by blood–brain barrier cells. A. Single cell expression of Ahsg, Chga, Chgb and Vgf in the cells of the blood–brain barrier. Except for an occasional expression of Chga in astrocytes, no expression of the four aforementioned genes could be detected. B. In the whole‐brain single‐cell dataset, expression of Chga, Chgb and Vgf was mostly restricted to the neurons. Expression of Ahsg could not be detected.
Interestingly, both Spp1 and Mgp have a very specific expression profile in the brain vasculature. A subset of pericytes and fibroblast‐like cells express Spp1, (Figure 10A), whereas no other cell types express Spp1 in the brain (Figure 10B). Expression of Mgp is slightly broader, with the strongest expression in the fibroblast‐like cells and minor but detectable expression in the largest arterial endothelial cells and mural cells (Figure 10A). In addition, we could observe an inverse correlation between expression of Spp1 and Mgp in perivascular fibroblast‐like cells (Figure 10C), suggesting alternating pro and anti‐calcification processes in these cells. Finally, we were able to match the expression profiles of Sparcl1, Mgp and Ctsz with the corresponding cellular expression in the tissue using antibodies (Figure 10D). SPARCL1 was confirmed to be highly expressed by GFAP‐positive astrocytes while MGP co‐localized with PDGFRA‐positive perivascular fibroblasts and CTSZ with IBA1‐positive microglia.
Figure 10.
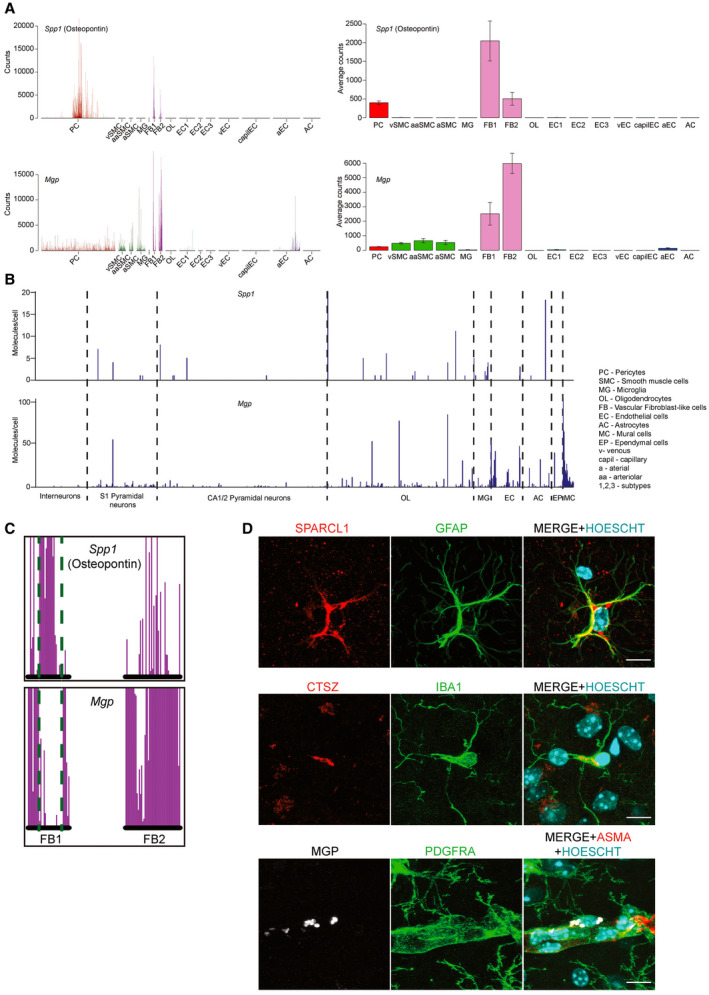
Spp1 and Mgp are selectively expressed in specific cell types of the blood–brain barrier. A. Spp1 is only expressed in a subpopulation of pericytes, as well as the fibroblast‐like cells. Mgp displays low expression in all mural cells and the largest arterial endothelial cells, but high expression in the fibroblast‐like cells. B. No selective Spp1 expression can be detected in the whole‐brain dataset, but Mgp is highest in the mural cell group and a subset of endothelial cells. C. Detailed close‐up of the two fibroblast‐like cell types indicate an inverse correlation between expression of Spp1 and Mgp. Green dotted lines are a visual aid to appreciate the location of the cells on the X‐axis. Note that the postion of all cells in the single‐cell database are fixed on the X‐axis, allowing comparison of gene expression on a cell‐to‐cell basis. D. Confocal images confirming the expression of SPARCL1 in GFAP‐positive astrocytes, MGP in PDGFRA‐positive perivascular fibroblast and CTSZ in IBA1‐positive microglia in 12‐month‐old Pdgfbret/+ animal. Staining for ASMA was used to pinpoint the perivascular localization of the PDGFRA‐positive cells to arteries. HOECHST was used to visualize the individual nuclei of the cells. Scale bars, 10 µm.
Taken together, these data suggest that several different cell types contribute protein components to the calcified nodules in mouse PFBC models. It is important to remember, however, that the mRNA expression profiles analyzed above were derived from normal healthy adult mice and that expression profiles in Scl20a2 −/− and Pdgfbret/ret mice might differ from the normal.
Astrocytes are the common expression site for cell autonomously acting PFBC genes
The similarity in nodular protein composition and the fact that activated astrocytes and microglia adhere to the calcified nodules in both Slc20a2 −/− and Pdgfbret/ret mice suggest common pathogenic mechanism, likely involving a perturbation of a common cell type. Since Slc20a2 −/− mice displayed normal pericyte abundance and microvascular morphology, as well as a generally intact BBB, we looked for a common site of expression of known PFBC genes among all vascular and vessel‐associated cell types. Utilizing our recently published single‐cell RNA sequencing resource 38, we found that the only cell type expressing all four PFBC genes with assumed cell‐autonomous action (Slc20a2, Xpr1, Pdgfrb and Myorg) was astrocytes (Figure 11). The common expression in astrocytes therefore suggests a critical involvement of this cell type in PFBC pathogenesis.
Figure 11.
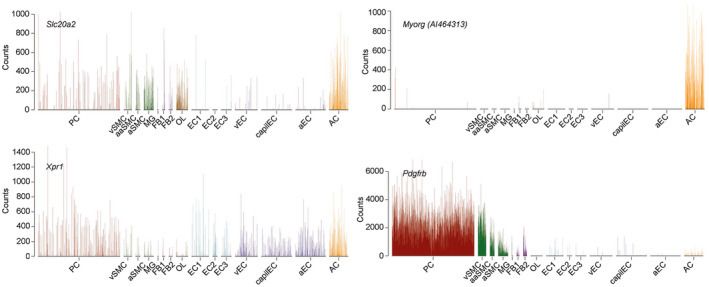
Astrocytes are the common expression site for cell autonomously acting PFBC genes. Single‐cell expression of Slc20a2, Myorg (also called AI464313), Xpr1 and Pdgfrb. Note that Pdgfrb is also expressed in astrocytes, yet to a lower level as compared to its expression in pericytes.
Discussion
An intriguing feature of PFBC is that calcium phosphate deposition occurs around microvessels, hence distinguishing the pathogenesis of PFBC from that of atherosclerosis, which leads to calcification primarily of large arteries 27, 28. Another important feature of PFBC is the specific mineralization of brain microvessels, and the preference for deep brain regions. Mutations in SLC20A2 42, PDGFB 17, PDGFRβ 29, XPR1 20 and MYORG 45 are thought to be causative for most PFBC cases with a clear family history, and therefore we reasoned that genetic animal models might provide insight into the pathogenesis. In the present investigation, we utilized two such models, both previously shown to recapitulate human PFBC with regard to the formation of vascular calcification in the deep brain regions 14, 17. Pdgfbret/ret and Slc20a2 −/− mice develop brain calcifications that expand in both size and number with age. We made an in‐depth comparison between the two models and unveiled new insights into the ultrastructure, protein composition and cell type association of the calcified nodules, thereby providing novel insights into the pathophysiology of PFBC.
Previously reported anatomical locations of the calcifications and their age‐dependent growth in size and number 14, 15, 17 were largely confirmed in our present study. However, unlike a previous study 40, we did not detect any calcifications in Slc20a2‐/+ heterozygous mice. These might indeed be very rare events 15, and the detection of calcified lesions in Slc20a2‐/+ mice by Wallingford et al is likely due to different levels of backcrossing of the mouse strain.
Intriguingly, we found differences between Pdgfbret/ret and Slc20a2 −/− mice concerning lesion ultrastructure and location. While Pdgfbret/ret nodules were spherical and smooth surfaced to the most extent (although they occasionally also display rugged surfaces, as pointed out above), grow individually and were concentrated to the thalamus, pons and midbrain even at advanced age, the nodules in Slc20a2 −/− mice were mulberry shaped and present throughout the brain, albeit with a preference for the deeper brain regions. As Pdgfb is also expressed in brain regions that do not present calcifications (e.g. cortex) 47 (http://linnarssonlab.org/cortex/), the observed difference in anatomical location is most likely not due to focused expression of Pdgfb in different brain regions. Local differences in susceptibly to mineral deposition may explain the disparity in distribution of calcifications between the two models.
Using LC‐MS/MS, we identified several proteins to be highly enriched in the calcifications of Pdgfbret/ret mice. Astonishingly, the most abundant proteins in the nodules are known to play roles in bone formation and ectopic tissue mineralization, including both proteins that have been proposed to promote (SPARCL1) and inhibit (OPN, MGP and AHSG) tissue mineralization. The involvement of both types of proteins is perhaps not entirely unexpected, since both functions are required for bone remodeling. This remodeling process bears resemblance with inflammation/tissue repair in the sense that a balance of opposing mechanisms is observed 32. For example, SPARCL1 is expressed in bone structures 8, whereas OPN, MGP protein and AHSG are recruited as inhibitors of mineralization 24, 33. Also, the occurrence of SPARCL1 in the nodules is noteworthy, since SPARCL1 is an ancestral mineralization protein. However, SPARCL1 is abundantly expressed in the brain 34 and in particular by astrocytes 5 and its accumulation may reflect a natural reaction, or protection, against an ectopic process or structure. A similar reaction may explain the enrichment of APP and APLP2 in the calcifications. APP and APLP2 are members of the APP family of proteins, where APP is central in Alzheimer’s disease where it is the precursor protein for the amyloid beta peptides. Some studies suggest that the role of native APP and its gene family members are crucial for the formation, maintenance and plasticity of synapses in the CNS 23, 44.
The Pdgfb and Pdgfrb encoded proteins PDGF‐B and PDGF‐Rβ have previously been show to play critical roles in pericyte recruitment to the brain microvasculature 1, 12, 21. Pericytes, in turn, have been demonstrated to play important roles in the development and maintenance of the BBB 4. By studying different Pdgfb mouse mutants with different degrees of pericyte loss and BBB disruption, we also found a good correlation with the severity of the PFBC phenotype 17. However, subsequent studies of different brain regions in Pdgfbret/ret showed an opposite correlation: the mineralization‐prone deep brain regions had higher pericyte densities and less BBB disruption compared with the cerebral cortex, which lacked mineralized lesions 39. Our present analysis of Slc20a2 −/− mice confirms that these mice do not present pericyte loss and they do not have increased general permeability of low‐molecular weight tracers. In spite of these differences, the two mouse models do share fundamental similarities. The nodules display a multilayer structure and the presence of certain specifically enriched proteins in the nodules were found in both Pdgfbret/ret and Slc20a2 −/−. Moreover, the close interaction with astrocytes, microglia and vasculature to calcifications was consistently observed. Astrocyte–microglial reactivity around calcifications also occurs in PFBC patients 28, and the relation between the nodules and astrocytes has been described in mice 15, 46. Concomitantly, we demonstrate here that microglial reactivity also occurs in both mouse models, strengthening their role as a model for PFBC. Although we currently have no evidence that these cells are causative for the calcification forming process, we hypothesize that these cells may be involved in the deposition and breakdown of the calcified nodules similar to how osteoblasts and osteoclasts balance the turnover of bone matrix. In addition, Zarb et al recently showed that the astrocytes in apposition to the calcification are reactive 46. The observation that astrocytes is the only cell type that expresses all four cell‐autonomously acting genes, Slc20a2, Pdgfrb, Xpr1 and Myorg, points to a central role for these cells in the capillary calcification that occurs in PFBC.
Material and Methods
Ethics statement
The present study was conducted in agreement with the recommendations from the Swedish Ethical Committee on Animal Research and was approved by the Uppsala Ethical Committee on Animal Research (permit number: C224/12 and C115/15). All efforts were made to minimize suffering of the animals and both males and females were used in this study.
Transgenic mice
The generation of Pdgfbret/ret mice has been described previously 22. Transgenic Slc20a2tm1a ‐ (EUCOMM)Wtsi) were obtained from the European Mouse Mutant Archive (EMMA, Germany). For all experiments, full knockouts mice of either sex were analyzed at appropriate time points and heterozygote littermates were used as controls.
Histology
For histological stainings, anesthetized mice were perfused with HBSS, fixed with 4% paraformaldehyde and then postfixed at 4°C in 4% paraformaldehyde for 4 h. Sagitally devided brain halves were embedded in paraffin and all histological alizarin red stainings were performed on 10 µm thick sections at the Clinical Pathology at Academic Hospital, Uppsala in accordance with previously described procedures 17.
Electron microscopy
For electron microscopy (EM), 5‐ (n = 1, male) and 9‐month‐old (n = 1, male) Pdgfbret/ret and 6‐month‐old (n = 2, male and female) Slc20a2 −/− mice were perfused with Hanks’ Balanced Salt solution (HBSS, Sigma Aldrich) and then fixed with 3% formaldehyde and 0.5% glutaraldehyde in 0.1 M sodium cacodylate buffer (pH 7.2). The brains were postfixed in 3% paraformaldehyde and 2.5% glutaraldehyde in 0.1 M sodium cacodylate buffer (pH 7.2) for 3 h in 4°C and stored in 0.15 M cacodylate buffer (pH 7.2). The samples were cut into 1 mm parasagittal slices and subsequently 1–2 mm2 large cubic fragments from areas of interest under the stereomicroscope prior to examination with EM. After osmication and en bloc uranyl acetate treatment, tissue blocks were dehydrated and embedded in epoxy resin. Sections were cut with a diamond knife on a Leica EM UC7 ultramicrotome (Leica Microsystems) at 60 nm thickness setting and were examined without additional contrasting in a LEO 912AB energy‐filtered TEM (Carl Zeiss SMT AG). Digital images were captured with a MegaView III camera (Olympus SiS).
Protein sample preparation and mass spectrometry
Calcified nodules from Pdgfbret/ret mice were isolated using two different methods. First, laser capture microdissection (LCM) was used to isolate sections of nodules from brain cryosections (n = 3). Non‐calcified neighboring stromal tissue was used as control. Note that we also attempted to isolate microvasculature samples in these experiments, but were unable to obtain sufficient amount of material for this study. Second, nodules were isolated by manual microdissection under a stereomicroscope (n = 1). Aided by the inherent autofluorescence of nodules, the tissue was excited at 488 nm and visualized in the green spectrum. After isolation, samples were transferred into 10% acetic acid and incubated over night at +4°C for complete demineralization (modified from previously described method 25. Solubilized proteins were precipitated by 4 volumes of acetone at −20°C for 1 h, pelleted at 14 000 × g for 10 minutes, dried and dissolved in urea buffer (6 M urea, 2 M thiourea, 10 mM HEPES, pH 8.0). Enzymatic fragmentation of proteins was performed by in‐solution digestion 3. In brief, protein disulfide bonds were reduced with 10 mM dithiothreitol and alkylated with 55 mM iodoacetamide. Next, proteins were cleaved enzymatically by Lys‐C (protein‐to‐enzyme ratio 100:1) (Wako Chemicals GmbH, Neuss, Germany) at room temperature for 3 h followed by trypsin treatment (protein‐to‐enzyme ratio 100:1) (Promega Corporation, Madison, WI) at room temperature overnight. Resulting mixture of peptides were desalted and concentrated by stop and go extraction (STAGE) tips 31. LC‐MS/MS and data analysis was performed as already described 37. Briefly, peptides were separated by reverse‐phase chromatography using an UHPLC (EASY‐nLC 1000, ThermoFisher Scientific) coupled in line to a QExactive Plus orbitrap mass spectrometer (Thermo Fisher Scientific) using an electrospray ionization source. Peptides separation occurred by pre‐column (100 µm ID, 5 µm C18‐beads) and analytical columns (75 µm ID, 3 µm C18‐beads) (Thermo Fisher Scientific) using a linear gradient from 4% to 48% acetonitril with 0.1% formic acid for 138 minutes at a flow rate of 250 nL/min, followed by 75% acetonitril for 6 minutes and 4% acetonitril for 6 minutes for re‐equilibration. Positive ion MS spectra (m/z = 400–1750) were acquired using an automatic gain control (AGC) target of 3E6 at a resolution of 70 000. The ten most intense peaks were isolated for higher energy collisional dissociation (HCD) fragmentation (25% normalized collision energy) and MS/MS spectra were generated with an AGC target of 5E5 at a resolution of 17 500. Mass spectrometer worked in data‐dependent mode.
MS raw data were processed by MaxQuant (1.5.0.25) 9 using the Uniprot human database (release 2014‐07). The following parameters were used for data processing: Maximum of two miss cleavages, mass tolerance of 4.5 ppm for main search, trypsin as digesting enzyme, carbamidomethylation of cysteins as fixed modification, oxidation of methionine and acetylation of the protein N‐terminus as variable modifications. Peptides with a minimum of seven amino acids and at least one unique peptide were required for protein identification. Only proteins with at least two peptides and at least one unique peptide were considered as identified and used for further data analysis.
Immunohistochemistry on vibratome sections
For immunohistochemical (IHC) analyses, anesthetized mice were perfused with HBSS, fixed with 4% paraformaldehyde and then postfixed at 4°C in 4% paraformaldehyde for 4 h. Fifty micrometers brain sagittal vibratome sections were incubated at 4°C in blocking/permeabilizing solution (1% bovine serum albumin, 0.5% TritonX‐100 in PBS) for 24 h. Primary antibodies diluted in 0.25% TritonX‐100 PBS were incubated for 48 h at 4°C. The sections were washed in 0.25% TritonX‐100 PBS and incubated in secondary antibodies diluted in 0.25% TritonX‐100 PBS for 24 h at 4°C. After washing with 0.25% TritonX‐100 PBS and PBS, samples were mounted in Prolong Gold antifade reagent (Life Technologies). Primary antibodies used for immunostainings can be found in Supplementary Table S4. All sections were analyzed using a Leica TCS SP8 Confocal Microscope (Leica Microsystems). Images were processed by Fiji (ImageJ2) and Adobe Illustrator CS6 and 2D maximum intensity projections of ~30–50 μm z‐stacks were analyzed for quantification.
Tracer experiments
For BBB integrity analysis, 1 kDa Alexa Flour‐555 conjugated cadaverine (25 µg/g body weight) was injected into the tail vein 2 h prior to sacrificing the mice as previously described 4. Briefly, the animals were anesthetized, transcardially perfused for 4 minutes with HBSS and brain and kidney were collected. Half of the cerebrum and one kidney were homogenized in 1% Triton X‐100/PBS (pH 7.2) and the lysates were centrifuged at 14 000 rpm at 4°C for 20 minutes. The relative fluorescence of the supernatant was measured using a Synergy HT microplate reader (BioTek) with the following settings: 540/25 nm for excitation and 590/20 nm for emission. Kidneys were used as controls to ensure the systematic distribution of the injected tracer. Results were expressed as relative fluorescent units normalized to tissue weight (RFU/g).
Measurement of nodule size and association with vessel and astrocytes/microglia
For calcification measurements (surface area and volume) and analysis of nodule association with vessel or astrocytes/microglia, pictures from midbrain and thalamus were acquired from 8–14 fields per animal. All nodules were measured and analyzed for cellular and vessel association in cases were several nodules were observed within the same field. Volumetric rendering and measurement of calcifications was done with Volocity v.6.31 (PerkinElmer) and Imaris ×64 8.3.1 (Bitplane, Belfast, UK). The total number of analysed nodules in Pdgfbret/ret mice (n ≥ 3 per age) were as follows: 2‐month old (n = 76), 6‐month old (n = 71) and 12‐month old (n = 89).
Quantification of pericyte coverage
Pericyte coverage was calculated with the AnalyzeSkeleton plugin in Fiji (https://fiji.sc/). Three‐dimensional confocal image stacks were projected with maximum intensity projection, contrast enhanced, de‐speckled, smoothened and a threshold was set for generating a binary image. These images were then subjected to “dilate” and “close” commands prior to running the AnalyzeSkeleton plugin. Total skeletal length was calculated for both anti‐CD31 stained images (all vessels) and anti‐CD13 stained images (pericyte covered vessels), and the ratio of vessel length was used as a measurement of coverage. All image processing was done automatically with a custom macro designed in Fiji.
Real‐time quantitative PCR (RT‐qPCR)
Brain vasculature was isolated with Dynabeads (Dynabeads® Sheep Anti‐Rat IgG, Thermofisher Scientific, cat# 11035) coupled to rat anti‐mouse CD31 (BD Pharmingen, cat# 553370). Total RNA was extracted from microvascular fragments from different mouse brains regions and DNase‐treated using the RNeasy Lipid Tissue Mini kit (Qiagen). cDNA was synthetized using the iScriptTM cDNA Synthesis Kit (Bio‐Rad). Real‐time quantitative PCR was performed on a CFX96 Touch RT‐PCR machine (Bio‐Rad) using TaqMan probes (Life Technologies). In all conditions, eukaryotic 18S rRNA (4319413E) was used as a reference gene for ΔΔCt calculations. The following TaqMan probes were used: Mouse Pdgfrb (Mm00435546_m1), mouse Sparcl1 (Mm00447784_m1), mouse App (qMmuCIP0033061) and mouse Aplp2 (qMmuCEP0041974). All RT‐PCR data are represented as the mean of three independent experiments.
Conflict of Interest
Michael Vanlandewijck and Christer Betsholtz are employed at the Integrated Cardio Metabolic Centre (KI), which is funded by AstraZeneca Ab. Christer Betsholtz is an advisor for AstraZeneca Ab. These affiliations do not pose any direct or indirect conflict of interest to the work described in this paper. All other authors declare no conflict of interest.
Supporting information
Table S1. Proteomic analysis of the calcified nodules. The first tab presents an overview of the detected proteins in each experimental setup, with the number of unique peptide matches for each detected protein. The second tab provides an overview of the detected proteins for each experimental sample. Calzi: Calcified nodule extracted via microdissection. Brain: Control brain parenchyma obtained via microdissection. The laser capture microdissection samples are coded with a number, followed by a letter and finally, a dash with a number. The first number represents the mouse used (biological replicate, n = 3). A = calcified nodule, B = control, C = microvascular fragment. ‐1: extraction without demineralization. ‐2: extraction with demineralization.
Table S2. Proteins detected exclusively in the calcifications after stereomicroscope microdissection.
Table S3. Proteins detected exclusively in the calcifications after laser capture microdissection.
Table S4. List of antibodies used for immunofluorescence stainings.
Movie S1 . Dynamic interaction of calcifications with GFAP‐positive reactive astrocyte and IBA1‐positive microglia. Animation of confocal z‐stacks showing the dynamic interaction of GFAP‐positive astrocyte and IBA1‐positive microglia to a lesion (labeled with anti‐SPARCL1 antibody) found in a 3‐month‐old Pdgfbret/ret mouse. SPARCL1, GFAP and IBA1 channels were combined and the animation was generated with LAS AF software (Leica Microsystems) and Fiji (https://fiji.sc/).
Movie S2 . Association of a nodule with astrocyte and microglia. Animation of volumetric 3D rendering of confocal z‐stacks illustrating a nodule tightly associated with astrocyte and microglia in a 3‐month‐old Pdgfbret/ret mouse. Co‐immunostaining of APP, GFAP and IBA1 was performed on 50 µm thick parasagittal vibratome sections and 2D projections of the three merged channels were acquired prior to subjection to 3D‐rendering. Calcification is seen in red, GFAP‐positive cells in green and IBA1‐positive cells in cyan.
Movie S3 . Association of a nodule to small vessels. Animation of volumetric 3D rendering of confocal z‐stacks computed in Volocity v.6.31 (PerkinElmer) depicting a nodule tightly associated with a capillary in a 3‐month‐old Pdgfbret/ret. Co‐immunostaining of APP, CD31 and CD13 was performed on 50 µm thick parasagittal vibratome sections and 2D projections of the three merged channels were acquired prior to subjection to 3D rendering. Calcification is seen in red and vessels in purple.
Acknowledgments
This study was supported by research grants from AstraZeneca AB through the ICMC (CB), the Swedish Research Council (CB, UL), the European Research Council (CB: AdG 294556 BBBARRIER), the Leducq Foundation (CB: transatlantic network 14CVD02 Sphingonet) Swedish Cancer Society (CB), Knut och Alice Wallenbergs Stiftelse (CB), Swiss National Science Foundation (YZ: 31003A_159514/1), the Synapsis Foundation (YZ), Forschungskredit und Stiftung für Forschung an der Medizinischen Fakultät der Universität Zürich (grant no. FK‐16‐034; YZ). We thank Cecilia Olsson, Jana Chmielniakova, Helene Leksell and Veronica Sundell for technical assistance.
Data Availability Statement
The data that support the findings of this study are available from the corresponding author upon reasonable request. The single‐cell data were extracted from the following resources available in the public domain: http://betsholtzlab.org/VascularSingleCells/database.html and http://linnarssonlab.org/cortex/.
References
- 1. Abramsson A, Kurup S, Busse M, Yamada S, Lindblom P, Schallmeiner E et al (2007) Defective N‐sulfation of heparan sulfate proteoglycans limits PDGF‐BB binding and pericyte recruitment in vascular development. Genes Dev 21:316–331. [DOI] [PMC free article] [PubMed] [Google Scholar]
- 2. Alder J, Thakker‐Varia S, Bangasser DA, Kuroiwa M, Plummer MR, Shors TJ, Black IB (2003) Brain‐derived neurotrophic factor‐induced gene expression reveals novel actions of VGF in hippocampal synaptic plasticity. J Neurosci 23:10800–10808. [DOI] [PMC free article] [PubMed] [Google Scholar]
- 3. Andersen JS, Lam YW, Leung AKL, Ong S‐E, Lyon CE, Lamond AI, Mann M (2005) Nucleolar proteome dynamics. Nature 433:77–83. [DOI] [PubMed] [Google Scholar]
- 4. Armulik A, Genové G, Mäe M, Nisancioglu MH, Wallgard E, Niaudet C et al (2010) Pericytes regulate the blood‐brain barrier. Nature 468:557–561. [DOI] [PubMed] [Google Scholar]
- 5. Blakely PK, Hussain S, Carlin LE, Irani DN (2015) Astrocyte matricellular proteins that control excitatory synaptogenesis are regulated by inflammatory cytokines and correlate with paralysis severity during experimental autoimmune encephalomyelitis. Front Neurosci 9:344. [DOI] [PMC free article] [PubMed] [Google Scholar]
- 6. Boskey AL, Spevak L, Paschalis E, Doty SB, McKee MD (2002) Osteopontin deficiency increases mineral content and mineral crystallinity in mouse bone. Calcif Tissue Int 71:145–154. [DOI] [PubMed] [Google Scholar]
- 7. Bowman MS (1954) Familial occurrence of idiopathic calcification of cerebral capillaries. Am J Pathol 30:87–97. [PMC free article] [PubMed] [Google Scholar]
- 8. Cowles EA, DeRome ME, Pastizzo G, Brailey LL, Gronowicz GA (1998) Mineralization and the expression of matrix proteins during in vivo bone development. Calcif Tissue Int 62:74–82. [DOI] [PubMed] [Google Scholar]
- 9. Cox J, Mann M (2008) MaxQuant enables high peptide identification rates, individualized p.p.b.‐range mass accuracies and proteome‐wide protein quantification. Nat Biotechnol 26:1367–1372. [DOI] [PubMed] [Google Scholar]
- 10. Eaton LM (1939) Symmetric cerebral calcification, particularly of the basal ganglia, demonstrable roentgenographically. Arch Neurol Psychiatry 41:921–942. [Google Scholar]
- 11. Feldman SA, Eiden LE (2003) The chromogranins: their roles in secretion from neuroendocrine cells and as markers for neuroendocrine neoplasia. Endocr Pathol 14:3–24. [DOI] [PubMed] [Google Scholar]
- 12. Hellström M, Kalén M, Lindahl P, Abramsson A, Betsholtz C (1999) Role of PDGF‐B and PDGFR‐beta in recruitment of vascular smooth muscle cells and pericytes during embryonic blood vessel formation in the mouse. Development 126:3047–3055. [DOI] [PubMed] [Google Scholar]
- 13. Jahnen‐Dechent W, Heiss A, Schäfer C, Ketteler M (2011) Fetuin‐A regulation of calcified matrix metabolism. Towler DA, ed. Circ Res 108:1494–1509. [DOI] [PubMed] [Google Scholar]
- 14. Jensen N, Schrøder HD, Hejbøl EK, Füchtbauer E‐M, de Oliveira JRM, Pedersen L (2013) Loss of function of Slc20a2 associated with familial idiopathic basal ganglia calcification in humans causes brain calcifications in mice. J Mol Neurosci 51:994–999. [DOI] [PMC free article] [PubMed] [Google Scholar]
- 15. Jensen N, Schrøder HD, Hejbøl EK, Thomsen JS, Brüel A, Larsen FT et al (2018) Mice knocked out for the primary brain calcification associated gene Slc20a2 show unimpaired pre‐natal survival but retarded growth and nodules in the brain that grow and calcify over time. Am J Pathol 188:1865–1881. [DOI] [PubMed] [Google Scholar]
- 16. Kawasaki K, Weiss KM (2006) Evolutionary genetics of vertebrate tissue mineralization: the origin and evolution of the secretory calcium‐binding phosphoprotein family. J Exp Zool B Mol Dev Evol 306:295–316. [DOI] [PubMed] [Google Scholar]
- 17. Keller A, Westenberger A, Sobrido MJ, García‐Murias M, Domingo A, Sears RL et al (2013) Mutations in the gene encoding PDGF‐B cause brain calcifications in humans and mice. Nat Genet 45:1077–1082. [DOI] [PubMed] [Google Scholar]
- 18. Kimura T, Miura T, Aoki K, Saito S, Hondo H, Konno T et al (2016) Familial idiopathic basal ganglia calcification: histopathologic features of an autopsied patient with an SLC20A2 mutation. Neuropathology 36:365–371. [DOI] [PubMed] [Google Scholar]
- 19. Kobari M, Nogawa S, Sugimoto Y, Fukuuchi Y (1997) Familial idiopathic brain calcification with autosomal dominant inheritance. Neurology 48:645–649. [DOI] [PubMed] [Google Scholar]
- 20. Legati A, Giovannini D, Nicolas G, López‐Sánchez U, Quintáns B, Oliveira JRM et al (2015) Mutations in XPR1 cause primary familial brain calcification associated with altered phosphate export. Nat Genet 47:579–581. [DOI] [PMC free article] [PubMed] [Google Scholar]
- 21. Lindahl P, Johansson BR, Levéen P, Betsholtz C (1997) Pericyte loss and microaneurysm formation in PDGF‐B‐deficient mice. Science 277:242–245. [DOI] [PubMed] [Google Scholar]
- 22. Lindblom P, Gerhardt H, Liebner S, Abramsson A, Enge M, Hellström M et al (2003) Endothelial PDGF‐B retention is required for proper investment of pericytes in the microvessel wall. Genes Dev 17:1835–1840. [DOI] [PMC free article] [PubMed] [Google Scholar]
- 23. Ludewig S, Korte M (2016) Novel insights into the physiological function of the APP (gene) family and its proteolytic fragments in synaptic plasticity. Front Mol Neurosci 9:161. [DOI] [PMC free article] [PubMed] [Google Scholar]
- 24. Luo G, Ducy P, McKee MD, Pinero GJ, Loyer E, Behringer RR, Karsenty G (1997) Spontaneous calcification of arteries and cartilage in mice lacking matrix GLA protein. Nature 386:78–81. [DOI] [PubMed] [Google Scholar]
- 25. Mann K, Mann M (2013) The proteome of the calcified layer organic matrix of turkey (Meleagris gallopavo) eggshell. Proteome Sci 11:40. [DOI] [PMC free article] [PubMed] [Google Scholar]
- 26. Manyam BV (2005) What is and what is not “Fahr's disease”. Parkinsonism Relat Disord 11:73–80. [DOI] [PubMed] [Google Scholar]
- 27. Manyam BV, Walters AS, Narla KR (2001) Bilateral striopallidodentate calcinosis: clinical characteristics of patients seen in a registry. Mov Disord 16:258–264. [DOI] [PubMed] [Google Scholar]
- 28. Miklossy J, Mackenzie IR, Dorovini‐Zis K, Calne DB, Wszolek ZK, Klegeris A, McGeer PL (2005) Severe vascular disturbance in a case of familial brain calcinosis. Acta Neuropathol 109:643–653. [DOI] [PubMed] [Google Scholar]
- 29. Nicolas G, Pottier C, Maltête D, Coutant S, Rovelet‐Lecrux A, Legallic S et al (2013) Mutation of the PDGFRB gene as a cause of idiopathic basal ganglia calcification. Neurology 80:181–187. [DOI] [PubMed] [Google Scholar]
- 30. Ostman A, Andersson M, Betsholtz C, Westermark B, Heldin CH (1991) Identification of a cell retention signal in the B‐chain of platelet‐derived growth factor and in the long splice version of the A‐chain. Cell Regul 2:503–512. [DOI] [PMC free article] [PubMed] [Google Scholar]
- 31. Rappsilber J, Ishihama Y, Mann M (2003) Stop and go extraction tips for matrix‐assisted laser desorption/ionization, nanoelectrospray, and LC/MS sample pretreatment in proteomics. Anal Chem 75:663–670. [DOI] [PubMed] [Google Scholar]
- 32. Rodan GA (1995) Osteopontin overview. Ann N Y Acad Sci 760:1–5. [DOI] [PubMed] [Google Scholar]
- 33. Schäfer C, Heiss A, Schwarz A, Westenfeld R, Ketteler M, Floege J et al (2003) The serum protein alpha 2‐Heremans‐Schmid glycoprotein/fetuin‐A is a systemically acting inhibitor of ectopic calcification. J Clin Invest 112:357–366. [DOI] [PMC free article] [PubMed] [Google Scholar]
- 34. Soderling JA, Reed MJ, Corsa A, Sage EH (1997) Cloning and expression of murine SC1, a gene product homologous to SPARC. J Histochem Cytochem 45:823–835. [DOI] [PubMed] [Google Scholar]
- 35. Sweatt A, Sane DC, Hutson SM, Wallin R (2003) Matrix Gla protein (MGP) and bone morphogenetic protein‐2 in aortic calcified lesions of aging rats. J Thromb Haemost 1:178–185. [DOI] [PubMed] [Google Scholar]
- 36. Turk V, Stoka V, Vasiljeva O, Renko M, Sun T, Turk B, Turk D (2012) Cysteine cathepsins: from structure, function and regulation to new frontiers. Biochim Biophys Acta 1824:68–88. [DOI] [PMC free article] [PubMed] [Google Scholar]
- 37. Uebbing S, Konzer A, Xu L, Backström N, Brunström B, Bergquist J, Ellegren H (2015) Quantitative mass spectrometry reveals partial translational regulation for dosage compensation in chicken. Mol Biol Evol 32:2716–2725. [DOI] [PMC free article] [PubMed] [Google Scholar]
- 38. Vanlandewijck M, He L, Mäe MA, Andrae J, Ando K, Del Gaudio F et al (2018) A molecular atlas of cell types and zonation in the brain vasculature. Nature 554:475–480. [DOI] [PubMed] [Google Scholar]
- 39. Vanlandewijck M, Lebouvier T, Andaloussi Mäe M, Nahar K, Hornemann S, Kenkel D et al (2015) Functional characterization of germline mutations in PDGFB and PDGFRB in primary familial brain calcification. Castro MG, ed. PLoS ONE 10:e0143407. [DOI] [PMC free article] [PubMed] [Google Scholar]
- 40. Wallingford MC, Chia J, Leaf EM, Borgeia S, Chavkin NW, Sawangmake C et al (2016) SLC20A2 deficiency in mice leads to elevated phosphate levels in cerbrospinal fluid and glymphatic pathway‐associated arteriolar calcification, and recapitulates human idiopathic basal ganglia calcification. Brain Pathol 27:64–76. [DOI] [PMC free article] [PubMed] [Google Scholar]
- 41. Wallingford MC, Gammill HS, Giachelli CM (2016) Slc20a2 deficiency results in fetal growth restriction and placental calcification associated with thickened basement membranes and novel CD13 and lamininα1 expressing cells. Reprod Biol 16:13–26. [DOI] [PMC free article] [PubMed] [Google Scholar]
- 42. Wang C, Li Y, Shi L, Ren J, Patti M, Wang T et al (2012) Mutations in SLC20A2 link familial idiopathic basal ganglia calcification with phosphate homeostasis. Nat Genet 44:254–256. [DOI] [PubMed] [Google Scholar]
- 43. Westenberger A, Balck A, Klein C (2019) Primary familial brain calcifications: genetic and clinical update. Curr Opin Neurol 32:571–578. [DOI] [PubMed] [Google Scholar]
- 44. Weyer SW, Klevanski M, Delekate A, Voikar V, Aydin D, Hick M et al (2011) APP and APLP2 are essential at PNS and CNS synapses for transmission, spatial learning and LTP. EMBO J 30:2266–2280. [DOI] [PMC free article] [PubMed] [Google Scholar]
- 45. Yao X‐P, Cheng X, Wang C, Zhao M, Guo X‐X, Su H‐Z et al (2018) Biallelic mutations in MYORG cause autosomal recessive primary familial brain calcification. Neuron 98:1116–1123.e5. [DOI] [PubMed] [Google Scholar]
- 46. Zarb Y, Weber‐Stadlbauer U, Kirschenbaum D, Kindler DR, Richetto J, Keller D et al (2019) Ossified blood vessels in primary familial brain calcification elicit a neurotoxic astrocyte response. Brain 116:2841. [DOI] [PMC free article] [PubMed] [Google Scholar]
- 47. Zeisel A, Muñoz‐Manchado AB, Codeluppi S, Lönnerberg P, La Manno G, Juréus A et al (2015) Brain structure. Cell types in the mouse cortex and hippocampus revealed by single‐cell RNA‐seq. Science 347:1138–1142. [DOI] [PubMed] [Google Scholar]
Associated Data
This section collects any data citations, data availability statements, or supplementary materials included in this article.
Supplementary Materials
Table S1. Proteomic analysis of the calcified nodules. The first tab presents an overview of the detected proteins in each experimental setup, with the number of unique peptide matches for each detected protein. The second tab provides an overview of the detected proteins for each experimental sample. Calzi: Calcified nodule extracted via microdissection. Brain: Control brain parenchyma obtained via microdissection. The laser capture microdissection samples are coded with a number, followed by a letter and finally, a dash with a number. The first number represents the mouse used (biological replicate, n = 3). A = calcified nodule, B = control, C = microvascular fragment. ‐1: extraction without demineralization. ‐2: extraction with demineralization.
Table S2. Proteins detected exclusively in the calcifications after stereomicroscope microdissection.
Table S3. Proteins detected exclusively in the calcifications after laser capture microdissection.
Table S4. List of antibodies used for immunofluorescence stainings.
Movie S1 . Dynamic interaction of calcifications with GFAP‐positive reactive astrocyte and IBA1‐positive microglia. Animation of confocal z‐stacks showing the dynamic interaction of GFAP‐positive astrocyte and IBA1‐positive microglia to a lesion (labeled with anti‐SPARCL1 antibody) found in a 3‐month‐old Pdgfbret/ret mouse. SPARCL1, GFAP and IBA1 channels were combined and the animation was generated with LAS AF software (Leica Microsystems) and Fiji (https://fiji.sc/).
Movie S2 . Association of a nodule with astrocyte and microglia. Animation of volumetric 3D rendering of confocal z‐stacks illustrating a nodule tightly associated with astrocyte and microglia in a 3‐month‐old Pdgfbret/ret mouse. Co‐immunostaining of APP, GFAP and IBA1 was performed on 50 µm thick parasagittal vibratome sections and 2D projections of the three merged channels were acquired prior to subjection to 3D‐rendering. Calcification is seen in red, GFAP‐positive cells in green and IBA1‐positive cells in cyan.
Movie S3 . Association of a nodule to small vessels. Animation of volumetric 3D rendering of confocal z‐stacks computed in Volocity v.6.31 (PerkinElmer) depicting a nodule tightly associated with a capillary in a 3‐month‐old Pdgfbret/ret. Co‐immunostaining of APP, CD31 and CD13 was performed on 50 µm thick parasagittal vibratome sections and 2D projections of the three merged channels were acquired prior to subjection to 3D rendering. Calcification is seen in red and vessels in purple.
Data Availability Statement
The data that support the findings of this study are available from the corresponding author upon reasonable request. The single‐cell data were extracted from the following resources available in the public domain: http://betsholtzlab.org/VascularSingleCells/database.html and http://linnarssonlab.org/cortex/.


