

Abstract
Photocatalytic water splitting has become a promising strategy for converting solar energy into clean and carbon‐neutral solar fuels in a low‐cost and environmentally benign way. Hydrogen gas is such a potential solar fuel/energy carrier. In a classical artificial photosynthetic system, a photosensitizer is generally associated with a co‐catalyst to convert photogenerated charge into (a) chemical bond(s). In the present study, assemblies consisting of CdSe quantum dots that are coupled with one of two molecular complexes/catalysts, that is, [Fe2S2(CO)6] or [Fe3Te2(CO)9], using an interface‐directed approach, have been tested as catalytic systems for hydrogen production in aqueous solution/organic solution. In the presence of ascorbic acid as a sacrificial electron donor and proton source, these assemblies exhibit enhanced activities for the rate of hydrogen production under visible light irradiation for 8 h in aqueous solution at pH 4.0 with up to 110 μmol of H2 per mg of assembly, almost 8.5 times that of pure CdSe quantum dots under the same conditions. Transient absorption and time‐resolved photoluminescence spectroscopies have been used to investigate the charge carrier transfer dynamics in the quantum dot/iron carbonyl cluster assemblies. The spectroscopic results indicate that effective electron transfer from the molecular iron complex to the valence band of the excited CdSe quantum dots significantly inhibits the recombination of photogenerated charge carriers, boosting the photocatalytic activity for hydrogen generation; that is, the iron clusters function as effective intermediaries for electron transfer from the sacrificial electron donor to the valence band of the quantum dots.
Keywords: electron transfer, iron carbonyl cluster, photoluminescence spectroscopy, proton reduction, quantum dot
Iron clusters for electron transfer: An assembly consisting of CdSe quantum dots and [Fe3Te2(CO)9] has been tested as a catalytic system for proton reduction in aqueous solution. Transient absorption and time‐resolved photoluminescence spectroscopies indicate that the iron cluster functions as an effective intermediary for electron transfer from a sacrificial electron donor to the valence band of the quantum dots.

Introduction
There is considerable interest in developing low‐cost and high‐efficiency photocatalysts for water oxidation and/or water reduction, to develop hydrogen as a solar fuel (energy transmitter).1, 2, 3, 4, 5, 6 Efficient and long‐lasting functional sites for light‐harvesting, charge transport, and redox reactions are required to be able to form a technologically significant solar‐driven H2 production system.7, 8, 9 Although colloidal platinum or platinum complexes show excellent activity for H2 production,10 platinum remains relatively scarce and expensive. Catalysts relying on materials free of noble metals are therefore desirable.11, 12 Hydrogenase enzymes (H2ases), which possess a remarkable ability to reduce protons to H2, contain organometallic iron or iron‐nickel units in their active sites,13 but the special working environment and oxygen sensitivity of H2ases limit the applicability of such enzymes to large‐scale applications.14 Because of the high activity of H2ases and the fact that the catalytic sites contain base metals, a plethora of biomimetic complexes have been synthesized to prepare efficient and cheap hydrogen production catalysts.15 Many attempts have been made to develop photocatalytic systems based on such biomimetic catalyst complexes, where such complexes have been modified by introduction of photoactive ligands or by preparing composites of biomimetic complexes with other (photoactive) materials.16, 17, 18, 19 However, the development of efficient (photocatalytic) hydrogen evolution systems based on molecular iron catalysts remains a significant challenge.
Photosensitizers that have been used in hydrogen evolution systems include organic and organometallic chromophores as well as semiconductor nanocrystals (quantum dots).20, 21, 22 Quantum dots possess many characteristics that are ideal for light‐harvesting and energy delivery, including unique size‐dependent absorption properties, large absorption cross sections over a broad spectral range, long excitation lifetimes, and excellent photostability.23 The surfaces of quantum dots may be readily modified for specific functional targets and/or reaction environments, and quantum dots can therefore form molecular assemblies with different catalysts.24, 25, 26, 27 King and co‐workers28 have demonstrated an efficient biomimetic strategy for preparation of molecular assemblies of CdTe nanocrystals with a hydrogenase enzyme, which was mediated by electrostatic interactions and resulted in stable, enzymatically active complexes for solar hydrogen production. The optimized CdTe‐CaI system could achieve a single wavelength quantum efficiency (QE) of 9 % (λ=523 nm) and an efficiency of 1.8 % at AM 1.5 G (a standard measure of solar brilliance) by using ascorbic acid as a sacrificial electron donor. Wen et al.29 have reported the construction of an efficient hybrid photocatalytic system for H2 evolution by using a mimic of a so‐called [FeFe]‐hydrogenase active site, [(μ‐SPh‐4‐NH2)2Fe2(CO)6], as the molecular catalyst, ZnS nanocrystals as photosensitizer, and ascorbic acid as the sacrificial electron donor. The resultant photocatalytic system exhibited excellent stability, achieving a total turnover number (TON, based on the molecular catalyst) of more than 2607 over 38 h of irradiation. Pickett and co‐workers30 introduced the [FeFe]‐hydrogenase mimic [Fe2S2(CO)6] onto InP nanocrystals to construct a photoelectrochemical cell for H2 evolution. Later, Wu and co‐workers31 used the same diiron complex to construct an efficient and robust hybrid assembly through the coordinated integration of [Fe2S2(CO)6] onto the surface of CdSe quantum dots in H2O/CH2Cl2 through interface‐directed surface binding. These investigators observed an excited state depopulation rate in the transient absorption of the assembly, which was 8.8 ns—shorter than that of the CdSe quantum dots (QDs) alone (17.6 ns)—and interpreted this as the occurrence of electron transfer from the CdSe quantum dots to the [Fe2S2(CO)6] cluster, leading to efficient catalytic H2 evolution. Recently, Sun and co‐workers32 linked the sulfonate‐functionalized [FeFe]‐H2ase mimic directly to CdSe quantum dots through a thiolato‐functionalized 6‐mercapto‐β‐cyclodextrin, which acts as a stabilizing reagent for CdSe quantum dots and as a host unit for the diiron complex, and this covalently linked assembly was explored for photocatalytic H2 production.
Here, we report a new hybrid assembly comprised of [Fe3Te2(CO)9] interfaced with CdSe quantum dots (Figure S1 in the Supporting Information) and its use for H2 evolution in water under visible light irradiation. In previous studies, we have found that [Fe3Te2(CO)9] is an excellent electrocatalyst for proton reduction.33, 34 Similarly to the results obtained by Wu and co‐workers for [Fe2S2(CO)6],31 the [Fe3Te2(CO)9] cluster, without any further chemical modification, can interact with CdSe quantum dots to afford a water‐soluble CdSe quantum dot/[Fe3Te2(CO)9] assembly. Upon irradiation with visible light by a xenon lamp for 8 h, the assembly enables H2 production at a rate of up to 110 μmol per mg of assembly at pH 4.0. The mechanism(s) for photocatalytic H2 evolution of the CdSe quantum dot/[Fe3Te2(CO)9] assembly and the corresponding CdSe quantum dot/[Fe2S2(CO)6] system were also studied by a combination of transient absorption (TA) and time‐resolved photoluminescence (TRPL) spectroscopy. The spectroscopic results provide unexpected insight into the photocatalytic mechanism in this kind of quantum dot/iron carbonyl cluster hybrid catalyst systems. After photoexcitation, the excited electrons in the quantum dots remain in the conduction band of the quantum dots whereas there is electron transfer from the iron carbonyl clusters to the valence band of the excited quantum dots within 500 ps owing to the band alignment. Thus, the iron carbonyl clusters act as electron donors (i.e., intermediaries of electron transfer from the sacrificial electron donor) to mediate the scavenging of the excited holes in the quantum dots, for example, through electron–hole recombination, during the photocatalytic reaction. This appears to be the photophysical origin of the boosted photocatalytic hydrogen generation in these hybrid systems.
Results and Discussion
Physical and chemical characterization
The diameter of the CdSe dots used in our experiments was calculated to be 1.95 nm from the position of the 1S exciton band in the absorption spectrum (449 nm; Figure S2 in the Supporting Information). The size of the nanocrystals was also investigated by transmission electron microscopy (TEM; Figure S3 a in the Supporting Information), which showed nanocrystals with an average diameter of 2.2±0.5 nm (Figure S3 b in the Supporting Information), consistent with the calculated result within experimental error.
Fourier‐transform infrared (FTIR) spectroscopy of the assembly (Figure S4 in the Supporting Information) shows peaks in the carbonyl stretching region (2043 cm−1, 2010 cm−1, 1986 cm−1), which are redshifted compared with the free [Fe3Te2(CO)9] species (2045 cm−1, 2024 cm−1, and 2000 cm−1). The broadening and shift of the peaks indicate that [Fe3Te2(CO)9] chemisorbs on the surface of CdSe quantum dots, in analogy with the observations made by Wu and co‐workers.31 Inductively coupled plasma–optical emission spectrometry (ICP‐OES) was also used to determine the amount of [Fe3Te2(CO)9] in the assembly, which was found to be 2.6 % (w/w). This means that the concentrations of [Fe3Te2(CO)9] and CdSe quantum dots in the hydrogen evolution experiments are 7.8×10⁻⁶ m and 1.9×10⁻⁵ m, respectively (2 mg CdSe/[Fe3Te2(CO)9] assembly in 10 mL H2O). Taking the number of Cd and Se atoms within the individual quantum dot at a size of 2.2 nm to be 100 for each, a rough calculation yields an average of approximately 40 iron carbonyl cluster molecules attached to each individual quantum dot. X‐ray photoelectron spectroscopy (XPS) displays signals of Fe 2p1/2 at 724.1 eV and Fe 2p3/2 at 710.8 eV for [Fe3Te2(CO)9] whereas the CdSe quantum dot/[Fe3Te2(CO)9] assembly shows signals of Fe 2p1/2 at 723.7 eV and Fe 2p3/2 at 710.6 eV (Figure 1). The results imply that the valence state of the iron core remains intact in the assembly, as may be expected. The very minor change in energies is consistent with linking between the CdSe quantum dots and the [Fe3Te2(CO)9] clusters. Furthermore, measurements of the tellurium 3d photoelectrons indicate that the iron‐tellurium clusters remain intact (Figure 1).
Figure 1.

XPS spectra for (a) Fe 2p, (b) Te 3d, (c) Cd 3d, (d) Se 3d core levels. In all four plots, the traces for the CdSe quantum dot/[Fe3Te2(CO)9] assembly are plotted as the top trace with that for the pure [Fe3Te2(CO)9] cluster (a,b) or pure quantum dot (c,d) plotted below.
Photocatalytic H2 evolution activity
The efficiency of H2 production by the quantum dot/cluster assembly was found to be influenced by several factors, in particular the pH value of the system, the concentration of the sacrificial electron donor (and proton source; ascorbic acid, H2A), and the concentration of the CdSe quantum dot/[Fe3Te2(CO)9] assembly. Figure 2 a shows the dependence of the photocatalytic H2 evolution on the pH value, where the best pH value of this system for H2 production was determined to be around 4.0. This pH dependence corresponds mainly to the surface charge changes of the CdSe quantum dots and the equilibrium of H2A (pK a1=4.03). An increase in H2A concentration from 2.55×10⁻² m to 1.25×10⁻¹ m results in growth of the H2 production rate from 13.6 μmol to 114 μmol per mg of assembly. The H2 production rate increases linearly with increasing H2A concentration up to 0.4 m (Figure 2 b). In addition, when the amount of the assembly was increased from 0.5 mg to 2 mg at pH 4.0 (Figure 2 c), where the concentration of H2A was 0.4 m, the total amount of H2 evolution was significantly increased from 60 μmol to 280 μmol after 8 h of irradiation. Upon a further three‐fold increase of the concentration of the assembly (from 2 mg to 6 mg in 10 mL), the total amount of H2 generation and the rate of H2 production increased whereas the relative increase in relation to increase in concentration declined. As a result, an optimized H2 evolution system containing 0.125 m H2A and 2 mg CdSe quantum dot/[Fe3Te2(CO)9] assembly in 10 mL water at pH 4.0 was able to photocatalyze H2 evolution for 8 h with a rate of 110 μmol mg−1, almost 8.5 times higher than that for the corresponding system based on CdSe quantum dots only (Figure 2 d), see below. In control experiments, the CdSe quantum dot/[Fe3Te2(CO)9] assembly showed significantly higher activity for hydrogen production than [Fe3Te2(CO)9] only, or CdSe quantum dots only, or a mixture (not an assembly) of [Fe3Te2(CO)9] and CdSe quantum dots (Figure 2 e). The comparison was carried out in 10 mL solution (H2O/CH3CN 7:3, v/v), owing to the insolubility of [Fe3Te2(CO)9] in water. For systematic comparison, all of the systems were kept at the same concentration of CdSe quantum dots and H2A (0.125 m) at pH 4.0. With visible light irradiation for 8 h, the H2 production rate of the CdSe quantum dot/[Fe3Te2(CO)9] assembly was 71 μmol mg−1, twice as high as a mixture of quantum dots and cluster, and significantly higher than either the quantum dots or iron carbonyl clusters alone (Figure 2 e). These results reveal the critical roles of not only the [Fe3Te2(CO)9] cluster but also the interface‐directed interaction in the H2 evolution system. The hydrogen production activity of a different photosensitizer with the [Fe3Te2(CO)9] cluster was also studied for control purposes (Figure S5 in the Supporting Information). When the well‐known photosensitizer [Ru(bpy)Cl2] (1.9×10⁻⁵ m) was used with [Fe3Te2(CO)9] (7.8×10⁻⁶ m) in 10 mL solution (H2O/CH3CN, 7:3, v/v) in the presence H2A (0.125 m) at pH 4.0, no hydrogen production could be detected. A corresponding quantum dot/cluster assembly involving the iron carbonyl chalcogenide cluster [Fe2S2(CO)6]31 was also studied under the same conditions, leading to the hydrogen evolution profiles depicted in Figure 2 f. As shown by Wu and co‐workers,31 this assembly also gives good hydrogen evolution. However, the quantum dot/triiron assembly showed a better activity not only in pure water but also in the acetonitrile/water mixture.
Figure 2.
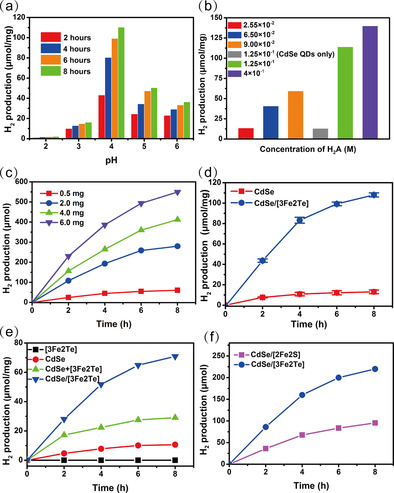
(a) Photocatalytic H2 evolution at different pH values in 10 mL H2O, 2 mg CdSe quantum dot/Fe3Te2(CO)9], ascorbic acid (H2A) (0.125 m). (b) The dependence of H2 evolution on the concentration of H2A from 0.0255 m to 0.4 m, 2 mg CdSe/Fe3Te2(CO)9, pH 4.0 for 8 h. (c) H2 evolution as a function of concentration of the CdSe/[Fe3Te2(CO)9] assembly, H2A (0.4 m), pH 4.0. (d) Photocatalytic H2 evolution in 10 mL H2O, under optimized conditions: 2 mg CdSe quantum dots or CdSe quantum dot/[Fe3Te2(CO)9], H2A (0.125 m), pH 4.0. (e) Control experiments of the photocatalytic H2 evolution, 2 mg CdSe or CdSe quantum dot/[Fe3Te2(CO)9] in 10 mL solution(water/acetonitrile, 7:3). (f) Photocatalytic H2 evolution of the two different assemblies, 2 mg CdSe quantum dot/[Fe2S2(CO)6] or CdSe quantum dot/[Fe3Te2(CO)9] in 10 mL H2O. The systems were kept under identical ascorbic acid concentration (0.125 m) at pH 4.0, and irradiated for 8 h by a 300 W xenon lamp. Error bars represent mean ±s.d. of three independent experiments.
Optical characterization
The optical absorption behaviors of the CdSe quantum dots, CdSe quantum dot/[Fe2S2(CO)6], and CdSe quantum dot/[Fe3Te2(CO)9] assemblies were studied by using UV/Vis spectroscopy. As depicted in Figure 3 a, the pristine CdSe quantum dots show the typical 1S exciton band at about 449 nm, which corresponds to an optical band gap of 2.7 eV (see above).31 On the other hand, the molecular clusters do not exhibit absorptions in the visible light region (Figure S6 in the Supporting Information). It can thus be assumed that the light absorption of the CdSe quantum dots provides the charge carriers needed for the photocatalytic reaction.
Figure 3.

(a) UV/Vis absorption spectra for CdSe quantum dots (red trace), CdSe quantum dot/[Fe2S2(CO)6] assembly (magenta trace), and CdSe quantum dot/[Fe3Te2(CO)9] assembly (blue trace). (b) Emission spectra of CdSe quantum dots (2.0×10⁻⁴ m) before (red trace) and after being stirred with an iron carbonyl cluster for 12 h. The quenching efficiency estimated at 610 nm for the CdSe quantum dot/[Fe2S2(CO)6] (red trace) and the CdSe quantum dot/[Fe3Te2(CO)9] assemblies (blue trace) is 67 % and 92 %, respectively.
The efficient charge transfer from the photoexcited CdSe quantum dots to the iron carbonyl catalysts is expected owing to their intimate contact in the assemblies. To further confirm our assumption, emission quenching and flash photolysis experiments were first carried out. As shown in Figure 3 b and Figure S7 (in the Supporting Information), first the photoluminescence emission peaks of the CdSe quantum dots are generated from the trap state (the broad emission from 500 nm to 750 nm centered at about 650 nm) instead of intrinsic band edge emission. Such trap states should be located at 0.2–1.0 eV within the band edge according to the emission energy. This emission is quenched dramatically upon binding of [Fe2S2(CO)6] or [Fe3Te2(CO)9] on the surface of the quantum dots considering the unchanged absorbance at the excitation wavelength, as shown in Figure 3 a. The quenching of the emission may be attributed to charge transfer from the excited CdSe quantum dots to the di‐ or trinuclear iron carbonyl clusters. The small redshift probably results from the enhanced electronic coupling between the CdSe quantum dots and [Fe3Te2(CO)9] (Figure S7 a in the Supporting Information). The emission quenching experiments of CdSe quantum dots (19 μm) with progressive addition of different concentrations of the [Fe3Te2(CO)9] cluster (i.e., a cluster quantum dot mixture, not an assembly) were studied, in a water/acetonitrile mixture (Figure S7 b in the Supporting Information). This study indicated a relatively inefficient charge transfer process between the iron carbonyl cluster and the CdSe quantum dots; this may be due to the insolubility of the [Fe3Te2(CO)9] cluster in pure water. The calculated corresponding Stern–Volmer plot is shown in Figure S7 c (in the Supporting Information). However, the quenching efficiency estimated at 610 nm for the CdSe quantum dot/[Fe2S2(CO)6] and the CdSe quantum dot/[Fe3Te2(CO)9] assemblies is 67 % and 92 %, respectively (Figure 3 b). The charge transfer efficiency of the CdSe quantum dot/[Fe3Te2(CO)9] assembly was more effective than CdSe quantum dots and [Fe3Te2(CO)9] cluster mixture, in agreement with the hydrogen production results (cf. Figure 2 b and e). In view of the small spectroscopic overlap of the absorption of the iron carbonyl clusters and the emission of CdSe quantum dots, the energy transfer between the excited CdSe quantum dots and the iron molecular catalysts should be negligible; the emission quenching therefore should only originate from the photoinduced charge transfer (PCT) from the CdSe quantum dots to [Fe3Te2(CO)9 ] or [Fe2S2(CO)6]. The larger extent of quenching for the quantum dot/cluster assemblies than for the CdSe quantum dot/cluster mixtures (the concentrations of [Fe2S2(CO)6]31 and [Fe3Te2(CO)9] were identical to that in the assembly) indicates an efficient charge transfer process in the quantum dot/cluster assemblies.
As demonstrated above, efficient charge transfer from the excited CdSe quantum dots to the two iron carbonyl clusters can be expected. To rationalize this charge transfer, we first studied the energy alignment of the hybrid system. As discussed above, the measured/calculated size of the CdSe quantum dots (1.95 nm) corresponds to a band gap of approximately 2.7 eV. The valence band of the CdSe quantum dots locates close to −6.8 eV versus vacuum, which means that the conduction band position of the CdSe quantum dots is approximately −4.1 eV versus vacuum.35 Density functional theory (DFT) was used to calculate the HOMO and LUMO energy levels of the two iron carbonyl clusters, [Fe2S2(CO)6] and [Fe3Te2(CO)9]34 (see the Supporting Information). The calculations show that the lowest unoccupied molecular orbital (LUMO) of [Fe2S2(CO)6] is located at −2.75 eV versus vacuum and its highest occupied molecular orbital (HOMO) is located at −6.66 eV versus vacuum. The LUMO of [Fe3Te2(CO)9] is located at −3.51 eV versus vacuum and its HOMO is located at −6.62 eV versus vacuum.34 The HOMO–LUMO energy gaps of [Fe2S2(CO)6] and [Fe3Te2(CO)9] are thus 3.9 eV and 3.1 eV, respectively. The calculated energy levels indicate that electron transfer from the photoexcited CdSe quantum dots to the iron carbonyl catalysts is thermodynamically uphill, whereas photogenerated hole transfer in the CdSe quantum dot/[Fe] assemblies (electron transfer from the iron carbonyl cluster to the quantum dot) is thermodynamically possible (Figure 4). The related potentials versus the normal hydrogen electrode (NHE) at pH 4.0 are also shown in Figure 4.36, 37
Figure 4.
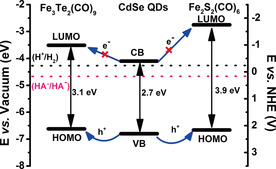
Calculated and computed molecular orbital/band energies in vacuum, and schematic hole transfer processes in the CdSe quantum dot/iron carbonyl cluster assemblies. The potential scale has been calculated by using the relationship E (NHE)=−E (absolute vacuum scale)−4.50.36 Potentials for H+/H2 and HA./HA− (sacrificial electron donor) are at pH 4.37
A complementary experimental analysis combining transient absorption and time‐resolved photoluminescence was performed to verify the photoinduced hole transfer process at room temperature (Figure 5 a–c). Transient absorption measurements can only probe the excited state population and depopulation dynamics of CdSe quantum dots. Figure 5 a shows the typical transient absorption spectra of the three different samples, that is, pure CdSe quantum dots and the two quantum dot/iron carbonyl cluster assemblies. The three samples show similar ground state bleach spectra owing to the population of the band edge state of the quantum dots after excitation. It should be noted that in CdSe quantum dots, the ground state bleach in transient absorption only reflects the excited electron population as the density of the band edge for excited electron states is significantly smaller than the corresponding density of the hole states. In our previous studies, we have found that an increase in the rate of the CdSe quantum dot ground state bleach (GSB) recovery can be clearly observed when the quantum dots are attached to electron acceptors whereas the kinetics remain the same when the quantum dots are attached to hole acceptors.23, 38 The kinetics at the maximum bleach stay almost constant between neat quantum dots and the quantum dot/cluster assemblies, which indicates that no additional depopulation pathway for the excited electrons has been established (Figure 5 b).
Figure 5.
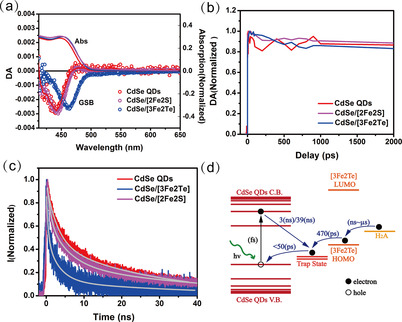
(a) Ground state bleach (GSB) and transient absorption spectra (Abs) at 3 ps after excitation pump at 400 nm, 2E13 ph cm−2. (b) Transient absorption kinetics at the minimum bleach. CdSe quantum dot (red trace), CdSe quantum dot/[Fe2S2(CO)6] (magenta trace), and CdSe quantum dot/[Fe3Te2(CO)9](blue trace). (c) The time‐resolved photoluminescence decay of pure CdSe quantum dot (red trace), CdSe quantum dot/[Fe2S2(CO)6] (magenta trace) and CdSe quantum dot/[Fe3Te2(CO)9](blue trace). (d) Recombination dynamics in the CdSe quantum dot/[Fe3Te2(CO)9] assembly system. QD=quantum dot; VB=valence band, CB=conduction band.
On the other hand, different photoluminescence decays could be observed. First, it should be noted that the excitation density per quantum dot <N> in our experiment is much less than 1, therefore all high‐order recombination processes (e.g., Auger recombination) can be excluded. The photoluminescence decay of the pure CdSe quantum dots is apparently slower than those of the two assemblies, as shown in Figure 5 c. This indicates that more non‐radiative recombination pathways have been introduced in the two quantum dot/cluster assemblies. As the transient absorption spectra do not support electron transfer from the quantum dots, the only possibility to explain the different photoluminescence kinetics is hole transfer from the defect emissive state in the quantum dots to the clusters (i.e., electron transfer from the clusters to the defect emissive state of the excited quantum dots), which is found to be energetically favorable by the DFT calculations (see above). In addition, the CdSe quantum dot/[Fe3Te2(CO)9] assembly exhibits a faster photoluminescence decay than the CdSe quantum dot/[Fe2S2(CO)6] assembly. The kinetics in Figure 5 c can be fitted biexponentially with time constants τ 1=3(±0.03) ns (52 %) and τ 2=28(±0.20) ns (48 %) for the pure CdSe quantum dots. The long component may be assigned to the radiative recombination from the deep trap states, which induce the defect emission. Such trap states are usually introduced as Se vacancies at the surfaces of the quantum dots owing to the existence of surface dangling bonds when thiol (thiolate) ligands are used as capping agents.23 The fast component (3 ns) is attributed to the non‐radiative recombination from the deep trap states in the pool of quantum dots where the non‐radiative recombination pathway dominates. The photoluminescence kinetics of the quantum dot/cluster assemblies, on the other hand, can be fitted by triexponential decays with time constants τ 1=470(±46) ps (55 %), τ 2=3(±0.20) ns (34 %), and τ 3=39(±2.88) ns (11 %) for CdSe/[Fe3Te2(CO)9] and τ 1=870(±42) ps (29 %), τ 2=5(±0.19) ns (41 %), and τ 3=42(±1.21) ns (30 %) for CdSe/[Fe2S2(CO)6] (Table S2 in the Supporting Information); these timescales are discussed below. Apart from the coexisting two slow components in all the samples, the fastest component, with a lifetime of hundreds of ps, only occurs in the quantum dot/cluster assemblies, and this component is therefore attributed to the charge transfer. As such a component cannot be found in the transient absorption kinetics, it should be induced by the excited hole dynamics in the quantum dots. In this scenario, we may conclude that it is due to the scavenging process of trapped holes at deep surface defect states by electron injection as shown in Figure 5 d. The electron injection rate from the [Fe3Te2(CO)9] clusters in the assemblies is almost double (470 ps) compared with the corresponding [Fe2S2(CO)6]‐based assembly (870 ps).
Scheme 1 summarizes the photocatalytic processes for our hybrid system. After photoexcitation, the photoexcited electrons remain in the quantum dots for proton reduction, whereas the role of the iron carbonyl complexes is to mediate electron transfer from the sacrificial electron donor to scavenge the residual holes in the quantum dots. This scheme is opposite to the conventional view of quantum dot‐based photocatalytic composites where the quantum dots are utilized as light harvesters and molecular catalysts receive excited electrons from the quantum dot conduction band for proton reduction. However, the light conversion efficiency for typical quantum dot‐based photoanodes in either photocatalytic or photovoltaic applications is bottlenecked by the hole rather than electron dynamics.39 Hole extraction, also known as hole scavenging (on the ns–μs timescale) is generally 2 to 3 orders of magnitude slower than the electron extraction (electron injection, which occurs on the ps timescale).40 Thus, the unbalanced charge separation process would result in spatial hole accumulation at the quantum dot surface, leading to potential anodic corrosion of the quantum dots as well as an increased rate of geminate recombination with photogenerated electrons. In the present quantum dot/cluster assemblies, on the other hand, the iron carbonyl clusters serve as electron transfer mediators to accelerate the hole scavenger process by one to two orders of magnitude (i.e., 470–870 ps). As electrochemical measurements on the clusters show one‐electron redox processes,34, 41, 42 the electron transfer of the two electrons needed to reduce two protons will occur sequentially, which diminishes the surface charge accumulation of the quantum dots. It should be borne in mind that although the HOMO–LUMO gaps of the two clusters are relatively accurate and internally consistent, and the band gap of the quantum dots also is relatively accurate, the relative relationship of these entities on an energy scale, as depicted in Figure 4, can only be qualitative. The spectroscopic results are entirely in keeping with Figures 4 and 5 d.
Scheme 1.

A schematic depiction of the mechanism of light‐driven proton reduction by the quantum dot/[Fe3Te2(CO)9] assembly.
Conclusions
We have developed a new, efficient, and robust photocatalytic assembly for H2 evolution in water. The interface‐directed CdSe quantum dot/[Fe3Te2(CO)9] assembly has been demonstrated to be a better photocatalytic system in water than the corresponding CdSe quantum dot/[Fe2S2(CO)6] assembly. Transient absorption and time‐resolved photoluminescence spectroscopies have been utilized to study the charge transfer dynamics in the two above‐mentioned CdSe/iron carbonyl cluster assemblies. In addition to our demonstration of the formation of CdSe quantum dots linked with iron molecular catalysts, the spectroscopic studies indicate effective hole transfer from the photoexcited CdSe quantum dots to the iron carbonyl clusters, significantly inhibiting the recombination of photogenerated charge carriers within the quantum dots and thus boosting the photocatalytic activity for hydrogen generation. This indicates that the iron carbonyl clusters in the quantum dot/cluster assemblies function as effective intermediaries in the electron transfer from the sacrificial electron donor (ascorbic acid) to the quantum dots.
Experimental Section
Materials
All chemicals and solvents were obtained from commercial suppliers and used without further purification unless otherwise noted.
Synthesis of iron carbonyl clusters
The clusters [Fe3Te2(CO)9]43 and [Fe2S2(CO)6]44 were synthesized by published methods.
Synthesis of CdSe quantum dots
CAUTION: Cadmium is a toxic heavy metal and compounds containing cadmium should be handled with appropriate care. The water‐soluble CdSe quantum dots were synthesized by a slight modification of a published method.45 CdCl2 ⋅2.5 H2O was selected as a Cd precursor, Na2SeSO3 as a Se precursor, and 3‐mercapto‐propionic acid (MPA) as a stabilizing ligand. First, sodium selenosulfate, Na2SSeO3, was prepared by adding Se powder (40 mg, 0.5 mmol) and Na2SO3 (189 mg, 1.5 mmol) into H2O (100 mL), followed by heating at reflux under nitrogen until the Se powder was dissolved completely. Then, CdCl2 ⋅2.5 H2O (46 mg, 0.2 mmol) was dissolved in H2O (190 mL), with MPA (26 μL, 0.3 mmol) injected into the solution; after adjusting the pH value of the solution to 11 by using 1 m NaOH and a pH meter to control the value, the solution was bubbled with N2 for 30 min. Next, Na2SeSO3 solution (10 mL) was injected into the solution and the system was heated at reflux under nitrogen for 6 h. The resulting CdSe QDs were further purified with isopropanol to remove the free ions and ligands remaining in the system.
Synthesis of CdSe quantum dot/[Fe3Te2(CO)9] assembly
The water‐soluble CdSe quantum dot/[Fe3Te2(CO)9] assemblies were synthesized according to the method described by Wu and co‐workers.31 The hydrophobic [Fe3Te2(CO)9] clusters were able to bind to the CdSe quantum dots at the aqueous/organic interface. Typically, an aqueous solution of CdSe quantum dots (2.0×10⁻⁴ m, calculated from the low‐energy absorption band, see the Supporting Information) was mixed with a dichloromethane solution of [Fe3Te2(CO)9] (1.0×10⁻² m), and vigorously stirred for 12 h at room temperature. During this process, the color of the water phase changed from yellow to brown, indicating the formation of the CdSe quantum dot/[Fe3Te2(CO)9] assembly. The water phase was then precipitated with isopropanol to obtain the assembly. Finally, a brown solid product was collected; the assembly has a deep‐brown color as opposed to the yellow color of the pure CdSe quantum dots.
Synthesis of CdSe quantum dot/[Fe2S2(CO)6] assembly
The water‐soluble CdSe quantum dot/[Fe2S2(CO)6] assemblies were synthesized by the same method described above, which had already been established by Wu and co‐workers.31 Typically, an aqueous solution of CdSe quantum dots (2.0×10⁻⁴ m) was mixed with a dichloromethane solution of [Fe2S2(CO)6] (1.0×10⁻² m), and vigorously stirred for 12 h at room temperature. During this process, the color of the water phase changed from green to yellow, indicating formation of the CdSe quantum dot/[Fe2S2(CO)6] assembly. The water phase was then precipitated with isopropanol to obtain the assembly.
Photocatalysis experiments
The visible‐light‐driven H2 evolution experiments were performed at room temperature. Pure CdSe quantum dots or [Fe3Te2(CO)9] catalyst or CdSe quantum dot/[Fe3Te2(CO)9] assembly were added, together with the sacrificial electron donor ascorbic acid (H2A), into a water or water/acetonitrile mixture (10 mL, 7:3 v/v) in a homemade photocatalysis reactor. Generally, the reaction was carried out under irradiation by a 300 W xenon lamp (Excelitas Technologies, PE300BFM). Bubbles emerging from the solution could be directly observed soon after turning on the light. The generation of H2 was monitored by gas chromatography by using a molecular sieve column (5 Å), thermal conductivity detector, and argon carrier gas.
Instrumentation and methods
The composition of the CdSe quantum dot/[Fe3Te2(CO)9] assembly was determined by inductively coupled plasma spectroscopy. Steady‐state UV/Vis absorption spectra were recorded by using a VWR UV‐1600PC spectrophotometer. Fourier‐transform infrared spectroscopy (FTIR) was recorded by using an Agilent Cary 630 FTIR Spectrometer. Samples were prepared as follows: a portion of the solvent (hexanes) was evaporated to obtain a concentrated solution, then it was dropped onto KBr powder and well mixed, and a KBr pellet was pressed after the mixture had dried. Gas chromatography was performed with an Agilent 7820A GC System. The steady‐state fluorescence (photoluminescence) spectra were recorded with a Spex Fluorolog 1681 spectrofluorometer. X‐ray photoelectron spectroscopy (XPS) was performed with a Thermo Scientific XPS spectrometer, with AlKα radiation (1486 eV) as the excitation X‐ray source. Before the experiment, a drop of solution was deposited onto the sample holder and the solvent was evaporated. Transmission electron microscopy (TEM) images were recorded by using a JEOL JEM‐1400 microscope operated at 200 kV. Transient absorption (TA) experiments were performed by using a femtosecond pump‐probe setup under nitrogen atmosphere. Laser pulses (800 nm, 80 fs pulse length, 0.5 kHz repetition rate) were generated by using a regenerative amplifier (Spitfire XP Pro) seeded by a femtosecond oscillator (Mai Tai SP, both Spectra Physics). The pump pulses at 400 nm were generated by a BBO crystal as a second harmonic of the laser. The used excitation photon fluxes were 1×10¹² photons cm−2/pulse. For the probe, the super‐continuum generation from a thin CaF2 plate was used. The mutual polarization between pump and probe beams was set to the magic angle (54.7°) by placing a Berek compensator in the pump beam. The probe pulse and the reference pulse were dispersed in a spectrograph and detected by a diode array (Pascher Instruments). To avoid photo‐damage, the sample was moved to a fresh spot after each time delay point. Time‐resolved photoluminescence (TRPL) measurements were performed by using a time‐correlated single photon counting setup utilizing a pulsed diode laser that is triggered externally at 2.5 MHz to excite the sample at 438 nm (at fluence of 1.1×10¹²), which is the same as the transient absorption measurement, and the pulse duration of the laser is about 40 ps. The emitted photons were detected by a fast avalanche photodiode (SPAD, Micro Photon Device) with a response time less than 50 ps after passing through a 450 nm long band pass filter.
Computational details
All calculations were performed with the hybrid DFT functional B3LYP, as implemented by the Gaussian 09 program package.46 This functional utilizes the Becke three‐parameter exchange functional (B3),47 combined with the correlation functional of Lee, Yang, and Parr (LYP).48 The iron atoms were described by the Stuttgart–Dresden effective core potentials (ecp) and an SDD basis set, whereas the 6‐31+G(d′) basis set was employed for the remaining atoms.
Conflict of interest
The authors declare no conflict of interest.
Acknowledgements
C.L. thanks the China Scholarship Council for a predoctoral scholarship. We thank Jürgen Kuhn for ICP‐OES measurements. K.Z. acknowledges financial support from the Danish Council for Independent Research, grant no. 7026‐0037B, and the Swedish Research Council, grant no. 2017‐05337. M.G.R. acknowledges financial support from the Robert A. Welch Foundation (grant B‐1093).
C. Li, A. Rahaman, W. Lin, H. Mourad, J. Meng, A. Honarfar, M. Abdellah, M. Guo, M. G. Richmond, K. Zheng, E. Nordlander, ChemSusChem 2020, 13, 3252.
Contributor Information
Prof. Kaibo Zheng, Email: kaibo.zheng@chemphys.lu.se.
Prof. Ebbe Nordlander, Email: ebbe.nordlander@chemphys.lu.se.
References
- 1. Esswein A. J., Nocera D. G., Chem. Rev. 2007, 107, 4022–4047. [DOI] [PubMed] [Google Scholar]
- 2. Wang Y., Suzuki H., Xie J., Tomita O., Martin D. J., Higashi M., Kong D., Abe R., Tang J., Chem. Rev. 2018, 118, 5201–5241. [DOI] [PMC free article] [PubMed] [Google Scholar]
- 3. Zhang B., Sun L., Chem. Soc. Rev. 2019, 48, 2216–2264. [DOI] [PubMed] [Google Scholar]
- 4. Chen X., Li C., Grätzel M., Kostecki R., Mao S. S., Chem. Soc. Rev. 2012, 41, 7909–7937. [DOI] [PubMed] [Google Scholar]
- 5. Vicente A. T., Araújo A., Mendes M. J., Nunes D., Oliveira M. J., Sanchez-Sobrado O., Ferreira M. P., Águas H., Fortunato E., Martins R., J. Mater. Chem. C 2018, 6, 3143–3181. [Google Scholar]
- 6. Deng J., Su Y., Liu D., Yang P., Liu B., Liu C., Chem. Rev. 2019, 119, 9221–9259. [DOI] [PubMed] [Google Scholar]
- 7. Xu Y., Zhang B., Catal. Sci. Technol. 2015, 5, 3084–3096. [Google Scholar]
- 8. Li X.-B., Tung C.-H., Wu L.-Z., Nat. Rev. Chem. 2018, 2, 160–173. [Google Scholar]
- 9. Walter M. G., Warren E. L., McKone J. R., Boettcher S. W., Mi Q., Santori E. A., Lewis N. S., Chem. Rev. 2010, 110, 6446–6473. [DOI] [PubMed] [Google Scholar]
- 10. Bamwenda G. R., Tsubota S., Nakamura T., Haruta M., J. Photochem. Photobiol. A 1995, 89, 177–189. [Google Scholar]
- 11. Merki D., Hu X., Energy Environ. Sci. 2011, 4, 3878–3888. [Google Scholar]
- 12. Berardi S., Drouet S., Francas L., Gimbert-Suriñach C., Guttentag M., Richmond C., Stoll T., Llobet A., Chem. Soc. Rev. 2014, 43, 7501–7519. [DOI] [PubMed] [Google Scholar]
- 13. Frey M., ChemBioChem 2002, 3, 153–160. [DOI] [PubMed] [Google Scholar]
- 14. Kubas G. J., Chem. Rev. 2007, 107, 4152–4205. [DOI] [PubMed] [Google Scholar]
- 15. Tard C., Pickett C. J., Chem. Rev. 2009, 109, 2245–2274. [DOI] [PubMed] [Google Scholar]
- 16. Wu L.-Z., Chen B., Li Z. J., Tung C.-H., Acc. Chem. Res. 2014, 47, 2177–2185. [DOI] [PubMed] [Google Scholar]
- 17. Liu S., Tang Z.-R., Sun Y., Colmenares J. C., Xu Y.-J., Chem. Soc. Rev. 2015, 44, 5053–5075. [DOI] [PubMed] [Google Scholar]
- 18. Zhang X., Peng T., Song S., J. Mater. Chem. A 2016, 4, 2365–2402. [Google Scholar]
- 19. Liu B., Li X.-B., Gao Y.-J., Li Z.-J., Meng Q.-Y., Tung C.-H., Wu L.-Z., Energy Environ. Sci. 2015, 8, 1443–1449. [Google Scholar]
- 20. Chen X., Shen S., Guo L., Mao S. S., Chem. Rev. 2010, 110, 6503–6570. [DOI] [PubMed] [Google Scholar]
- 21. Hisatomi T., Kubota J., Domen K., Chem. Soc. Rev. 2014, 43, 7520–7535. [DOI] [PubMed] [Google Scholar]
- 22. Moniz S. J., Shevlin S. A., Martin D. J., Guo Z.-X., Tang J., Energy Environ. Sci. 2015, 8, 731–759. [Google Scholar]
- 23. Zheng K., Žídek K., Abdellah M., Zhang W., Chábera P., Lenngren N., Yartsev A., Pullerits T., J. Phys. Chem. C 2014, 118, 18462–18471. [Google Scholar]
- 24. Karakoti A. S., Shukla R., Shanker R., Singh S., Adv. Colloid Interface Sci. 2015, 215, 28–45. [DOI] [PubMed] [Google Scholar]
- 25. Amelia M., Lincheneau C., Silvi S., Credi A., Chem. Soc. Rev. 2012, 41, 5728–5743. [DOI] [PubMed] [Google Scholar]
- 26. Zrazhevskiy P., Sena M., Gao X., Chem. Soc. Rev. 2010, 39, 4326–4354. [DOI] [PMC free article] [PubMed] [Google Scholar]
- 27. Wang X., Sun G., Li N., Chen P., Chem. Soc. Rev. 2016, 45, 2239–2262. [DOI] [PubMed] [Google Scholar]
- 28. Brown K. A., Dayal S., Ai X., Rumbles G., King P. W., J. Am. Chem. Soc. 2010, 132, 9672–9680. [DOI] [PubMed] [Google Scholar]
- 29. Wen F., Wang X., Huang L., Ma G., Yang J., Li C., ChemSusChem 2012, 5, 849–853. [DOI] [PubMed] [Google Scholar]
- 30. Nann T., Ibrahim S. K., Woipei M., Xu S., Ziegler J., Pickett C. J., Angew. Chem. Int. Ed. 2010, 49, 1574–1577; [DOI] [PubMed] [Google Scholar]; Angew. Chem. 2010, 122, 1618–1622. [Google Scholar]
- 31. Li C.-B., Li Z.-J., Yu S., Wang G. X., Wang F., Meng Q.-Y., Chen B., Feng K., Tung C.-H., Wu L.-Z., Energy Environ. Sci. 2013, 6, 2597–2602. [Google Scholar]
- 32. Cheng M., Wang M., Zhang S., Liu F., Yang Y., Wan B., Sun L., Faraday Discuss. 2017, 198, 197–209. [DOI] [PubMed] [Google Scholar]
- 33.A. Rahaman, Iron carbonyl clusters as proton reduction catalysts, Ph.D. Thesis, Lund University, 2016.
- 34.A. Rahaman, G. C. Lisensky, J. B. Long, D. A. Hrovat, M. G. Richmond, E. Nordlander, G. Hogarth, unpublished results, 2019.
- 35. Islam S. K., Sohel M. A., Lombardi J. R., J. Phys. Chem. C 2014, 118, 19415–19421. [Google Scholar]
- 36. Liu X.-Y., Zheng H.-W., Zhang Z.-L., Liu X.-S., Wan R.-Q., Zhang W.-F., J. Mater. Chem. 2011, 21, 4108–4116. [Google Scholar]
- 37. Khnayzer R., Thoi V., Nippe M., King A., Jurss J., El Roz K., Long J., Chang C., Castellano F., Energy Environ. Sci. 2014, 7, 1477–1488. [Google Scholar]
- 38. Žídek K., Zheng K., Ponseca C. S., Messing M. E., Wallenberg L. R., Chabera P., Abdellah M., Sundström V., Pullerits T., J. Am. Chem. Soc. 2012, 134, 12110–12117. [DOI] [PubMed] [Google Scholar]
- 39. Abdellah M., Marschan R., Zidek K., Messing M. E., Abdelwahab A., Chábera P., Zheng K., Pullerits T., J. Phys. Chem. C 2014, 118, 25802–25808. [Google Scholar]
- 40. Kamat P. V., Christians J. A., Radich J. G., Langmuir 2014, 30, 5716–5725. [DOI] [PubMed] [Google Scholar]
- 41. Al-Ani F. T., Pickett C. J., J. Chem. Soc. Dalton Trans. 1988, 2329–2334. [Google Scholar]
- 42. Felton G. A., Mebi C. A., Petro B. J., Vannucci A. K., Evans D. H., Glass R. S., Lichtenberger D. L., J. Organomet. Chem. 2009, 694, 2681–2699. [Google Scholar]
- 43. Hieber W., Gruber J., Z. Anorg. Allg. Chem. 1958, 296, 91–103. [Google Scholar]
- 44. Bose K. S., Sinn E., Averill B. A., Organometallics 1984, 3, 1126–1128. [Google Scholar]
- 45. Han H. Y., Sheng Z. H., Liang J. G., Mater. Lett. 2006, 60, 3782–3785. [Google Scholar]
- 46.Gaussian 09, Revision E.01, M. J. Frisch, G. W. Trucks, H. B. Schlegel, G. E. Scuseria, M. A. Robb, J. R. Cheeseman, G. Scalmani, V. Barone, B. Mennucci, G. A. Petersson, H. Nakatsuji, M. Caricato, X. Li, H. P. Hratchian, A. F. Izmaylov, J. Bloino, G. Zheng, J. L. Sonnenberg, M. Hada, M. Ehara, K. Toyota, R. Fukuda, J. Hasegawa, M. Ishida, T. Nakajima, Y. Honda, O. Kitao, H. Nakai, T. Vreven, J. A. Montgomery, Jr., J. E. Peralta, F. Ogliaro, M. Bearpark, J. J. Heyd, E. Brothers, K. N. Kudin, V. N. Staroverov, R. Kobayashi, J. Normand, K. Raghavachari, A. Rendell, J. C. Burant, S. S. Iyengar, J. Tomasi, M. Cossi, N. Rega, J. M. Millam, M. Klene, J. E. Knox, J. B. Cross, V. Bakken, C. Adamo, J. Jaramillo, R. Gomperts, R. E. Stratmann, O. Yazyev, A. J. Austin, R. Cammi, C. Pomelli, J. W. Ochterski, R. L. Martin, K. Morokuma, V. G. Zakrzewski, G. A. Voth, P. Salvador, J. J. Dannenberg, S. Dapprich, A. D. Daniels, Ö. Farkas, J. B. Foresman, J. V. Ortiz, J. Cioslowski, D. J. Fox, Gaussian, Inc., Wallingford CT, 2009.
- 47. Becke A. D., J. Chem. Phys. 1993, 98, 5648–5652. [Google Scholar]
- 48. Lee C., Yang W., Parr R. G., Phys. Rev. B 1988, 37, 785–789. [DOI] [PubMed] [Google Scholar]