Abstract
La3B6O13(OH) was obtained by a high‐pressure/high‐temperature experiment at 6 GPa and 1673 K. The compound crystallizes in the space group P21 (no. 4) with the lattice parameters a=4.785(2), b=12.880(4), c=7.433(3) Å, and β=90.36(10)°, and is built up of corner‐ as well as edge‐sharing BO4 tetrahedra. It represents the first acentric high‐pressure borate containing these B2O6 entities. The compound develops borate layers of „sechser“‐rings with the La3+ cations positioned between the layers. Single‐crystal and powder X‐ray diffraction, vibrational and MAS NMR spectroscopy, second‐harmonic generation (SHG) and thermoanalytical measurements, as well as computational methods were used to affirm the proposed structure and the B2O6 entities.
Keywords: high-pressure chemistry, lanthanum borate, NMR spectroscopy, nonlinear optics, vibrational spectroscopy
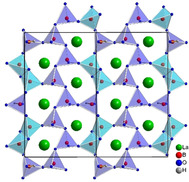
Sharing is caring: La3B6O13(OH) was obtained via a high‐pressure/high‐temperature route at 6 GPa and 1673 K. The compound represents the first acentric borate displaying the rare feature of edge‐sharing BO4 tetrahedra. SHG measurements reveals a significant signal; further characterizations were carried out by NMR and vibrational spectroscopy, thermoanalytical analysis, and computational methods.
Introduction
Through the application of high pressure during a chemical reaction, astonishing new structural features in the reaction product can be accomplished. Thus, edge‐sharing BO4 tetrahedra were observed for the first time in 2002 by Huppertz and von der Eltz in the high‐pressure borate Dy4B6O15.1 This was a remarkable discovery, because in 1960, it was postulated by Edwards, Ross,2 and Christ,3 that BO3 groups and BO4 tetrahedra can exclusively be connected through common corners. In contrast, the formation of B2S2, Si2S2, Si2Se2, and Si2Te2 rings is not unusual in the higher homologues of boron, and also in the silicon chalcogenides B2S3,4, 5, 6 SiS2,7 SiSe2,7 and SiTe2.8 Reasons for their occurrence are the lower ionicity and considerably larger distances inside the four‐membered rings.1 Even though the structural chemistry of oxoborates is in several aspects analogous to that of oxosilicates, no edge‐sharing SiO4 tetrahedra were found to date. One publication on „fibrous SiO2“ described Si2O2 rings forming infinite strands,9 but these results could not be verified.
Since then, several other borates containing edge‐sharing BO4 tetrahedra have been discovered under high‐pressure, like α‐RE 2B4O9 (RE=Y, Sm‐Ho),10, 11, 12 HP‐MB2O4 (M=Fe, Co, Ni),13, 14, 15 HP‐KB3O5,16 and HP‐CsB5O8,17 and also under ambient and hydrothermal conditions, like in KZnB3O6,18, 19 Li4Na2CsB7O14,20 β‐CsB9O14,21 and α‐Ba3[B10O17(OH)2].22
For the characterization and validation of the edge‐sharing BO4 tetrahedra in Dy4B6O15, Raman spectroscopy is an eligible method because it features two sharp bands for the B2O6 group in the range between ≈1200 and 1450 cm−1, that is, at positions where normally no signals appear in this substance class. Calculations made for HP‐CsB5O9 confirmed the assignment of these vibrational bands to the edge‐sharing BO4 tetrahedra.17 Furthermore, the possible existence of this structural feature in borate and borosilicate glasses is of great interest in the glass community and makes characterization by solid‐state NMR spectroscopy inevitable. Due to the fact that most of the compounds containing edge‐sharing BO4 tetrahedra are paramagnetic, NMR data for this structural motif are still rare. The first NMR spectroscopic measurements were performed on HP‐KB3O5,16 and the ambient pressure compound KZnB3O6,18, 19 proving that the formation of B2O6 groups is not limited to extreme pressure conditions. According to the NMR data for both compounds, the authors concluded that although there are distinguishable signals, it is probably not possible to detect tetrahedra condensed to edge‐sharing units on the basis of 11B chemical shift data.
Moreover, the extension of structural features in borate chemistry may give rise to various new compounds with interesting properties, as oxoborates are already known for example, for their potential as materials for second‐harmonic generation (SHG). The search for non‐linear optical (NLO) materials in the field of borates led to various discoveries, including β‐BaB2O4 (BBO),23 LiB3O5 (LBO),24 CsB3O5 (CBO),25 CsLiB6O10 (CLBO),26, 27 and YCa4O(BO3)3 (YCBO).28 In the area of deep‐UV NLO crystals, a breakthrough was achieved with the discovery of KBe2BO3F2 (KBBF),29 which represents the first material being able to generate coherent light by direct SHG at wavelengths below 200 nm. Additionally, functional layered borate materials closely related to KBBF were found to reveal a very large SHG response.30
In this work, we present La3B6O13(OH), the first acentric high‐pressure borate that features edge‐sharing BO4 tetrahedra. The compound was characterized by IR, Raman‐, and solid‐state NMR spectroscopy, to provide further data for the determination of the B2O6 group. Additionally, calculations and measurements of the NLO characteristics have been performed. Generally, BO3 groups and cyclic 3B rings are believed to be beneficial for SHG properties due to their planar and asymmetrical shape. Despite solely consisting of corner‐ and edge‐sharing BO4 tetrahedra, La3B6O13(OH) exhibits a significant SHG signal.
Results and Discussion
Crystal structure
The title compound crystallizes in the acentric space group P21 (no. 4) with the lattice parameters a=4.785(2), b=12.880(4), c=7.433(3) Å, β=90.36(10)° and V=458.13(3) Å3. The crystallographic data and important refinement parameters can be found in Table 1. The positional and anisotropic displacement parameters are given in the Supporting Information in Tables S1 and S2, respectively.
Table 1.
Crystal data and structure refinement of La3B6O13(OH).
|
Empirical formula |
La3B6O13(OH) |
|
molar mass [g mol−1] |
706.60 |
|
crystal system |
monoclinic |
|
space group |
P21 (no. 4) |
|
single‐crystal diffractometer |
Bruker D8 QUEST PHOTON 100 |
|
T [K] |
285(2) |
|
radiation |
MoKα (λ=71.07 pm) |
|
a [Å] |
4.785(2) |
|
b [Å] |
12.880(4) |
|
c [Å] |
7.433(3) |
|
β [°] |
90.36(10) |
|
V [Å3] |
458.13(3) |
|
Z |
2 |
|
calculated density [g cm−3] |
5.122 |
|
absorption coeff. [mm−1] |
13.837 |
|
F(000) |
628 |
|
Crystal size [mm3] |
0.030×0.030×0.030 |
|
θ range [°] |
2.74–43.31 |
|
index ranges |
‐9≤h≤9, −24≤k≤24, −14≤l≤14 |
|
reflections collected |
50785 |
|
independent reflections |
6882 [R int =0.0254] |
|
refinement method |
full‐matrix least‐squares on F 2 |
|
data/restraints/parameters |
6882/1/214 |
|
goodness‐of‐fit on F 2 |
1.068 |
|
final R1/wR2 indices [I≥2σ(I)] |
0.0162/0.0378 |
|
final R1/wR2 indices (all data) |
0.0176/0.0383 |
|
largest diff. peak/ hole [e Å−3] |
2.09/−1.02 |
|
Flack parameter |
0.402(2) |
The anionic framework of the structure is built up of layers in the bc plane (Figure 1). Within these layers, the BO4 tetrahedra are connected by corners, as well as common edges, and develop irregular shaped „sechser“‐rings. The expression „sechser“‐ring was coined by F. Liebau, who derived the term from the German word “sechs” which means “six” for a ring with six tetrahedral centers (B).31 There are three crystallographically different „sechser“‐rings, two of them contain one B2O6 group each (edge‐sharing BO4 tetrahedra) and the remaining ring contains two separate halves of the B2O6 groups. Additionally, each ring has one hydrogen atom H1 bound to the O12 atom. These hydrogen atoms form hydrogen bonds towards the O9 atoms within the layer, as depicted in Figure 2. The corresponding bond lengths and angles are shown in Table 2.
Figure 1.
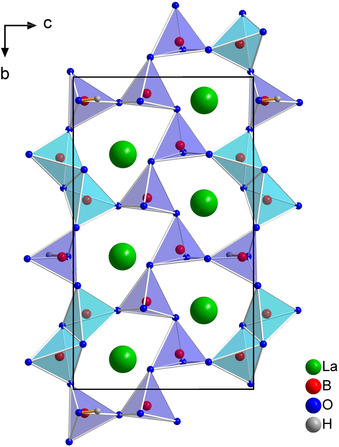
Crystal structure of La3B6O13(OH) depicted along [ 0 0]. The corner‐ and edge‐sharing BO4 tetrahedra form layers of irregular shaped „sechser“ rings.
Figure 2.
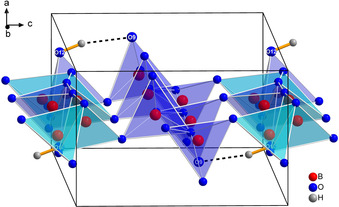
One layer of La3B6O13(OH) depicted along [0 1 0]. The hydrogen atoms form hydrogen bonds towards the oxygen atom O9 within the layer.
Table 2.
Hydrogen bond lengths and angle for La3B6O13(OH).
|
Atoms |
d(O−H) [Å] |
d(H⋅⋅⋅O) [Å] |
d(O⋅⋅⋅O) [Å] |
∡(OHO) [°] |
|---|---|---|---|---|
|
O12−H1⋅⋅⋅O9 |
0.83 |
1.78 |
2.59 |
164 |
Edge‐sharing BO4 tetrahedra are a rather rarely observed structural motif in borates. To the best of our knowledge, the presented compound is the first acentric high‐pressure borate featuring this structural motif and, moreover, also the first borate, where the two boron atoms inside the edge‐sharing BO4 tetrahedra are not crystallographically equivalent. Figure 3 shows the bond lengths and angles inside the B2O6 dimers of La3B6O13(OH). As expected, the bond lengths inside the B2O2 ring (1.502–1.507 Å) are larger than those outside the ring (1.448–1.474 Å) and the O‐B‐O angles inside the B2O2 ring (92.5° and 92.7°) differ significantly from the ideal tetrahedra angle, to maximize the distance of the two central boron atoms. The B⋅⋅⋅B distance inside the edge‐sharing tetrahedra of La3B6O13(OH) is 2.077 Å and, therefore, corresponds well with the values in already known high‐pressure borates such as Dy4B6O15 (2.072 Å), α‐Gd2B4O9 (2.04 Å), and HP‐NiB2O4 (2.088 Å).1, 11, 13 Higher B⋅⋅⋅B distances were found, for example, in HP‐KB3O5 (2.21 Å)16 and HP‐CsB5O8 (2.17 Å),17 where the oxygen atoms forming the common edge are coordinated by a third boron atom and not a metal cation, as in the aforementioned compounds with smaller B⋅⋅⋅B distances. All B−O distances and O‐B‐O angles can be gathered from Table 3 and Table 4.
Figure 3.
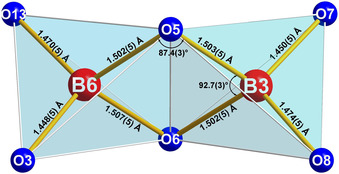
Bond lengths and angles within the edge‐sharing BO4 tetrahedra in La3B6O13(OH).
Table 3.
Interatomic B−O distances [Å] for La3B6O13(OH) (standard deviations in parentheses).
|
B1 |
‐O1 |
1.459(3) |
B2 |
‐O11 |
1.456(4) |
B3 |
‐O7 |
1.450(5) |
|
|
‐O4 |
1.469(3) |
|
‐O14 |
1.469(3) |
|
‐O8 |
1.474(5) |
|
|
‐O3 |
1.482(3) |
|
‐O7 |
1.490(4) |
|
‐O6 |
1.502(5) |
|
|
‐O2 |
1.509(3) |
|
‐O4 |
1.505(3) |
|
‐O5 |
1.503(5) |
|
Ø |
|
1.480 |
Ø |
|
1.48 |
Ø |
|
1.482 |
|
B4 |
‐O9 |
1.458(3) |
B5 |
‐O10 |
1.466(2) |
B6 |
‐O3 |
1.448(5) |
|
|
‐O2 |
1.476(3) |
|
‐O12 |
1.473(2) |
|
‐O13 |
1.470(5) |
|
|
‐O10 |
1.487(3) |
|
‐O8 |
1.484(5) |
|
‐O5 |
1.503(5) |
|
|
‐O14 |
1.503(3) |
|
‐O13 |
1.487(5) |
|
‐O6 |
1.507(5) |
|
Ø |
|
1.481 |
Ø |
|
1.478 |
Ø |
|
1.482 |
Table 4.
Bond angles [°] for La3B6O13(OH) (standard deviations in parentheses).
|
O3‐B1‐O2 |
105.4(2) |
O11‐B2‐O4 |
105.6(2) |
O6‐B3‐O5 |
92.7(3) |
|
O1‐B1‐O2 |
106.6(2) |
O7‐B2‐O4 |
106.8(2) |
O8‐B3‐O5 |
108.3(3) |
|
O1‐B1‐O4 |
109.7(2) |
O14‐B2‐O4 |
109.6(2) |
O7‐B3‐O6 |
109.2(3) |
|
O4‐B1‐O2 |
110.2(2) |
O11‐B2‐O14 |
110.5(2) |
O7‐B3‐O8 |
112.6(3) |
|
O4‐B1‐O3 |
110.7(2) |
O14‐B2‐O7 |
110.6(2) |
O7‐B3‐O5 |
115.9(3) |
|
O1‐B1‐O3 |
114.1(2) |
O11‐B2‐O7 |
113.5(2) |
O8‐B3‐O6 |
116.7(3) |
|
Ø |
109.5 |
Ø |
109.4 |
Ø |
109.3 |
|
O9‐B4‐O14 |
106.1(2) |
O10‐B5‐O13 |
106.7(3) |
O5‐B6‐O6 |
92.5(3) |
|
O10‐B4‐O14 |
107.5(2) |
O8‐B5‐O13 |
107.4(2) |
O3‐B6‐O5 |
108.0(3) |
|
O2‐B4‐O14 |
109.6(2) |
O10‐B5‐O8 |
109.3(3) |
O13‐B6‐O6 |
109.0(3) |
|
O9‐B4‐O2 |
110.3(2) |
O12‐B5‐O8 |
110.4(3) |
O3‐B6‐O13 |
113.2(3) |
|
O2‐B4‐O10 |
110.8(2) |
O12‐B5‐O13 |
111.2(3) |
O6‐B6‐O6 |
114.7(3) |
|
O9‐B4‐O10 |
112.4(2) |
O10‐B5‐O12 |
111.7(2) |
O13‐B6‐O54 |
117.9(3) |
|
Ø |
109.5 |
Ø |
109.5 |
Ø |
109.2 |
The three crystallographically independent lanthanum cations are located between the borate layers and in the middle of the „sechser“‐rings. The metal atoms La1 and La3 are nine‐fold coordinated by oxygen, while La2 is ten‐fold coordinated (see Figure 4). The La−O distances range from 2.401 to 2.831 Å, which is in the same range as in other high‐pressure lanthanum borates like γ‐La(BO2)3 (2.40–3.04 Å),32 δ‐La(BO2)3 (2.45–3.10 Å),33 and La2B8O15 (2.33–2.85 Å).34 All interatomic La−O distances are listed in Table S3.
Figure 4.
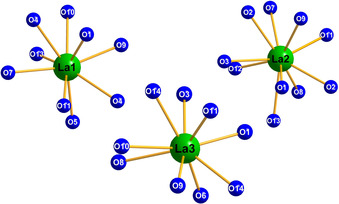
Coordination of the three crystallographically independent La3+ cations in La3B6O13(OH).
Furthermore, the charge distributions were calculated according to the bond‐length/bond‐strength (BLBS; ΣV),35, 36 as well as the CHARDI concept (ΣQ).37 The values obtained by both methods can be found in Table S4 and fit well to the expected formal oxidation state of +3 for lanthanum and boron, +1 for hydrogen, and −2 for oxygen. To support the position of the hydrogen atom, we also calculated the charge of the oxygen atom O12 without the bonded hydrogen atom. The unsatisfying resulting values of −1.14 and −1.18 for the two calculation methods both confirm the presented position of the hydrogen atom in the crystal structure.
CCDC 1963844 contains the supplementary crystallographic data for La3B6O13(OH). These data are provided free of charge by The Cambridge Crystallographic Data Centre through the CCDC/FIZ Karlsruhe deposition service.
X‐ray powder diffraction
The comparison between the experimental and the theoretical powder pattern derived from the single‐crystal structure is depicted in Figure 5. La3B6O13(OH) is clearly the major phase in the powder pattern; only very few other reflections can be spotted, marked with an asterisk. These additional reflections stem from a so far unknown side phase.
Figure 5.
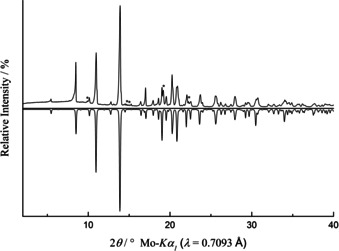
Comparison of the experimental X‐ray powder diffraction data (Mo radiation, λ=0.7093 Å; top) with the theoretical X‐ray powder pattern calculated from the single‐crystal data (bottom). Reflections marked with an asterisk derive from an unknown impurity.
Electronic structure and optical properties
The calculated band gap by using GGA (Figure 6 a) is 5.91 eV with an indirect characteristic. We also used the HSE06 functional to estimate a band gap of about 7.42 eV, which indicates that La3B6O13(OH) can transmit to the deep‐UV region. The partial density of states (PDOS) of La3B6O13(OH) is presented in Figure 6 b and shows that the valence bands (VBs) are occupied mainly by O 2p orbitals, slightly hybridized with the B 2p and H 1s orbitals. In contrast, the conduction bands (CBs) originate mainly from O 2p, B 2s2p and La 5d orbitals, while the top of the VB and the bottom of the CB are occupied mainly by O 2p, B 2p and La 5d6s orbitals.
Figure 6.
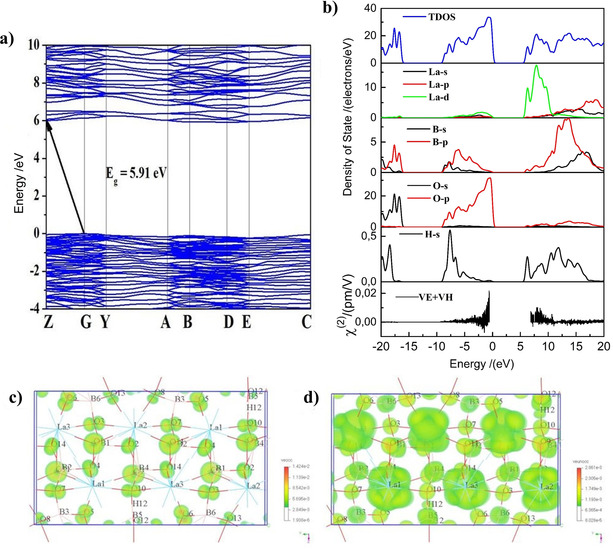
a) Electronic band structure; b) partial density of states and band‐resolved analysis of SHG; SHG density maps of the c) VE occupied and d) VE unoccupied orbitals.
Under the restriction of Kleinman's symmetry, La3B6O13(OH) has four independent and non‐zero SHG coefficients. The calculated SHG coefficients of La3B6O13(OH) are d 16=0.998, d 22=−0.567, d 23=0.255, and d 14=−0.00267 pm V−1. The calculated value of d 16 is about 2.6 times that of KDP (KH2PO4). The band‐resolved analysis for the second‐order susceptibility χ (2) can characterize the optical nonlinearity of crystals as shown in Figure 6 b. The main response regions concentrate in the range from −5 to 0 eV in the VBs and 7.5 to 10 eV in the CBs, which is contributed by O 2p, B 2s2p, and La 5d. Therefore, the B−O and La−O groups of La3B6O13(OH) make the main contributions to the NLO properties. Moreover, the SHG density analysis38 was used to analyse the reason for NLO‐active electron states and units. Figures 6 c and 6 d show the SHG density of VE occupied (veocc) and unoccupied (veunocc) states. In the occupied state, B and O make the obvious contributions to the SHG effect. For the unoccupied state, La and O make main contributions for the SHG effect, but also B, O, and H. These results indicate that the La−O and B−O−H groups are the main contributors for the significant SHG response of La3B6O13(OH). Obviously, the large SHG effect in La3B6O13(OH) mainly originates synergistically from the [B6O13(OH)] group and the La−O group.
The calculated birefringence of La3B6O13(OH) is 0.03 at 1064 nm as shown in Figure S1, which is attributed mainly to the structural anisotropy from covalent groups.39
Vibrational spectroscopy
Figure 7 shows the IR spectrum of La3B6O13(OH) between 600 and 4000 cm−1. In the upper range above 3000 cm−1, the expected O−H vibrations can be seen. In general, absorption bands in the region of 800 to 1200 cm−1 can be assigned to the tetrahedrally coordinated BO4 group, as known for π‐YBO3, TaBO4, γ‐Ln(BO2)3 (Ln=La‐Nd), and δ‐La(BO2)3.32, 33, 40, 41 The absorption bands observed in the range between 1200 and 1500 cm−1 are typical for triangular BO3 groups. Since there are no BO3 groups in the crystal structure of La3B6O13(OH), these absorptions are related to the corresponding B‐O‐B, O‐B‐O, and B‐O‐La vibrations, which has been verified for the oxoborates β‐ZnB4O7 and β‐CaB4O7 by ab initio quantum chemical calculations.42
Figure 7.
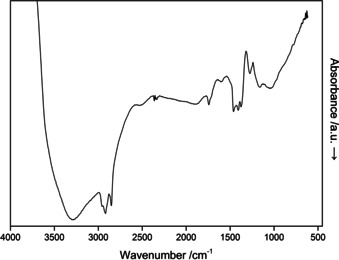
IR spectrum of a La3B6O13(OH) single‐crystal.
The spikes at 2800–2950 cm−1 and at 1700 cm−1 stem from the oil which was used to prepare the crystals.
The single‐crystal Raman spectrum of La3B6O13(OH) is shown in Figure 8 in the range of 200 to 1600 cm−1. The two sharpest bands in the spectrum are located at ṽ=1295 and 1438 cm−1. Normally, this range corresponds to the stretching vibrations of BO3 or OB3 groups. Since the investigated compound does not contain trigonal coordinated boron or threefold‐coordinated oxygen atoms, these peaks are assumed to be the Raman‐active modes of the B2O6 unit of the edge‐sharing BO4 tetrahedra. Similar bands were found in the Raman spectra of other compounds featuring edge‐sharing BO4 tetrahedra, for example in Dy4B6O15 (1271 and 1435 cm−1), α‐Gd2B4O9 (1253 and 1431 cm−1), and HP‐NiB2O4 (1262 and 1444 cm−1).1, 11, 13 In contrast to that, the high‐pressure borate HP‐KB3O5 and the compound KZnB3O6, which was synthesized under ambient conditions, exhibit only one signal for the edge‐sharing BO4 tetrahedra and miss the vibrational band at around 1400 cm−1. This difference to the previously discussed compounds originates presumably in the increased boron coordination of the oxygen atoms forming the common edge of the B2O6 unit.16, 18
Figure 8.
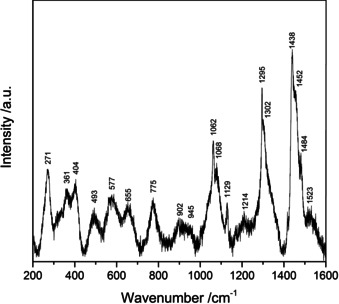
Raman spectrum of a La3B6O13(OH) single‐crystal.
Vibrational bands in the range of 620–1200 cm−1 can be assigned to the BO4 stretching vibrations, while BO4 bending vibrations can be seen at ṽ<900 cm−1. Below ṽ=400 cm−1, the La−O stretching modes occur, as well as complex lattice vibrations.43
Second‐harmonic generation measurements
The SHG properties of the La3B6O13(OH) sample were investigated with the powder SHG method developed by Kurtz and Perry.44 This method is commonly used as a first step to estimate the NLO properties of new materials or to detect the absence of an inversion center in crystalline structures.
Table 5 shows the intensity of the SHG signal of the sample in comparison to several reference compounds (α‐Al2O3, Quartz, KDP). The ratio of the sample signal and the reference signal of quartz provides an estimation of the effective SHG coefficient.
Table 5.
SHG intensity of a La3B6O13(OH) powder sample compared with the three reference materials.
|
Compound |
SHG Intensity [mV] |
I SHG/I Quartz*100 % |
|---|---|---|
|
α‐Al2O3 |
0.2 (0.2) |
0.6 |
|
Quartz |
31.0 (9.9) |
100 |
|
KDP (KH2PO4) |
296.9 (31.1) |
958 |
|
La3B6O13(OH) |
19.7 (17.6) |
63 |
The recommended standard values of references are d 11 = 0.30 pm V−1 for the quartz and d 14 = 0.39 pm V−1 for KDP at 1064 nm.45 Although both reference crystals (KDP and quartz) have comparable SHG coefficients, phase matching of KDP provides one order higher SHG signals than non‐phase matchable crystals such as quartz. In the case of phase matching, we are expecting the same order of SHG intensities like KDP for La3B6O13(OH). However, the SHG intensity of La3B6O13(OH) yielded around 20 mV, which is ≈2/3 the intensity of quartz. On the basis of calculated SHG coefficients and the measured SHG signal we can suppose that La3B6O13(OH) is a non‐phase matchable crystal. Additionally, the relatively large Flack parameter of 0.402, determined in the structure analysis, can also be related to the considerably reduced SHG response in contrast to the calculated SHG coefficients. Nevertheless, the notable SHG signal indicates that the sample La3B6O13(OH) clearly crystallizes in a non‐centrosymmetric space group. The SHG intensities of La3B6O13(OH) have a very large standard deviation due to large intensity differences from different area. One possible reason for the difference between calculated and measured SHG values can be the difference between grain sizes of the sample and references. Grain size dependence of SHG signals was not carried out here.
Solid‐state NMR spectroscopy
The 11B and 1H MAS NMR spectra recorded for La3B6O13(OH) powders are depicted in Figures 9 a and 9 b. The 11B NMR spectrum shows two peaks at about 2 and 17 ppm. The peak at 17 ppm exhibits the typical second‐order quadrupolar shape, which is more pronounced for the 600 MHz spectrometer and narrows for the spectrum collected on the 1.0 GHz instrument, as this interaction scales inversely with the external magnetic field. Its quadrupolar coupling constant, C Q, is estimated to be about 2.4 MHz with an asymmetry close to 0. This C Q and isotropic shift are typical for trigonal BO3 16, 46 and since this peak's intensity is small (less than 5 %), we assign it to an impurity containing trigonal BO3 units. The main peak at 2 ppm, together with its significantly smaller second‐order quadrupolar broadening, is typical for BO4 tetrahedral groups. The spectral resolution, even for the 1.0 GHz spectrometer, is not sufficient to resolve the expected six crystallographically inequivalent boron sites. Lineshape analyses of the first‐order satellites (Figure S2) suggest C Q values smaller than 500 kHz for all BO4 units. This is in line with quantum mechanical calculations on the DFT level (Table S5), where predicted isotropic chemical shifts differ only by 0.5 ppm and the C Q values are between 200 and 500 kHz.
Figure 9.
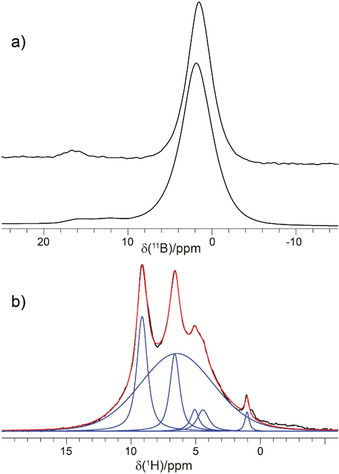
a) 11B MAS NMR spectra of La3B6O13(OH) at 1.0 GHz (top) and 600 MHz (bottom) recorded with spinning speeds of 40 and 20 kHz, respectively. b) 1H MAS NMR spectrum (black) at 600 MHz and a spinning speed of 62.5 kHz along with a deconvolution (blue) and resulting line shape (red).
In contrast to the expected single resonance for the OH group within La3B6O13(OH), the 1H MAS NMR spectrum (Figure 9 b) shows a surprisingly rich spectral signature with two main sharp resonances at 9.2 and 6.6 ppm. Additionally, one broad signal at 6.5 ppm, typical for an amorphous side phase, and three weak peaks at 1.0, 4.5, and 5.1 ppm were observed. To derive connectivities, 2D 1H‐11B HETCOR (Figure 10) and 1H‐1H DQ‐SQ correlation (Figure S3) NMR spectra were recorded. Only 1H NMR signals at 9.2, 6.6, and 6.5 ppm are correlated to 11B NMR resonances, rendering all other proton resonances (1.0, 4.5, and 5.1 ppm) to signals originating from boron‐free impurities. While the amorphous side phase at 6.5 ppm mostly consists of BO4 units, the resonance at 6.6 ppm correlates with both BO4 and BO3 species. Since La3B6O13(OH) does not contain any BO3, this peak is also assigned to impurities. This leaves the resonance at 9.2 ppm for the OH group present in the structure. The assignment is corroborated by the 1H‐1H DQ‐SQ spectrum (Figure S3), which shows that almost all the resonances exhibit self‐correlations only. This is characteristic for 1H signals originating from different phases. In line with the low proton density for La3B6O13(OH), the self‐correlation for the resonance at 9.2 ppm is weak. The significantly higher intensities for the other self‐correlations suggest a higher proton density for the impurities and the amorphous side phase. Without actual knowledge about the proton densities of the side phases, an estimate of their content is not possible from the NMR data.
Figure 10.
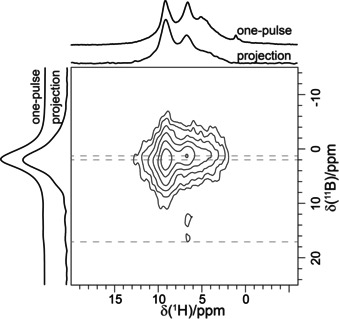
2D 1H−11B d‐HMQC correlation spectrum at 600 MHz. The spinning speed was adjusted to 62.5 kHz.
To conclude, the 11B and 1H NMR results are in agreement with the proposed structure model obtained from XRD, but indicate the presence of both amorphous and crystalline impurities. The relatively high shift of 9.2 ppm for the protons of the OH units confirms a medium strong hydrogen bond interaction to neighboring oxygen atoms.
Thermal behavior
To study the high‐temperature stability, thermoanalytical measurements of La3B6O13(OH) were performed. Figure 11 depicts the results from the thermogravimetric (TG), the differentiated thermogravimetric (DTG) analyses, and the differential thermal analysis (DTA) recorded from room temperature to 970 °C. Until approximately 150 °C, a mass increase can be observed. This most likely results from the small initial weight and consequential correction effects. La3B6O13(OH) is stable up to 708.2 °C, visible as an endothermic peak in the DTG curve. This is in good agreement with the HT‐XRD data (see Figure 12), where the slow decomposition of the compound starts around 710–720 °C. Furthermore, additional reflections appear in the powder patterns above this temperature, which can be assigned to λ‐LaBO3. At approximately 850 °C, La3B6O13(OH) decomposes completely and only λ‐LaBO3 as the main phase, besides another unknown compound, is visible.
Figure 11.
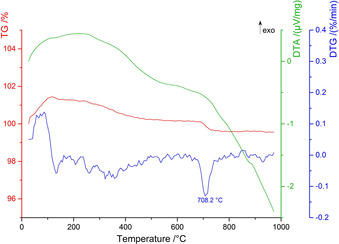
The simultaneous thermal analysis (STA) of La3B6O13(OH) with the thermogravimetric (TG) curve in red, the differentiated thermogravimetric (DTG) curve in blue, and the differential thermal analysis (DTA) curve in green.
Figure 12.
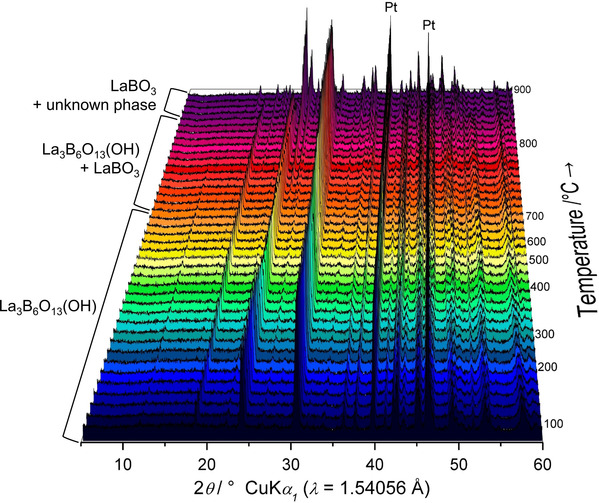
HT‐XRD of La3B6O13(OH) with representation of the range the respective compound occurs. La3B6O13(OH) decomposes starting from about 720 °C up to 850 °C. After this temperature, λ‐LaBO3 and at least one additional unknown phase is present. The platinum reflections stem from the heating band.
Conclusions
La3B6O13(OH) represents the first acentric high‐pressure borate containing edge‐sharing BO4 tetrahedra and, to the best of our knowledge, the first borate, where the two boron atoms inside these tetrahedra are not crystallographically equivalent. The anionic borate backbone builds up layers of „sechser“‐rings in the bc plane. The lanthanum cations are located between the layers and in the middle of the „sechser“‐rings.
The SHG measurements of La3B6O13(OH) yielded a significant signal and confirmed the acentric space group from the single‐crystal structure determination. Additional calculations, 11B MAS NMR investigations, and the results from the vibrational spectroscopy also support the described crystal structure and the existence of the structural motif of edge‐sharing BO4 tetrahedra.
Experimental Section
Synthesis: For the synthesis of La3B6O13(OH), a homogeneous mixture of La2O3 (Strem Chemicals, Newburyport, USA, 99.9 %) and H3BO3 (Carl Roth, Karlsruhe, Germany, >99.8 %) in the stoichiometric ratio of 1:4 was filled into a Pt‐capsule, placed into a crucible made of α‐BN and closed with a lid (also α‐BN; Henze Boron Nitride Products AG, Germany). The compression and heating were carried out in a Walker‐type multianvil module combined with a 1000 t hydraulic press (both Max Voggenreiter GmbH, Germany). The 18/11 assembly was compressed in a two‐step mechanism by six steel wedges (outer anvils) and by eight tungsten carbide cubes (inner anvils; Hawedia, Marklkofen, Germany). A detailed description of this setup can be found in the literature.47, 48, 49
The assembly was compressed to 6 GPa in 150 minutes and heated to 1673 K in the following 10 minutes. The temperature was kept for 10 minutes, before the heating was switched off to quench the sample to room temperature. Afterwards, the 450 minute decompression process started. The product was separated mechanically from the surrounding platinum foil and the microcrystalline colorless La3B6O13(OH) was recovered.
To receive single‐crystal platelets, the sample had to be compressed to higher pressures above 12 GPa and slowly cooled down to 773 K in two to three hours. Using this scheme, measurable single crystals could be received. Unfortunately, the received product was not phase pure and the unknown side phases could not be quantified.
Single‐crystal structure analysis: The single‐crystal intensity data were collected at 213 K with a Bruker D8 Quest Kappa diffractometer equipped with a Photon 100 CMOS detector. Monochromatized MoKα radiation (λ=0.7107 Å) was generated with an Incoatec microfocus X‐ray tube and a multilayer optic. A multiscan absorption correction of the intensity data was performed with sadabs 2014/5,50 and for the structure solution and parameter refinement, the shelxs/l‐201351, 52 software implemented in wingx‐2013.353 was used. During the refinement, the acentric space group P21 (no. 4) was found to be correct after initial attempts to solve the structure in the higher symmetric space group P21/m (no. 11). To emphasize the regularity of the structure solution, the addsym routine of the program platon 54 was performed, which found no additional symmetry operations within the final structure solution. With a Flack parameter of 0.402 the crystal was refined as a two‐component inversion twin. All non‐hydrogen atoms were refined with anisotropic displacement parameters. The final positional parameters were standardized employing structure tidy, [55] as implemented in platon.
X‐ray powder diffraction: The microcrystalline sample of La3B6O13(OH) was analyzed on a Stoe Stadi P powder diffractometer (STOE & Cie GmbH, Darmstadt, Germany) in transmission geometry with Ge(111)‐monochromatized Mo radiation (λ=70.93 pm). The reflections were detected with a Dectris Mythen 1 K microstrip detector. The measurement was performed in the 2θ range of 2–52° with a step size of 0.015°.
Computational methods: The density functional theory (DFT) was used to study the electronic structure and optical properties of La3B6O13(OH).56 The generalized gradient approximation (GGA)57 with Perdew–Burke–Ernzerhof (PBE)58 functional and norm‐conserving pseudopotentials (NCP) were applied under the geometry optimization. A plane‐wave cutoff energy of 750 eV and the Monkhorst–Pack k‐point mesh (6×2×4) were chosen to achieve a well converged electronic structure and optical properties. Moreover, NLO coefficients at a zero frequency were calculated by using a formalism developed by Aversa and Sipe.57 At a zero frequency, the formula of second‐order NLO coefficients can be derived as Eq. (1), (2), (3):60
| (1) |
| (2) |
| (3) |
Here, α, β, γ are Cartesian components, v and v’ represent valence bands, c and c’ represent conduction bands. P(αβγ) represents the full permutation, and ħω ij and P ij α represent the band energy difference and the momentum matrix elements, respectively.
Quantum‐chemical calculations for the solid‐state NMR spectroscopy were also performed using the plain‐wave density functional theory (DFT) program CASTEP56 version 17.2.
Based on the structure solution, a geometry optimization with a cutoff energy of 1200 eV was performed. The optimization used the Broyden–Fletcher–Goldfarb–Shanno (BFGS) algorithm.61, 62, 63, 64 K‐Points were determined by a Monkhorst–Pack grid,65 with a maximum distance of 0.07 Å−1, resulting in 6 k‐points for the calculations. For the geometry‐optimized structure, the same parameters were used to calculate tensors of the chemical shielding and the quadrupolar interaction using the GIPAW approach.66
Vibrational spectroscopy: The single‐crystal absorption spectrum of La3B6O13(OH) was acquired using a Bruker Vertex 70 FT‐IR spectrometer (spectral resolution 4 cm−1) equipped with KBr beam splitter, a mercury cadmium telluride (MCT) detector and a coupled Bruker Hyperion 3000 microscope. The single‐crystal was placed on a BaF2 carrier and measured in transmittance mode in the spectral range 600–4000 cm−1. A Globar mid‐IR source was used as well as a 15× IR objective. 320 scans of the sample were recorded and corrected for atmospheric effects with the opus 6.5 software.67
The Raman spectrum of a La3B6O13(OH) single‐crystal was measured using a Horiba Jobin Yvon LabRam HR‐800 microspectrometer. The excitation of the sample was accomplished with a 532 nm frequency‐doubled 100 mW neodymium‐doped yttrium aluminum garnet (Nd:YAG) laser that was focused on the sample surface with an Olympus 50× objective lens. An optical grating with 1800 lines mm−1 was used to disperse the scattered light, which was then collected by a cooled Andor CCD detector with 1024×256 pixels. Three spectra with an acquisition time of 40 s each were analyzed in the 200–1600 cm−1 Raman shift range in multi‐window acquisition mode and averaged with the labspec software (version 5.93.20).68 The spectra were recorded at ambient conditions and the background was corrected with an eighth‐order polynomial line‐segment function.
Second‐harmonic generation measurements: Second‐harmonic generation (SHG) measurements were performed on a powder sample of La3B6O13(OH). A Q‐switched Nd:YAG laser (1064 nm, 5–6 ns, 2 kHz) was used for the generation of the fundamental pump wave. With a harmonic separator, a short‐pass filter and an interference filter, the fundamental infrared light was separated from the generated second harmonic (532 nm). The generated SHG signal was collected on eleven different areas of the sample to check its homogeneity. On each position 64 pulses were measured and averaged. The measured intensities were background‐corrected by signals collected between the laser pulses. As reference materials α‐Al2O3, quartz and KDP (KH2PO4) were used.
A detailed description of the experimental setup for the powder SHG measurement is given by Bayarjargal et al.69
Solid‐state NMR spectroscopy: 11B MAS NMR spectroscopic experiments were measured on Bruker Avance III HD spectrometers at B 0 fields of 14.1 T (600 MHz) and 23.4 T (1.0 GHz) corresponding to 11B Larmor frequencies of 192.6 and 320.9 MHz, respectively. The samples were spun at 20–62.5 kHz in a 1.3 mm MAS double resonance probe (Bruker). The 11B NMR spectrum was acquired by single pulse excitation with a pulse of 1.0 μs having a small flip angle of about 10° and with a recycle delay of 1.0 s. The spectra are referenced to boron trifluoride etherate (BF3 ⋅Et2O) using NaBH4 as a secondary reference (−42.06 ppm).70 The 1H MAS NMR spectrum was recorded at a 1H frequency of 600.1 MHz, with a spinning of 62.5 kHz, a 90° pulse of 1.4 μs and with a recycle delay of 300 s. The 1H‐11B HETCOR NMR spectrum was acquired at a B 0 field 14.1 T, with a MAS of 62.5 kHz using the d‐HMQC sequence71, 72 with a SR4 recoupling73 of 256 μs. Finally, the 1H‐1H DQ‐SQ experiment was obtained at a 1H frequency of 600.1 MHz, with a spinning of 62.5 kHz and using the symmetry‐based R122 5 recoupling74 with each R element being a 180° pulse and with a total DQ excitation/reconversion time of 64.0 μs.
Thermoanalytical investigations: The simultaneous thermal analysis (STA) of the La3B6O13(OH) sample was carried out on a netzsch STA 449 F5 instrument. This enables the differential thermal analysis (DTA) to be performed simultaneously with a thermogravimetric analysis (TGA). Sample weight, mass increase/decrease, and thermal information can be provided continuously throughout the heating process. A difference in the heat flow (DTA) between the sample and the reference is detected as an exothermic or endothermic signal inside the sample. 10.66 mg of the sample were weighed into an Al2O3 crucible and heated from 25 °C to 1000 °C under air with a heating rate of 10 °C min−1.
High temperature XRD: A panalytical Empyrean powder diffractometer in theta–theta geometry was employed to collect the high‐temperature X‐ray diffraction patterns of La3B6O13(OH). The diffractometer is equipped with a Cu tube (tension: 40 kV; current: 40 kV) and a pixcel 1D detector. Furthermore, a variable divergence slit with an irradiated length of 6 mm was used. The powder sample was applied on a platinum strip (thickness: 1 mm) and measured under air in an Anton Paar HTK 16n high temperature strip‐heater chamber in the temperature range from 25 °C to 900 °C.
Conflict of interest
The authors declare no conflict of interest.
Supporting information
As a service to our authors and readers, this journal provides supporting information supplied by the authors. Such materials are peer reviewed and may be re‐organized for online delivery, but are not copy‐edited or typeset. Technical support issues arising from supporting information (other than missing files) should be addressed to the authors.
Supplementary
Acknowledgements
We thank K. Wurst for helping with the refinement of the single‐crystal diffraction data, F. Ruegenberg for the IR measurements and R. Stalder for granting us access to the FTIR spectrometer.
B. Fuchs, G. Heymann, X. Wang, A. Tudi, L. Bayarjargal, R. Siegel, A. Schmutzler, J. Senker, B. Joachim-Mrosko, A. Saxer, Z. Yang, S. Pan, H. Huppertz, Chem. Eur. J. 2020, 26, 6851.
Contributor Information
Birgit Fuchs, http://www‐c724.uibk.ac.at/aac/.
Prof. Dr. Hubert Huppertz, Email: hubert.huppertz@uibk.ac.at.
References
- 1. Huppertz H., von der Eltz B., J. Am. Chem. Soc. 2002, 124, 9376–9377. [DOI] [PubMed] [Google Scholar]
- 2. Edwards J. O., Ross V., J. Inorg. Nucl. Chem. 1960, 15, 329–337. [Google Scholar]
- 3. Christ C. L., Am. Mineral. 1960, 45, 334–340. [Google Scholar]
- 4. Conrad O., Jansen C., Krebs B., Angew. Chem. Int. Ed. 1998, 37, 3208–3218. [DOI] [PubMed] [Google Scholar]
- 5. Diercks H., Krebs B., Angew. Chem. 1977, 89, 327–328. [Google Scholar]
- 6. Krebs B., Hamann W., Z. Kristallogr. 1983, 162, 149–150. [Google Scholar]
- 7. Peters J., Krebs B., Acta Crystallogr. Sect. B 1982, 38, 1270–1272. [Google Scholar]
- 8. Weiss A., Weiss A., Z. Naturforsch. B 1953, 8, 104. [Google Scholar]
- 9. Weiss A., Weiss A., Z. Anorg. Allg. Chem. 1954, 276, 95–112. [Google Scholar]
- 10. Emme H., Huppertz H., Acta Crystallogr. Sect. C 2005, 61, i29–i31. [DOI] [PubMed] [Google Scholar]
- 11. Emme H., Huppertz H., Chem. Eur. J. 2003, 9, 3623–3633. [DOI] [PubMed] [Google Scholar]
- 12. Schmitt M. K., Huppertz H., Z. Naturforsch. Sect. B 2017, 72, 977–982. [Google Scholar]
- 13. Knyrim J. S., Roessner F., Jakob S., Johrendt D., Kinski I., Glaum R., Huppertz H., Angew. Chem. Int. Ed. 2007, 46, 9097–9100; [DOI] [PubMed] [Google Scholar]; Angew. Chem. 2007, 119, 9256–9259. [Google Scholar]
- 14. Neumair S. C., Glaum R., Huppertz H., Z. Naturforsch. Sect. B 2009, 64, 883–890. [Google Scholar]
- 15. Neumair S. C., Kaindl R., Huppertz H., Z. Naturforsch. Sect. B 2010, 65, 1311–1317. [Google Scholar]
- 16. Neumair S. C., Vanicek S., Kaindl R., Többens D. M., Martineau C., Taulelle F., Senker J., Huppertz H., Eur. J. Inorg. Chem. 2011, 4147–4152. [Google Scholar]
- 17. Sohr G., Többens D. M., Schmedt auf der Günne J., Huppertz H., Chem. Eur. J. 2014, 20, 17059–17067. [DOI] [PubMed] [Google Scholar]
- 18. Wu Y., Yao J.-Y., Zhang J.-X., Fu P.-Z., Wu Y.-C., Acta Crystallogr. Sect. E 2010, 66, i45. [DOI] [PMC free article] [PubMed] [Google Scholar]
- 19. Jin S., Cai G., Wang W., He M., Wang S., Chen X., Angew. Chem. Int. Ed. 2010, 49, 4967–4970; [DOI] [PubMed] [Google Scholar]; Angew. Chem. 2010, 122, 5087–5090. [Google Scholar]
- 20. Mutailipu M., Zhang M., Li H., Fan X., Yang Z., Jin S., Wang G., Pan S., Chem. Commun. 2019, 55, 1295–1298. [DOI] [PubMed] [Google Scholar]
- 21. Han S., Huang C., Tudi A., Hu S., Yang Z., Pan S., Chem. Eur. J. 2019, 25, 11614–11619. [DOI] [PubMed] [Google Scholar]
- 22. Jen I. H., Lee Y.-C., Tsai C.-E., Lii K.-H., Inorg. Chem. 2019, 58, 4085–4088. [DOI] [PubMed] [Google Scholar]
- 23. Chen C., Wu B., Jiang A., You G., Sci. Sin. Ser. B (Engl. Ed.) 1985, 28, 235–243. [Google Scholar]
- 24. Chen C., Wu Y., Jiang A., Wu B., You G., Li R., Lin S., J. Opt. Soc. Am. B 1989, 6, 616–621. [Google Scholar]
- 25. Wu Y., Sasaki T., Nakai S., Yokotani A., Tang H., Chen C., Appl. Phys. Lett. 1993, 62, 2614–2615. [Google Scholar]
- 26. Tu J.-M., Keszler D. A., Mater. Res. Bull. 1995, 30, 209–215. [Google Scholar]
- 27. Mori Y., Kuroda I., Nakajima S., Sasaki T., Nakai S., Appl. Phys. Lett. 1995, 67, 1818–1820. [Google Scholar]
- 28. Iwai M., Kobayashi T., Furuya H., Mori Y., Sasaki T., Jpn. J. Appl. Phys. 1997, 36, L276–L279. [Google Scholar]
- 29. Mei L., Wang Y., Chen C., Wu B., J. Appl. Phys. 1993, 74, 7014–7015. [Google Scholar]
- 30. Ok K. M., Chem. Commun. 2019, 55, 12737–12748. [DOI] [PubMed] [Google Scholar]
- 31.F. Liebau, Structural Chemistry of Silicates: Structure, Bonding, and Classification, Springer Science & Business Media, 2012.
- 32. Emme H., Despotopoulou C., Huppertz H., Z. Anorg. Allg. Chem. 2004, 630, 2450–2457. [Google Scholar]
- 33. Heymann G., Soltner T., Huppertz H., Solid State Sci. 2006, 8, 821–829. [Google Scholar]
- 34. Glätzle M., Hoerder G. J., Huppertz H., Z. Naturforsch. Sect. B 2016, 71, 535–542. [Google Scholar]
- 35. Brown I. D., Altermatt D., Acta Crystallogr. Sect. B 1985, 41, 244–247. [Google Scholar]
- 36. Brese N. E., O'Keeffe M., Acta Crystallogr. Sect. B 1991, 47, 192–197. [Google Scholar]
- 37. Hoppe R., Voigt S., Glaum H., Kissel J., Müller H. P., Bernet K., J. Less-Common Met. 1989, 156, 105–122. [Google Scholar]
- 38. Zhang B. B., Shi G. Q., Yang Z. H., Zhang F. F., Pan S. L., Angew. Chem. Int. Ed. 2017, 56, 3916–3919; [DOI] [PubMed] [Google Scholar]; Angew. Chem. 2017, 129, 3974–3977. [Google Scholar]
- 39. Lei B. H., Yang Z. H., Pan S. L., Chem. Commun. 2017, 53, 2818–2821. [DOI] [PubMed] [Google Scholar]
- 40. Laperches J. P., Tarte P., Spectrochim. Acta 1966, 22, 1201–1210. [Google Scholar]
- 41. Blasse G., van de Heuvel G. P. M., Phys. Status Solidi A 1973, 19, 111–117. [Google Scholar]
- 42. Kaindl R., Sohr G., Huppertz H., Spectrochim. Acta Part A 2013, 116, 408–417. [DOI] [PubMed] [Google Scholar]
- 43. Haberer A., Kaindl R., Oeckler O., Huppertz H., J. Solid State Chem. 2010, 183, 1970–1979. [Google Scholar]
- 44. Kurtz S. K., Perry T. T., J. Appl. Phys. 1968, 39, 3798–3813. [Google Scholar]
- 45. Roberts D. A., IEEE J. Quantum Electron. 1992, 28, 2057–2074. [Google Scholar]
- 46. Mackenzie K. J. D., Smith M. E., Multinuclear solid-state NMR of inorganic materials, Vol. 1, Elsevier Science Ltd., Kidlington, Oxford, UK, 2002. [Google Scholar]
- 47. Walker D., Carpenter M. A., Hitch C. M., Am. Mineral. 1990, 75, 1020–1028. [Google Scholar]
- 48. Walker D., Am. Mineral. 1991, 76, 1092–1100. [Google Scholar]
- 49. Huppertz H., Z. Kristallogr. 2004, 219, 330–338. [Google Scholar]
- 50.G. M. Sheldrick, Bruker AXS Inc., Madison, Wisconsin, USA, 2001.
- 51. Sheldrick G. M., Acta Crystallogr. Sect. A 2008, 64, 112–122. [DOI] [PubMed] [Google Scholar]
- 52. Sheldrick G. M., Acta Crystallogr. Sect. C 2015, 71, 3–8. [DOI] [PMC free article] [PubMed] [Google Scholar]
- 53. Farrugia L. J., J. Appl. Crystallogr. 2012, 45, 849–854. [Google Scholar]
- 54. Spek A. L., Acta Crystallogr. Sect. D 2009, 65, 148–155. [DOI] [PMC free article] [PubMed] [Google Scholar]
- 55. Gelato L. M., Parthé E., J. Appl. Crystallogr. 1987, 20, 139–143. [Google Scholar]
- 56. Clark S. J., Segall M., Pickard C. J., Hasnip P., Probert M., Refson K., Payne M. C., Z. Kristallogr. 2005, 220, 567–570. [Google Scholar]
- 57. Rappe A., Rabe K., Kaxiras E., Joannopoulos J. D., Phys. Rev. B 1990, 41, 1227–1230. [DOI] [PubMed] [Google Scholar]
- 58. Perdew J. P., Burke K., Ernzerhof M., Phys. Rev. Lett. 1996, 77, 3865–3868. [DOI] [PubMed] [Google Scholar]
- 59. Aversa C., Sipe J. E., Phys. Rev. B 1995, 52, 14636–14645. [DOI] [PubMed] [Google Scholar]
- 60. Zhang B. B., Lee M. H., Yang Z. H., Jing Q., Pan S. L., Zhang M., Wu H. P., Su X., Li C. S., Appl. Phys. Lett. 2015, 106, 031906. [Google Scholar]
- 61. Broyden C. G., IMA J. Appl. Math. 1970, 6, 76–90. [Google Scholar]
- 62. Fletcher R., Comput. J. 1970, 13, 317–322. [Google Scholar]
- 63. Goldfarb D., Math. Comp. 1970, 24, 23–26. [Google Scholar]
- 64. Shanno D. F., Math. Comp. 1970, 24, 647–656. [Google Scholar]
- 65. Monkhorst H. J., Pack J. D., Phys. Rev. B 1976, 13, 5188–5192. [Google Scholar]
- 66. Pickard C. J., Mauri F., Phys. Rev. B 2001, 63, 245101. [Google Scholar]
- 67.Bruker, Billerica, MA, 2008.
- 68.Horiba Jobin Yvon GmbH, Bensheim, 2005.
- 69. Bayarjargal L., Winkler B., Haussühl E., Boehler R., Appl. Phys. Lett. 2009, 95, 061907. [Google Scholar]
- 70. Weiss J. W. E., Bryce D. L., J. Phys. Chem. A 2010, 114, 5119–5131. [DOI] [PMC free article] [PubMed] [Google Scholar]
- 71. Cavadini S., Lupulescu A., Antonijevic S., Bodenhausen G., J. Am. Chem. Soc. 2006, 128, 7706–7707. [DOI] [PubMed] [Google Scholar]
- 72. Gan Z., J. Am. Chem. Soc. 2006, 128, 6040–6041. [DOI] [PubMed] [Google Scholar]
- 73. Brinkmann A., Kentgens A. P. M., J. Am. Chem. Soc. 2006, 128, 14758–14759. [DOI] [PubMed] [Google Scholar]
- 74. Levitt M. H., in Encyclopedia of Nuclear Magnetic Resonance. Volume 9, Advances in NMR (Eds.: D. M. Grant, R. K. Harris), Wiley, 2002, pp. 165–196. [Google Scholar]
Associated Data
This section collects any data citations, data availability statements, or supplementary materials included in this article.
Supplementary Materials
As a service to our authors and readers, this journal provides supporting information supplied by the authors. Such materials are peer reviewed and may be re‐organized for online delivery, but are not copy‐edited or typeset. Technical support issues arising from supporting information (other than missing files) should be addressed to the authors.
Supplementary


