

Version Changes
Revised. Amendments from Version 1
The first author's name was printed as Muhammad Butt in the first published version of the manuscript. His first name is Ejaz, and the last name is Butt. I have corrected this in the revised manuscript. The NGS analysis reported here is for a single case, as suggested by both referees, we have modified the statement for specimen collection in the revised manuscript in the ‘Methods’ section. As suggested by the 2 nd reviewer, we have indicated tumor tissue content of the FFPE block used in this investigation in the ‘Methods’ section. The 1 st referee had asked to add additional correlation analysis by analyzing TCGA or other bioinformatics-based data for the signature molecules in the context of grade III ependymoma. As suggested, we have searched various databases including ‘The Cancer Genome Atlas’ (TCGA), in cBioportal database, ICGC data portal, in the NCI's Genomic Data Commons (GDC) portal, and in NCI supported Clinical Trials portal, and a relevant section of this summary is included in the revised manuscript in the ‘Discussion’ section. The tumor type we described in this study is a rare tumor, and specifically, in many databases, it is not listed separately except in the ‘Integrative onco-genomics’ database (https://www.intogen.org). Both referees had suggested commenting on the FLT3 novel synonymous variant, we have added this in the ‘Discussion’ section. Also, in the ‘response to referees’ files, we have explained for their comments in detail. In the modification process, we have added 7 new references in the revised-manuscript, and citations are rearranged. As suggested by the reviewer-1 the corrections are made in figure-2, and a new with figure legend is added in the revised manuscript.
Abstract
Background: Ependymomas are glial tumors derived from differentiated ependymal cells. In contrast to other types of brain tumors, histological grading is not a good prognostic marker for these tumors. In order to determine genomic changes in an anaplastic ependymoma, we analyzed its mutation patterns by next generation sequencing (NGS).
Methods: Tumor DNA was sequenced using an Ion PI v3 chip on Ion Proton instrument and the data were analyzed by Ion Reporter 5.6.
Results: NGS analysis identified 19 variants, of which four were previously reported missense variants; c.395G>A in IDH1, c.1173A>G in PIK3CA, c.1416A>T in KDR and c.215C>G in TP53. The frequencies of the three missense mutations ( PIK3CA c.1173A>G, KDR c.1416A>T, TP53, c.215C>G) were high, suggesting that these are germline variants, whereas the IDH1 variant frequency was low (4.81%). However, based on its FATHMM score of 0.94, only the IDH1 variant is pathogenic; other variants TP53, PIK3CA and KDR had FATHMM scores of 0.22, 0.56 and 0.07, respectively. Eight synonymous mutations were found in FGFR3, PDGFRA, EGFR, RET, HRAS, FLT3, APC and SMAD4 genes. The mutation in FLT3 p.(Val592Val) was the only novel variant found. Additionally, two known intronic variants in KDR were found and intronic variants were also found in ERBB4 and PIK3CA. A known splice site mutation at an acceptor site in FLT3, a 3’-UTR variant in the CSF1R gene and a 5’_UTR variant in the SMARCB1 gene were also identified. The p-values were below 0.00001 for all variants and the average coverage for all variants was around 2000x.
Conclusions: In this grade III ependymoma, one novel synonymous mutation and one deleterious missense mutation is reported. Many of the variants reported here have not been detected in ependymal tumors by NGS analysis previously and we therefore report these variants in brain tissue for the first time.
Keywords: Ependymoma, Palisading necrosis, Perivascular psuedorossettes, Ion Proton, Next Generation DNA sequencing, Glioma, pediatric brain tumors, Anaplastic Ependymoma
Introduction
Ependymal cells are macroglial cells which line the ventricles, the central canal of the spinal cord and form the blood-cerebrospinal fluid barrier, being involved in producing the cerebrospinal fluid 1, 2. These tumors account for only 4–8% of gliomas and, after astrocytomas and oligodendrogliomas, ependymomas are the least common 3. Nearly one-third of brain tumors in patients younger than three years old are ependymomas and constitute around 5%–9% of all neuroepithelial malignancies 1, 4. These tumors are also found in the choroid plexus and may occur at any age, from one month to 81 years and without any gender preference 5. In pediatric cases, the location of the tumor is intracranial, while adult ependymal tumors can have either an intracranial or a spinal localization 6, 7. The prognosis is better in older children as compared to young infants but nonetheless, in children with intracranial ependymomas, event-free survival after five years is less than 50% 8. In adults, about 50% to 60% intracranial ependymomas are supratentorial; however, pediatric supratentorial ependymomas account for 25% to 35% of all ependymomas 5, 9. Adults present better prognosis with a 5-year survival of around 90%, while in the pediatric population it is around 60%. The five-year survival rate for supratentorial, infratentorial, and spinal cord ependymomas is 62%, 85%, and 97%, respectively, and for grade I, II, and III spinal cord ependymomas the five-year overall survival rate is 92%, 97% and 58%, respectively 10– 12.
Ependymoma tumors are well circumscribed, soft, tan-red masses and may be associated with hemorrhage. Their microscopic appearance shows hypercellularity and distinct infiltrative margins with surrounding parenchyma, consisting of monomorphic cells with nuclear atypia and brisk mitotic activity. They may also have intramural or glomeruliod vascular proliferation, pseudopalisading necrosis, perivascular pseudo rosettes (5–10% cases), calcifications and hyalinized vessels 1. Other diagnostic hallmarks include areas of fibrillary and regressive changes such as myxoid degeneration, palisading necrotic areas and the formation of true rosettes, composed of columnar cells arranged around a central lumen 1, 6. Immunologically, they are positive for epithelial membrane antigen (EMA), glial fibrillary acidic protein (GFAP) and S-100. According to the 2016 updated World Health Organization (WHO) classification of brain tumors, ependymomas are divided into 4 types on the basis of histologic appearance: (1) grade I subependymomas, (2) grade I myxopapillary ependymomas, (3) grade II ependymomas, (4) grade II or III RELA fusion-positive ependymomas and grade III anaplastic ependymomas 13, 14.
Previous studies have shown the use of comparative genomic hybridization (CGH) arrays to distinguish intracranial ependymomas from spinal ependymomas 15. In contrast to other types of brain tumors, histological grading is not a good prognostic marker for outcome for ependymomas 16, 17. Several gene expression studies have been helpful in differentiating between intracranial and extra cranial ependymomas, but have not had clinical significance in directing therapy and their role in tumor origin and prognosis is not clear 18, 19. Studies using cDNA micro-arrays have shown that gene expression patterns in ependymomas correlate with tumor location, grade and patient age 20. Cytogenetic studies have shown that chromosomal abnormalities are relatively common in ependymomas 21. Loss of 22q has been the commonest abnormality found in ependymoma and, in some other tumors, gain of 1q or loss of 6q was observed 21, 22.
To date, there is a lack of information regarding the mutational signatures which distinguish the various subgroups of ependymomas. Another ependymoma cohort study found very few mutations and gene amplifications but a high expression of multi-drug resistance, DNA repair and synthesis enzymes 23. Intracranial ependymomas differ from spinal ependymomas in the expression of these proteins, and protein expression is also dependent on the ependymoma grade 23. For both intracranial and spinal ependymomas, very few mutations were reported by using whole exome sequencing 24. In another study, profiling of NGS mutations was carried out for one case of grade II ependymoma using a GlioSeq panel, which contains a total of 30 genes 25. In order to determine the mutational patterns of grade III anaplastic ependymoma, we have sequenced DNA from this ependymoma tumor using the Ion Proton system for next generation DNA sequencing with the Ion Torrent’s AmpliSeq cancer HotSpot panel. This panel contains 50 genes, only 15 of which also appear in the GlioSeq panel used in previous research. These data provided an evaluation of mutational signatures of this anaplastic ependymoma which differs from the previous two studies, but confirms their conclusions about finding very few mutations in cancer driver genes, helping to direct diagnosis and therapy for ependymomal tumors.
Methods
Ethical statement
This study was performed in accordance with the principles of the Declaration of Helsinki. This study was approved by the Institutional Review Board (IRB) bioethics committee of King Abdullah Medical City (KAMC), Makkah, Kingdom of Saudi Arabia (IRB number 14-140). A written informed consent was obtained from the parent of this patient before starting the study.
Clinical specimen
The single patient’s tumor tissue (FFPE sections in PCR tubes) used in this NGS analysis was obtained from the histopathology laboratory of Al-Noor Specialty Hospital Makkah, after tumor excision and left frontal craniotomy in the neurosurgery department. The tumor content of the FFPE tissues was around 70–80%. The tumor was classified based upon similarity to the constituent cells of the central nervous system, such as astrocytes, oligodendrocytes and ependymal, glial cells, mitosis and cell cycle-specific antigens, used as markers to evaluate proliferation activity and biological behavior (the WHO grading system) 13. The final diagnosis was made following radiological, histopathological and immunological examinations.
Radiology and histopathological analysis
A CT scan of the brain was performed by a multi-slice CT (MSCT), using a 64-detector-row scanner. The use of computed tomography (CT) allowed visualization of detailed images of the soft tissues in the body in 3D as well as in multiplanar reconstructions. Images were acquired with 5mm slice thickness throughout on a GE Medical Systems, light speed VCT, 64-slice multidetector CT (MDCT). High quality images were processed at low dose performance on Volara™ digital DAS (Data Acquisition System).
The excised tumor was fixed in 4% buffered formaldehyde, routinely processed and paraffin embedded. Four-micrometer-thick sections were prepared on clear ground glass microscope slides with ground edges and routinely stained using Dako Reagent Management System (DakoRMS) with hematoxylin and eosin (H and E) on a Dako Coverstainer (Agilent). For immunohistochemistry, sections were collected on Citoglas adhesion microscope slides ( Citotest). Mouse monoclonal beta-catenin (14) (Sigma-Aldrich, cat. no. 224M-1), mouse monoclonal EMA (E29) (Sigma-Aldrich, cat. no. 247M-9), rabbit monoclonal EGFR (SP84) (Cell Marque, cat. no. 414R-16-ASR), mouse monoclonal Vimentin (vim 3B4) (Ventana-Roche, cat. no. 760-2512), GFAP EP672Y rabbit monoclonal (Ventana-Roche, cat. no. 760-4345) and E-cadherin (36) mouse monoclonal (Ventana-Roche, cat. no. 790-4497) and mouse monoclonal anti-Ki-67 (Leica Biosystems, cat. no. KI67-MM1-L-CE) antibodies were used for immunohistochemistry. Briefly, the tissue sections were deparaffinized with EZ Prep (Ventana, cat. no. 950-102) at 60°C for 1 hr. Immunohistochemistry was performed with the Ventana BenchMark XT automated stainer (Ventana, Tucson, AZ). After inactivation of the endogenous peroxidase using a UV-inhibitor for 4 min at 37°C, the primary antibody was added for 16 min at 37°C, followed by the application of HRP Universal Multimer for 8 min, and detected using the ultraView Universal DAB Detection Kit (cat. no. 760-500) for 38 min. Slides were counterstained with hematoxylin for 8 min and bluing reagent for 4 min before mounting with cover slips. Following staining, images were acquired using NIKON Digital Microscope Camera - DS-Ri1, with image software NIS Elements v.4.0. Appropriate positive controls for all of the studied antibodies were used.
DNA isolation and NGS analysis
DNA isolation was carried out using the QIAamp DNA FFPE Kit (50), Cat. No. 56404. 5-10 Formalin-Fixed Paraffin-Embedded sections of 5 microns were deparaffinized using xylene, treated with ethanol to remove the xylene, and the pellet was dried at 65°C for 5 mins. The pellets were resuspended in ATL buffer then treated with proteinase K. The remaining steps were carried out according to the user manuals. DNA concentration was measured using Nanodrop2000C and 10 ng of DNA was used for NGS analysis. DNA was sequenced using the Ion PI v3 Chip Kit (Cat no. A25771, Thermo Fisher Scientific, USA) with the Ion Proton System (Cat no. 4476610, Thermo Fisher Scientific, USA) 26. Libraries were prepared using Ion AmpliSeq cancer HotSpot Panel v1 (Cat no. 4471262, Thermo Fisher Scientific, USA) primer pools. The Ion AmpliSeq Library Kit 2.0 (Cat no. 4475345, Thermo Fisher Scientific, USA) and Ion PI Hi-Q OT2 200 Kit (Cat no. A26434, Thermo Fisher Scientific, USA) was used for library and template preparation respectively. Sequencing was carried out using Ion PI Hi-Q Sequencing 200 Kit (Cat no. A26433, Thermo Fisher Scientific, USA) reagents and libraries were tagged with Ion Express Barcode Adapters 1-16, Cat. No. 4471250 (Thermo Fisher Scientific, USA). After sequencing, amplicon sequences were aligned to the human reference genome GRCh37 (hg19) (Accession no. GCA_000001405.1) in the target region of the cancer HotSpot panel using the Torrent Suite Software v.5.0.2 (Thermo Fisher Scientific, USA). Variant call format files (vcf files) were generated by running the Torrent Variant Caller Plugin v5.2. Variant calling and creation of vcf files can also be carried out using non-proprietary software such as SAMtools 27 or VarScan2 28, which also provide coverage analysis. The vcf file data were analyzed using Ion Reporter v5.6 (ThermoFisher Scientific, USA), which calculated allele coverage, allele frequency, allele ratio, variant impact, clinical significance, PolyPhen 2 scores, Phred scored, SIFT scores, Grantham scores and FATHMM scores. This vcf file analysis was also carried out by Advaita Bioinformatics’ iVariantGuide. PolyPhen2, SIFT, variant impact and clinical significance can be calculated using non-proprietary software SnpEff 29 and SnpSift 30. FATHMM scores can also be predicted using fathmm 31 and Grantham scores according to the formula as described in Grantham, 1974 32. The heat map was generated by the clustering of predicted variant impact scores by Ion Reporter v5.6. The most deleterious score was picked for every gene to generate the heat map; thereafter, hierarchical clustering was conducted. The color codes indicate the following variant impacts using score values 0-8: (0) unknown; (1) synonymous; (2) missense; (3) non-frameshift block substitution; (4) non-frameshift indel; (5) nonsense; (6) stop-loss; (7) frameshift block substitution or indel; (8) splice variant.
Results
Clinical presentation and radiology
A six-year-old female patient presented with a history of right facial palsy for few months with ataxia and right-sided weakness. The patient had a chronic headache, vomiting and had repeatedly been treated for sinusitis. Unenhanced computed tomography (CT) of the brain was performed ( Figure 1, panels A, B and C). A large lesion (5.4 × 7.5cm) was noticed in the left cerebral frontoparietal region. There was an indication of a predominant cystic component and large, eccentric clump of coarse calcification. Additionally, mass effect resulting in midline shift, along with mild scalloping of the internal cortex of the parietal bone, was noted. No hydrocephalic changes or intrinsic hemorrhagic focus were seen ( Figure 1).
Figure 1. Grade III ependymoma unenhanced computed tomography (CT) of the brain.

A large lesion (5.4 × 7.5cm) in the left cerebral frontoparietal location with predominantly cystic components (panel A, green arrow), and a large, eccentric clump of coarse calcification (panel B; yellow arrow). Mass effect and mid line shift (panel C, red arrow) can also be seen. No hydrocephalic changes or intrinsic active hemorrhagic focus were observed.
Histopathological examination revealed sheets of neoplastic cells with round to oval nuclei and abundant granular chromatin. A variable dense fibrillary background and endothelial proliferation was also noted. Hematoxylin and eosin (H&E) staining results are shown in Figure 2 and Figure 3. Panels A and B of Figure 2 show the tumor exhibiting delicate cytoplasmic processes, perivascular rosettes characteristic of ependymoma, focal calcification areas and pseudo palisading necrosis, characterized by a garland-like structure of hypercellular tumor nuclei lining up around irregular foci of tumor necrosis. Panel C shows glomeruloid vascular proliferation and panel D shows extensive palisading necrosis and true rosette formation. The exhibition of a true rosette with a central lumen and the formation of pseudo-palisading necrotic areas is also clear from Figure 3 (panel A). Panel B shows focal areas with numerous tumor giant cells and the presence of brisk mitotic activity, vascular formation and pseudo-palisading necrotic areas. Formation of true rosettes surrounding the microvascular proliferation within ependymal tumors usually signifies anaplastic transformation, which is characteristic of grade III ependymoma (panels C and D). Immunostaining is shown in Figure 4: (A) Ki-67 stain shows a high proliferation index, (B) vimentin positive, (C) GFAP positive, (D) EMA showing punctate cytoplasmic (perinuclear dot-like positivity) staining which is fairly diagnostic of ependymal tumor cells. Figure 5 shows beta-catenin positive (panels A and B) and E-cadherin positive (panels C and D) immunostaining, with both membranous and true rosette-like structures clearly visible in this staining. EGFR staining was negative (see Underlying data) 33.
Figure 2. Hematoxylin and eosin (H&E) staining showing anaplastic ependymoma features.

( A) Focal calcification areas (blue arrow), and perivascular pseudo-rosettes (white arrow). ( B) Pseudo palisading necrosis, characterized by a garland-like structure of hypercellular tumor nuclei (black arrow) lining up around irregular foci of tumor necrosis (blue arrow). ( C) The cellular tumor exhibiting glomeruloid vascular proliferation (black arrows). ( D) Extensive palisading necrosis (green arrows) and true rosettes (yellow arrows).
Figure 3. Hematoxylin and eosin (H&E) staining showing anaplastic ependymoma features.

( A) Pseudo palisading necrotic areas, exhibiting true rosettes with central lumen (yellow arrow). ( B) Focal areas with numerous tumor giant cells and the presence of a brisk mitotic activity (green arrows). ( C) Tumor with vascular formation (yellow arrows) and pseudo palisading necrotic areas. ( D) Formation of true rosettes (green arrows) surrounding the microvascular proliferation within ependymal tumors, usually signifies anaplastic transformation which is characteristic of ependymomas.
Figure 4. Photomicrographs of Ki-67, vimentin, GFAP, and EMA immunostaining of the ependymal tumor.

( A) Ki-67 immunostaining indicates a high proliferation index in the tumor (70%). ( B) Vimentin stain is positive. ( C) GFAP stain is positive. ( D) EMA stain is positive and shows punctate cytoplasmic (perinuclear dot-like) staining, fairly diagnostic of the ependymal nature of the tumor cells.
Figure 5. Photomicrographs of beta-Catenin and E-Cadherin immunostaining of the ependymal tumor.

Immunostaining is strongly positive for beta-Catenin (panel A 20x, panel B 40x) and true rosettes (red arrows) and palisading cells (blue arrow) are clearly visible. E-Cadherin stain is also positive in this tumor. Red and blue arrows indicate tumor cells arranged in true rossettes and formation of palisading structures, respectively (panel C 20x, panel D 40x).
NGS data analysis variant identification and variant statistics
Alignment to the target regions (CHP2. 20131001.designed) of the reference genome (hg 19) was performed by the Ion Torrent Suite software v.5.0.2. For this tumor, NGS generated 6,252,341 mapped reads using the Ion PI v3 Chip, with more than 90% reads on target. Amplicon and target base read coverages for the sequencing are shown in Table 1. All 207 amplicons were sequenced with Ion AmpliSeq Cancer HotSpot Panel primer pool. As shown in Table 1, for this sample sequencing the uniformity of amplicon coverage was 95.17%, and the uniformity of base coverage on target was 94.81%. The average reads per amplicon was 34, 179, and the average target base coverage depth was 31,771. 100% of amplicons had at least 500 reads and the percentage of amplicons read end-to-end was 89.37% ( Table 1). Initial analysis by the Ion Reporter 5.6 program found that a total of 1652 variants passed all filters. Initial analysis by Advaita’s iVariantGuide software showed 100% (1633) of variants passed all filters (see Extended data) 33. The filter flags signify variants which do not meet certain criteria during variant calling. The flags refer to the quality or confidence of the variant call. The parameters of flags were read in from the input vcf file. If a variant passes all filters, it is marked as having passed. Six hundred and fifteen variants were identified using a filter for clinical significance that identifies drug response, likely to be pathogenic and pathogenic variants. The distribution of these variants, based on chromosomal position, region within the gene, variant class, functional class, variant impact and clinical significance, are shown in doughnut charts A – F ( Figure 6). As shown in doughnut chart A, chromosome 17 has the highest number of variants (26%) and chromosome 8 has lowest number of variants (0.8%). 98.7% of variants are exonic and, according to variant class distribution, 73.8% are SNPs, 70.2% are missense variants, 25.4% are high impact variants and 46.8% are pathogenic. We have considered true mutations to be those with a Phred score above 20 and significant mutations called by Ion Reporter software were those with a p-value below 0.05.
Table 1. Coverage analysis of the tumor DNA sequencing on Ion Proton.
| Amplicon Read Coverage | Target Base Coverage | ||
|---|---|---|---|
| Number of amplicons | 207 | Bases in target regions | 22,027 |
| Percent assigned amplicon reads | 97.53% | Percent base reads on target | 89.69% |
| Average reads per amplicon | 34, 179 | Average base coverage depth | 31,771 |
| Uniformity of amplicon coverage | 95.17% | Uniformity of base coverage | 94.81% |
| Amplicons with at least 1 read | 100% | Target base coverage at 1x | 100% |
| Amplicons with at least 20 reads | 100% | Target base coverage at 20x | 100% |
| Amplicons with at least 100 reads | 100% | Target base coverage at 100x | 100% |
| Amplicons with at least 500 reads | 100% | Target base coverage at 500x | 100% |
| Amplicons with no strand bias | 97.58% | Target bases with no strand bias | 96.35% |
| Amplicons reading end-to-end | 89.37% | Percent end-to-end reads | 86.80% |
Figure 6. iVariant analysis of variant characteristics.

Distribution of variants according to filters, showing characteristics including the relative number of variants located on each chromosome, variant class, substitution type and the functional consequences of each variant, in order to interpret and score the severity and impact of variants and therefore predict the severity of the disease. Doughnut charts in panels shows variants passed for each individual filter for ( A) Chromosomal distribution, ( B) Region in the gene, ( C) Variant class, ( D) Variant effect on the protein structure, ( E) Variant impact on the protein function and ( F) Clinical significance of the variants as annotated on the ClinVar database.
A summary of the all missense mutations found in the grade III tumor is shown in Table 2. In this tumor, NGS data analysis identified 19 variants, of which four were missense mutations, eight were synonymous mutations and seven were intronic variants. Known missense mutation c.395G>A; p.(Arg132His) in exon 4 of the IDH1 gene, c.1173A>G; p.(Ile391Met) in exon 7 of the PIK3CA gene, c.1416A>T; p.(Gln472His) in exon 11 of the KDR gene and c.215C>G; p.(Pro72Arg) in exon 4 of the TP53 gene were found in this tumor. The frequency, allele coverage, allele ratio, p-value and Phred score for these mutations is shown in Table 3. The p-values and Phred scores were significant for all of these mutations. The frequencies of the three missense mutations, namely PIK3CA c.1173A>G, KDR c.1416A>T and TP53 c.215C>G, were high, suggesting that these are germ line variants, whereas the IDH1 variant frequency was low (4.81%). As shown in Table 2, eight synonymous mutations were found in this tumor, in exon 14 of FGFR3 p.(Thr651Thr), exon 12 of PDGFRA p.(Pro566Pro), exon 20 of EGFR p.(Gln787Gln), exon 13 of RET p.(Leu769Leu), exon 2 of HRAS p.(His27His), exon 14 of FLT3 p.(Val592Val), exon 16 of APC p.(Thr1493Thr) and exon 9 of SMAD4 p.(Phe362Phe). The synonymous mutation in FLT3 (c.1776T>C; p.(Val592Val) detected in this tumor was a novel variant, while the other variants were previously reported. Additionally, two known intronic variants were identified in KDR (c.798+54G>A and c.2615-36A>CA) ( Table 2). A known splice site mutation (c.1310-3T>C) at an acceptor site in FLT3 (rs2491231) and a single nucleotide variant in the 3’-UTR of the CSF1R gene (rs2066934) were also identified. Additionally, in SMARCB1 a 5’-UTR variant, and an intronic variant in ERBB4 and PIK3CA respectively were found. In Figure 7, the heat map of the variant impact for each gene is presented. The color gradation from green to red indicates unknown, synonymous, missense, nonsense, and splice variants, based upon their SIFT, PolyPhen2 and Grantham scores. Only variants in four genes had a positive PolyPhen2 score (variants in TP53, PIK3CA, IDH1 and KDR genes had a PolyPhen2 score of 0.083, 0.011, 0127 and 0.003, respectively). However, FATHMM scores for the prediction of the functional consequences of a variant suggest that only the IDH1 variant is pathogenic, with a score of 0.94. As described in the COSMIC data base, FATHMM scores above 0.5 are deleterious, but only scores ≥ 0.7 are classified as pathogenic.
Table 2. Variants found in the grade III ependymoma tumor.
| Chromosomal
Position |
Ref | Observed
Allele |
% Frequency | Gene | Coding | COSMIC/
dbSNP |
AA Change | Exon |
|---|---|---|---|---|---|---|---|---|
| chr2:209113112 | CG | TG | 4.81 | IDH1 | c.395G>A | COSM28746 | p. (Arg132His) | 4 |
| chr2:212812097 | T | C | 100 | ERBB4 | c.421+58A>G | rs839541 | p.? | |
| chr3:178917005 | A | G | 47.97 | PIK3CA | c.352+40A>G | rs3729674 | p.? | |
| chr3:178927410 | A | G | 54.25 | PIK3CA | c.1173A>G | COSM328028 | p. (Ile391Met) | 7 |
| chr4:1807894 | G | A | 100 | FGFR3 | c.1953G>A | rs7688609 | p. (Thr651Thr) | 14 |
| chr4:55141050 | AGCCCAGA | AGCCCGGA | 100.00 | PDGFRA | c.1701A>G | rs1873778 | p. (Pro566Pro) | 12 |
| chr4:55962545 | T | TG | 43.46 | KDR | c.2615-36A>CA | rs34085292 | p.? | |
| chr4:55972974 | T | A | 51.35 | KDR | c.1416A>T | rs1870377
COSM149673 |
p. (Gln472His) | 11 |
| chr4:55980239 | C | T | 98.35 | KDR | c.798+54G>A | rs7692791 | p.? | |
| chr5:112175769 | CGG | CAG | CAG=100 | APC | c.4479G>A | COSM3760869 | p. (Thr1493Thr) | 16 |
| chr5:149433596 | TG | GA | 100 | CSF1R,
HMGXB3 |
c.*1841TG>GA,
c.2954_ 2955delCAinsTC |
rs2066934 | p.? | |
| chr7:55249063 | G | A | 71.04 | EGFR,
EGFR-AS1 |
c.2361G>A | rs1050171 | p. (Gln787Gln) | 20 |
| rs1800861 | G | T | 100 | RET | c.2307G>T | COSM4418405 | p.
(Leu769Leu) |
13 |
| chr11:534242 | A | G | 49.07 | HRAS | c.81T>C | rs12628 | p. (His27His) | 2 |
| chr13:28608280 | A | G | 53.5 | FLT3 | c.1776T>C | Novel | p. (Val592Val) | 14 |
| chr13:28610183 | A | G | 100 | FLT3 | c.1310-3T>C | rs2491231 | p.? | |
| chr17:7579472 | G | C | C=47.94 | TP53 | c.215C>G | rs1042522 | p. (Pro72Arg) | 4 |
| chr18:48591923 | T | C | 63.63 | SMAD4 | c.1086T>C | rs1801250 | p.
(Phe362Phe) |
9 |
| chr22:24176287 | G | A | 52.5 | DERL3,
SMARCB1 |
c.1119-41G>A,
c.*727C>T |
rs5030613 | p.? | 4 |
Table 3. Sequencing quality of variants found in the grade III ependymoma.
| Genes | Coding | Allele Coverage | Allele Ratio | p-value | FATHMM
predication |
Phred
Score |
Coverage
(x) |
|---|---|---|---|---|---|---|---|
| IDH1 | c.395G>A | CG=1900, TG=96 | CG=0.9519, TG=0.0481 | 0.00001 | Pathogenic | 221.064 | 1996 |
| ERBB4 | c.421+58A>G | C=1988 | C=1.0 | 0.00001 | NA | 31774.6 | 1988 |
| PIK3CA | c.352+40A>G | A=1038, G=957 | A=0.5203, G=0.4797 | 0.00001 | NA | 9501.82 | 1995 |
| PIK3CA | c.1173A>G | A=915, G=1085 | A=0.4575, G=0.5425 | 0.00001 | Benign | 11555.8 | 2000 |
| FGFR3 | c.1953G>A | A=1993 | A=1.0 | 0.00001 | Benign | 31840.6 | 1993 |
| PDGFRA | c.1701A>G | AGCCCGGATGGACATG=1941 | AGCCCGGATGGACATG=1.0 | 0.00001 | Benign | 35066.6 | 1941 |
| KDR | c.2615-36A>CA | T=1124, TG=864 | T=0.5654, TG=0.4346 | 0.00001 | NA | 5173.27 | 1988 |
| KDR | c.1416A>T | T=971, A=1025 | T=0.4865, A=0.5135 | 0.00001 | Benign | 10583.1 | 1996 |
| KDR | c.798+54G>A | C=33, T=1965 | C=0.0165, T=0.9835 | 0.00001 | NA | 30286.5 | 1998 |
| APC | c.4479G>A | CAG=1985, | CAG=1.0 | 0.00001 | Benign | 35885.9 | 1985 |
| CSF1R,
HMGXB3 |
c.*1841TG>GA,
c.2954_ 2955delCAinsTC |
GA=1977 | GA=1.0 | 0.00001 | Benign | 31540.7 | 1977 |
| EGFR,
EGFR-AS1 |
c.2361G>A | G=579, A=1420 | G=0.2896, A=0.7104 | 0.00001 | Benign | 17657.6 | 1999 |
| RET | c.2307G>T | T=1996 | T=1.0 | 0.00001 | Benign | 31993.7 | 1996 |
| HRAS | c.81T>C | A=1018, G=981 | A=0.5093, G=0.4907 | 0.00001 | Benign | 11998.4 | 1999 |
| FLT3 | c.1776T>C | A=929, G=1069 | A=0.465, G=0.535 | 0.00001 | NA | 11295.9 | 1998 |
| FLT3 | c.1310-3T>C | G=1998 | G=1.0 | 0.00001 | Benign | 32026.3 | 1998 |
| TP53 | c.215C>G | G=1038, C=956 | G=0.5206, C=0.4794 | 0.00001 | Benign | 11559.2 | 1994 |
| SMAD4 | c.1086T>C | T=727, C=1272 | T=0.3637, C=0.6363 | 0.00001 | Benign | 14836.6 | 1999 |
| DERL3,
SMARCB1 |
c.1119-41G>A,
c.*727C>T |
G=950, A=1050 | G=0.475, A=0.525 | 0.00001 | NA | 13246.6 | 2000 |
Figure 7. Heat Map showing variant impact of each gene detected in the ependymal tumor.
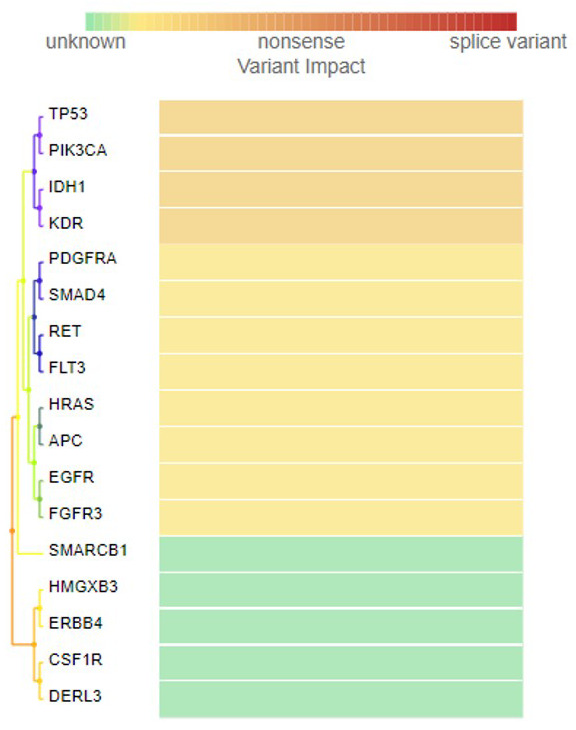
Variant impact takes into account the type of mutation (such as insertion, deletion or frame shift) and considers the location of the variant (intronic or exonic). The color gradation from green to red indicates unknown, synonymous, missense, nonsense and splice variants, calculated based upon their SIFT, PolyPhen2 and Grantham scores.
Discussion
Ependymomas are brain tumors that arise throughout the central nervous system, within the supratentorial areas, the posterior fossa and the spinal cord. Histologic low-grade (WHO grade I) tumors, such as subependymomas and myxopapillary ependymomas, are usually slow progressing variants of ependymomas. In contrast, grade III ependymomas display anaplastic features like hypercellularity, high mitosis, proliferation of endothelial cells and palisading necrosis 34. Histopathological evaluation of ependymoma tissue reveals pseudo-rosette formation, high mitotic activity, vascular proliferation and necrosis, EMA staining with perinuclear dot-like structures and with diffuse GFAP immunoreactivity 35. Immunological staining with GFAP and vimentin is very helpful for the differential diagnosis of ependymomas from other non-ependymal tumors, such as astrocytic and choroid plexus tumors, and also in differentiating between the various grades of ependymomas 13, 14, 36. It has been reported that the GFAP expression correlates with a loss of E-cadherin expression in anaplastic ependymomas, although in this case there was E-cadherin expression 36. Changes in E-cadherin expression promote tumor invasion and metastasis 37. Overexpression of EGFR is known to correlate with tumor grades in ependymomas (100%, 50%, and 0% in grade I, II and III, respectively) 23. The tumor in our case is grade III anaplastic ependymoma and it stained negatively for EGFR, confirming this observation. Based upon the expression profiles of numerous angiogenesis genes (HIF-1a signaling, VEGF signaling, cell migration) and signaling pathway genes (PDGF signaling, MAPK signaling, EGFR signaling), posterior fossa ependymomas are subdivided into two groups 19. In this case, a diagnosis of anaplastic ependymoma (WHO grade III) was made upon the observation of the above characteristics for the tumor. The pathology of the resected tissue demonstrated a hypercellular tumor with areas of perivascular pseudo rosettes, consistent with a diagnosis of ependymoma.
Despite several investigations, the correlation between histological grading of ependymoma tumors and their prognosis is unclear 8, 34, 38. Apart from histopathological grading, previous studies have focused on gross deletions and chromosomal abnormalities through cytogenetic studies and array-CGH profiling of ependymomas 39, 40. These studies helped to distinguish between intracranial and spinal cord ependymomas. Around 70% of supratentorial ependymas are known to carry a fusion gene which produces the C11orf95/RELA fusion transcript and the prognosis is poor for this tumor 41. Ion Torrent PGM sequencing of a grade II ependymoma demonstrated MET and ATRX copy number gain 25. Overexpression of L1 cell adhesion molecule ( L1CAM), 1q25 copy number gain and a homozygous deletion in CDKN2A was also reported in some aggressive supratentorial ependymomas 42. However, in the present case we did not detect any MET or CDKN2A mutations using the Ion AmpliSeq Cancer HotSpot panel.
In the cancer genome atlas (TCGA) projects top mutated cancer genes were IDH1, TP53, EGFR, PIK3CA, and PDGFRA (cBioportal data base, https://www.cbioportal.org). The specific variants we found in the present ependymoma case such as in TP53, HRAS, SMAD4, PIK3CA are not in TCGA projects. However, genes that are mutated in this ependymoma tumor such as IDH1, TP53, and EGFR are in top 20 mutated cancer genes with high functional impact, other genes were not in top 20 genes in ICGC data portal ( https://dcc.icgc.org). In the integrative onco-genomics data base ( https://www.intogen.org/search?cancer) genes mutated such as, TP53 and PDGFRA are in high-grade glioma data from St. Jude children's research hospital (HGG_D_STJUDE), and IDH1, TP53, PIK3CA and EGFR, are most recurrently mutated cancer driver genes in GBM_TCGA dataset. Also, under ‘ependymoma’ only search, two cohorts are found, with total 94 samples. In the ependymoma – DKFZ cohort, (EPD_PRY_DKFZ_2017), total 55 samples are found. The IDH1 variant found in our case also detected as a mutational cancer driver in this cohort 43. Ependymoma data from St. Jude children's research hospital have 39 samples, and by WGS, PIK3CA is detected as a mutational cancer driver in the ependymoma cohort in 2 out of 39 (5.13%) samples (3:179203765: T>A; AA345, 3:179221147: A>C, AA726), were found to have mutation in this driver gene 41.
Patients with neurofibromatosis type 2 are predisposed to the development of ependymomas, and the gene for neurofibromatosis type 2 ( NF2) maps to chromosome 22 (q1216,17). Mutations in the NF2 gene are uncommon in sporadic ependymomas and appear to be restricted to spinal tumors 44. For spinal cord ependymomas, four out of eight tumors were found to have an NF2 mutation and all eight tumors had loss of heterozygosity (LOH) of chromosome 22, where the NF2 locus is found. However, five out of eight intracranial tumors exhibited LOH of chromosome 22 but no NF2 mutations 24. A high rate of truncating mutations such as nonsense and frameshift mutations in the NF2 gene were also reported previously in spinal ependymomas 45, 46. Unfortunately, in the Ion AmpliSeq cancer HotSpot panel primer pool used in the present study NF2 gene was not included. The SMARCB1 germline mutations contribute to 10% of sporadic schwannomatosis. The SNP (rs5030613) found by us in this gene c.1119-41G>A is also reported in Schwannomatosis 47. However, this SNP was not reported previously in ependymomas.
We have verified all mutations in various databases (COSMIC, ExAc and dbSNP) to confirm whether variants are novel. Only one detected in our case, a synonymous variant found in FLT3 (c.1776T>C; p.(Val592Val), is a novel variant. In 924 glioma cases tested FLT3 mutations found in 26 cases, a mutation in Val592 codon [c.1774G>A; p.(V592I)] was reported in 2 cases of astrocytoma grade IV. In this cohort 16 ependymoma case were included but their mutation status for FLT3 is negative 48. Identification of this novel variant in exon 14 of FLT3 does not have any structural functional impact as this is a synonymous variant coding for the same amino acid. However, this variant is not reported in COSMIC database or dbSNP also. In the Leiden open variation database (LOVD) 5 more synonymous mutations were reported in exon 14 (in the juxta membrane domain amino acids 572-609); in c.1746, c.1770, c.1773, c.1803 and in codon 1815 http://databases.lovd.nl/whole_genome/variants/FLT3. The IDH1 mutation c.395G>A; p.(Arg132His) we detected in this tumor is a substitution missense mutation which has been reported previously (COSM28746) in glioma tumors 49. In this codon, another missense G>T mutation (COSM28750), and a compound substitution c.394_395CG>GT (COSM28751) are also known. Somatic IDH1 mutations in this codon have been found with greater frequency in diffuse astrocytomas, oligodendrogliomas, oligoastrocytomas and secondary glioblastomas. And in anaplastic ependymoma grade III this variant is reported with 14.3% frequency 50. However, several grade II and grade III ependymal tumors tested did not show this mutation in the IDH1 gene 51. For astrocytic tumors, the presence of this mutation is known to be associated with younger patients 52. This observation supports our findings for this ependymoma tumor as the patient is six years-old. This mutation is pathogenic, having a FATHMM score of 0.94. Other variants detected in this tumor, such as those in FGFR3, PDGFRA, KDR (c.1416A>T), CSF1R, EGFR, RET, HRAS, PIK3CA, FLT3 (c.1310-3T>C), and SMAD4, are benign. The FLT3 splice variant c.1310-3T>C (rs2491231) was reported in 84% of triple negative breast cancer cases 53. This variant was not reported in ependymoma tumors previously, this is the first time we report it here. Variants detected in this tumor have also been reported in other cancers: PDGFRA mutations in cervical adeno-squamous carcinomas; ERBB4 mutations in lung adenocarcinomas; FGFR3 mutations in breast, endometrial and ovarian cancers; CSF1R mutations in prostate cancer; EGFR mutations in lung adenocarcinomas; RET mutations in thyroid carcinomas; HRAS mutations in melanomas; and SMAD4 mutations in breast cancer. However, with the exception of the KDR variant c.1416A>T, this is the first time the above variants are reported in a brain tumor 54– 62.
We found an intronic variant in PIK3CA and one missense mutation in this gene. This missense mutation was also reported previously in hemangioblastoma and in colon adenocarcinoma 63, 64. Missense mutations in PIK3CA are known to promote glioblastoma tumor progression 65. Mutations of the PTEN gene are rare in ependymomas and we have also not detected any PTEN mutations in this tumor 66. The KDR (VEGFR2) gene plays an important role in neovascularization and tumor initiation by glioma stem-like cells 67. In non-small cell lung cancer patients, the Gln472His SNP is associated with increased KDR activity, and was correlated with increased micro vessel density 68. This variant was not known in ependymoma tumors previously. This mutation is reported in Colo-rectal cancer, melanoma, non-small cell lung cancer, and it’s an important target for drugs like Avastin (Bevacizumab), Aflibrcept, and drugs reported in ( http://atlasgeneticsoncology.org/Genes/GC_KDR.html).
Mutations in cancer driver genes such as TP53, CDKN2A, and EGFR, which are frequently affected in gliomas, have been shown to be rare in ependymomas 44, 66, 69. We have detected a TP53 mutation (c.215C>G, p.Pro72Arg, rs1042522) in this tumor with a frequency of 47.94%. This mutation p.(Pro72Arg) has also been reported previously in a medulloblastoma tumor in a young patient 70. Previous studies have shown that out of 15 ependymoma tumors tested, only one case, a patient with a malignant ependymoma of the posterior fossa, had a mutation in exon 6 of the TP53 gene, which was silent, and in another study only one out of 31 ependymoma tumors tested contained a mutation in the TP53 gene 71, 72. However, in another study, out of 15 ependymoma tumors, none had a mutation in the TP53 gene, suggesting that this gene does not play an important role in the pathogenesis and development of ependymomas, unlike other brain tumor types 66, 72, 73. Miller et al., (2018) through whole-exome sequencing of an anaplastic ependymoma tumor, have shown mutations in several cancer-related genes, as well as genes related to metabolism, neuro-developmental disorder, epigenetic modifiers and intracellular signaling 74. These authors have shown resistance-promoting variant expression in a single ependymoma case at different stages of recurrence. However, these genes were not present in the cancer panel we used in this study. Using the human exome capture on Illumina, Bettegowda et al., (2013) have reported that in one out of eight grade III intracranial ependymomas, tumors have mutations in PTEN and TP53, and one tumor with HIST1H3C mutations 24. The HIST1H3C p.(Lys27Met) mutation has also been reported previously in posterior fossa ependymomas 75. Ependymomas may in fact represent a very heterogeneous class of tumors, each with distinct molecular profiles and, even within posterior fossa ependymomas, there are at least two distinct gene expression patterns, as demonstrated by Witt et al., (2011) 19, 76. Overall, in previous studies, a very low frequency of mutations was observed in both intracranial and spinal ependymomas and our findings also supports this observation 19, 24, 25, 41.
The Ion AmpliSeq Cancer HotSpot Panel consists of 207 primers in 1 tube, targeting 50 oncogenes and tumor suppressor genes that are frequently mutated in several types of cancers. The detected mutations were found to have high accuracy; 100% amplicons had at least 500 reads and 500x target base coverage was also 100%. This high level of accuracy and the high depth of coverage achieved with the Ion Proton system allowed us to reliably detect low frequency mutations with high confidence. Allele coverage in most of the variants is around 2000x, the p-value was 0.00001 and the Phred score was very high for all the variants, indicating high confidence in the variants found in this tumor. Apart from its use in whole-exome sequencing, cancer panel analysis has also become common practice for Ion Proton 26. The Ion Proton instrument has the advantage of pooling samples using barcodes and the Ion PI chip. For pooled samples, sequencing enables a high throughput up to 15 Gb of data, with more than 60–80 million reads passing read filtering. The purpose of read filtering is to discard the reads that contain low quality sequences, to remove polyclonal reads, remove reads with an off-scale signal, remove reads lacking a sequencing key, remove adapter dimers, and remove short reads etc. If the computed mean read length from all the reads and the minimum total mapped reads in the sample is less than the specified threshold, that sample does not pass the quality control.
Recent molecular diagnostics research had helped in subdividing glioblastomas, oligodendrogliomas and oligoastrocytomas into genetically diverse groups of tumors, and these mutational markers may help in predicting the prognosis and response to therapy 77. However, such a strategy for the molecular subdivision of ependymomas has been not successful so far using mutational profiling. Epigenetic markers and fusion protein analysis have also helped in identifying new groups of supratentorial ependymoma tumors and in spite of the histopathological signs of malignancy, a small set of ependymomas had a very good prognosis, suggesting that this subgroup of tumors should not be diagnosed as classic ependymomas 78. However, another study showed that methylation profiling did not identify a consistent molecular class within the supratentorial tumors, but successfully sub-classified posterior fossa ependymoma into two subgroups 79.
In conclusion, we have identified four known missense mutations, eight synonymous and seven intronic, in this grade III ependymoma. Out of these, only one mutation in FLT3 (c.1776T>C, synonymous) is novel, and only one mutation in IDH1 (c.395G>A, missense) is deleterious, with all other mutations benign. Many of the variants we reported here were not detected in the ependymal tumors analyzed by NGS previously. HRAS c.81T>C, PIK3CA c.1173A>G, RET c.2307G>T, KDR c.1416A>T, APC c.4479G>A, EGFR c.2361G>A and FLT3 c.1310-3T>C variants have not been previously reported in brain tissue, as verified in COSMIC data base, although they have been reported in other tissues like lung and breast. Further studies are warranted, using NGS methods in all three grades of intracranial ependymomas to identify the genetic signatures that may distinguish between these tumors at the molecular genetic level.
Data availability
Underlying data
Raw sequence reads for this tumor on Sequence Read Archive, Accession number SRP192752: https://identifiers.org/insdc.sra/SRP192752
Open Science Framework: Mutation profiling of anaplastic ependymoma grade III by Ion Proton next generation DNA sequencing. https://doi.org/10.17605/osf.io/y9sfg 33
This project contains the following underlying data:
-
-
All variants before filteration.xlsx (spreadsheet of all annotated variants)
-
-
Final Variant Calls using HotSpot filter.xlsx (spreadsheet of annotated variants called using HotSpot filter)
-
-
TSVC_variants_IonXpress_013.vcf (file containing all variants (un-annotated) in vcf format)
-
-
TSVC_variants_IonXpress_013.vcf.gz.tbi (file containing all variants (un-annotated) in vcf.gz.tbi format)
-
-
heatmap-gr3 ion rep.csv (spreadsheet containing impact scores used to generate heat map)
-
-
EGFR Figure neg.jpg (images for EGFR staining)
-
-
Fig2A.jpg – Figur4D.jpg (raw image files used in Figure 2– Figure 5)
-
-
Radiology Fig.1.jpg – Radiology Figure 1 (2).jpg (raw image files used in Figure 1)
Data are available under the terms of the Creative Commons Attribution 4.0 International license (CC-BY 4.0).
Extended data
Open Science Framework: Mutation profiling of anaplastic ependymoma grade III by Ion Proton next generation DNA sequencing. https://doi.org/10.17605/osf.io/y9sfg 33
This project contains the following extended data:
-
-
Gr-3 Advaiata Final report.pdf (Advaiata iVariant analysis report)
Data are available under the terms of the Creative Commons Attribution 4.0 International license (CC-BY 4.0).
Acknowledgements
We appreciate the technical help of Mrs. Rowa Abbas Bakhsh, Histopathology Division, Al-Noor Hospital, Makkah. The authors would like to thank the staff of Science and Technology Unit at Umm Al-Qura University for the continuous support.
Funding Statement
This study is supported by a grant from The Deanship of Scientific Research, Umm-Al-Qura University, Makkah to Dr. MM. Taher (Code. No. 43509008).
The funders had no role in study design, data collection and analysis, decision to publish, or preparation of the manuscript.
[version 2; peer review: 2 approved]
References
- 1. Duff DJ, Miller DC: Ependymomas (Review). AJSP: Reviews & Reports. 2013;18(5):221–230. 10.1097/PCR.0b013e3182a9afcb [DOI] [Google Scholar]
- 2. Wu J, Armstrong TS, Gilbert MR: Biology and management of ependymomas. Neuro Oncol. 2016;18(7):902–913. 10.1093/neuonc/now016 [DOI] [PMC free article] [PubMed] [Google Scholar]
- 3. Wesseling P, Capper D: WHO 2016 Classification of gliomas. Neuropathol Appl Neurobiol. 2018;44(2):139–150. 10.1111/nan.12432 [DOI] [PubMed] [Google Scholar]
- 4. Ostrom QT, Gittleman H, Fulop J, et al. : CBTRUS Statistical Report: Primary Brain and Central Nervous System Tumors Diagnosed in the United States in 2008-2012. Neuro Oncol. 2015;17 Suppl 4:iv1–iv62. 10.1093/neuonc/nov189 [DOI] [PMC free article] [PubMed] [Google Scholar]
- 5. Zamora C, Huisman TA, Izbudak I: Supratentorial Tumors in Pediatric Patients. Neuroimaging Clin N Am. 2017;27(1):39–67. 10.1016/j.nic.2016.08.003 [DOI] [PubMed] [Google Scholar]
- 6. Kilday JP, Rahman R, Dyer S, et al. : Pediatric ependymoma: biological perspectives. Mol Cancer Res. 2009;7(6):765–786. 10.1158/1541-7786.MCR-08-0584 [DOI] [PubMed] [Google Scholar]
- 7. Hamilton RL, Pollack IF: The molecular biology of ependymomas. Brain Pathol. 1997;7(2):807–822. 10.1111/j.1750-3639.1997.tb01066.x [DOI] [PMC free article] [PubMed] [Google Scholar]
- 8. Horn B, Heideman R, Geyer R, et al. : A multi-institutional retrospective study of intracranial ependymoma in children: identification of risk factors. J Pediatr Hematol Oncol. 1999;21(3):203–211. 10.1097/00043426-199905000-00008 [DOI] [PubMed] [Google Scholar]
- 9. Spoto GP, Press GA, Hesselink JR, et al. : Intracranial ependymoma and subependymoma: MR manifestations. AJR Am J Roentgenol. 1990;154(4):837–845. 10.2214/ajr.154.4.2107685 [DOI] [PubMed] [Google Scholar]
- 10. Andrade FG, de Aguiar PH, Matushita H, et al. : Intracranial and spinal ependymoma: series at Faculdade de Medicina, Universidade de São Paulo. Arq Neuropsiquiatr. 2009;67(3A):626–632. 10.1590/S0004-282X2009000400010 [DOI] [PubMed] [Google Scholar]
- 11. Vera-Bolanos E, Aldape K, Yuan Y, et al. : Clinical course and progression-free survival of adult intracranial and spinal ependymoma patients. Neuro Oncol. 2015;17(3):440–447. 10.1093/neuonc/nou162 [DOI] [PMC free article] [PubMed] [Google Scholar]
- 12. Milano MT, Johnson MD, Sul J, et al. : Primary spinal cord glioma: a Surveillance, Epidemiology, and End Results database study. J Neurooncol. 2010;98(1):83–92. 10.1007/s11060-009-0054-7 [DOI] [PubMed] [Google Scholar]
- 13. Louis DN, Perry A, Reifenberger G, et al. : The 2016 World Health Organization Classification of Tumors of the Central Nervous System: a summary. Acta Neuropathol. 2016;131(6):803–820. 10.1007/s00401-016-1545-1 [DOI] [PubMed] [Google Scholar]
- 14. Leeper H, Felicella MM, Walbert T: Recent Advances in the Classification and Treatment of Ependymomas. Curr Treat Options Oncol. 2017;18(9):55. 10.1007/s11864-017-0496-7 [DOI] [PubMed] [Google Scholar]
- 15. Hirose Y, Aldape K, Bollen A, et al. : Chromosomal abnormalities subdivide ependymal tumors into clinically relevant groups. Am J Pathol. 2001;158(3):1137–1143. 10.1016/S0002-9440(10)64061-8 [DOI] [PMC free article] [PubMed] [Google Scholar]
- 16. Ross GW, Rubinstein LJ: Lack of histopathological correlation of malignant ependymomas with postoperative survival. J Neurosurg. 1989;70(1):31–36. 10.3171/jns.1989.70.1.0031 [DOI] [PubMed] [Google Scholar]
- 17. Pajtler KW, Witt H, Sill M, et al. : Molecular Classification of Ependymal Tumors across All CNS Compartments, Histopathological Grades, and Age Groups. Cancer Cell. 2015;27(5):728–43. 10.1016/j.ccell.2015.04.002 [DOI] [PMC free article] [PubMed] [Google Scholar]
- 18. Palm T, Figarella-Branger D, Chapon F, et al. : Expression profiling of ependymomas unravels localization and tumor grade-specific tumorigenesis. Cancer. 2009;115(17):3955–3968. 10.1002/cncr.24476 [DOI] [PubMed] [Google Scholar]
- 19. Witt H, Mack SC, Ryzhova M, et al. : Delineation of two clinically and molecularly distinct subgroups of posterior fossa ependymoma. Cancer Cell. 2011;20(2):143–157. 10.1016/j.ccr.2011.07.007 [DOI] [PMC free article] [PubMed] [Google Scholar]
- 20. Korshunov A, Neben K, Wrobel G, et al. : Gene expression patterns in ependymomas correlate with tumor location, grade, and patient age. Am J Pathol. 2003;163(5):1721–1727. 10.1016/S0002-9440(10)63530-4 [DOI] [PMC free article] [PubMed] [Google Scholar]
- 21. Mazewski C, Soukup S, Ballard E, et al. : Karyotype studies in 18 ependymomas with literature review of 107 cases. Cancer Genet Cytogenet. 1999;113(1):1–8. 10.1016/S0165-4608(99)00046-1 [DOI] [PubMed] [Google Scholar]
- 22. Ward S, Harding B, Wilkins P, et al. : Gain of 1q and loss of 22 are the most common changes detected by comparative genomic hybridisation in paediatric ependymoma. Genes Chromosomes Cancer. 2001;32(1):59–66. 10.1002/gcc.1167 [DOI] [PubMed] [Google Scholar]
- 23. Ferguson SD, Zhou S, Xiu J, et al. : Ependymomas overexpress chemoresistance and DNA repair-related proteins. Oncotarget. 2018;9(8):7822–7831. 10.18632/oncotarget.23288 [DOI] [PMC free article] [PubMed] [Google Scholar]
- 24. Bettegowda C, Agrawal N, Jiao Y, et al. : Exomic sequencing of four rare central nervous system tumor types. Oncotarget. 2013;4(4):572–583. 10.18632/oncotarget.964 [DOI] [PMC free article] [PubMed] [Google Scholar]
- 25. Nikiforova MN, Wald AI, Melan MA, et al. : Targeted next-generation sequencing panel (GlioSeq) provides comprehensive genetic profiling of central nervous system tumors. Neuro Oncol. 2016;18(3):379–387. 10.1093/neuonc/nov289 [DOI] [PMC free article] [PubMed] [Google Scholar]
- 26. Mehrotra M, Duose DY, Singh RR, et al. : Versatile ion S5XL sequencer for targeted next generation sequencing of solid tumors in a clinical laboratory. PLoS One. 2017;12(8):e0181968. 10.1371/journal.pone.0181968 [DOI] [PMC free article] [PubMed] [Google Scholar]
- 27. Li H: A statistical framework for SNP calling, mutation discovery, association mapping and population genetical parameter estimation from sequencing data. Bioinformatics. 2011;27(21):2987–93. 10.1093/bioinformatics/btr509 [DOI] [PMC free article] [PubMed] [Google Scholar]
- 28. Koboldt DC, Chen K, Wylie T, et al. : VarScan: variant detection in massively parallel sequencing of individual and pooled samples. Bioinformatics. 2009;25(17):2283–5. 10.1093/bioinformatics/btp373 [DOI] [PMC free article] [PubMed] [Google Scholar]
- 29. Cingolani P, Platts A, Wang le L, et al. : A program for annotating and predicting the effects of single nucleotide polymorphisms, SnpEff: SNPs in the genome of Drosophila melanogaster strain w 1118; iso-2; iso-3. Fly (Austin). 2012;6(2):80–92. 10.4161/fly.19695 [DOI] [PMC free article] [PubMed] [Google Scholar]
- 30. Cingolani P, Patel VM, Coon M, et al. : Using Drosophila melanogaster as a Model for Genotoxic Chemical Mutational Studies with a New Program, SnpSift. Front Genet. 2012;3: 35. 10.3389/fgene.2012.00035 [DOI] [PMC free article] [PubMed] [Google Scholar]
- 31. Shihab HA, Gough J, Cooper DN, et al. : Predicting the functional, molecular, and phenotypic consequences of amino acid substitutions using hidden Markov models. Hum Mutat. 2013;34(1):57–65. 10.1002/humu.22225 [DOI] [PMC free article] [PubMed] [Google Scholar]
- 32. Grantham R: Amino acid difference formula to help explain protein evolution. Science. 1974;185(4154):862–864. 10.1126/science.185.4154.862 [DOI] [PubMed] [Google Scholar]
- 33. Taher MM, Butt ME, Alyami SH, et al. : Mutation profiling of anaplastic ependymoma grade III by Ion Proton next generation DNA sequencing. 2019. 10.17605/OSF.IO/Y9SFG [DOI] [PMC free article] [PubMed]
- 34. Raghunathan A, Wani K, Armstrong TS, et al. : Histological predictors of outcome in ependymoma are dependent on anatomic site within the central nervous system. Brain Pathol. 2013;23(5):584–594. 10.1111/bpa.12050 [DOI] [PMC free article] [PubMed] [Google Scholar]
- 35. Kuncova K, Janda A, Kasal P, et al. : Immunohistochemical prognostic markers in intracranial ependymomas: systematic review and meta-analysis. Pathol Oncol Res. 2009;15(4):605–614. 10.1007/s12253-009-9160-2 [DOI] [PubMed] [Google Scholar]
- 36. Tena-Suck ML, Castillejos-Lopez M, Diaz-Alba A, et al. : Expression of glial acidic fibrillary protein delta and E-cadherin in ependymomas; clinic-pathological and immunohistochemistry correlation. J Histol Histopath. 2015;2:Article 17 10.7243/2055-091X-2-17 [DOI] [Google Scholar]
- 37. Gumbiner BM: Regulation of cadherin-mediated adhesion in morphogenesis. Nat Rev Mol Cell Biol. 2005;6(8):622–634. 10.1038/nrm1699 [DOI] [PubMed] [Google Scholar]
- 38. Figarella-Branger D, Civatte M, Bouvier-Labit C, et al. : Prognostic factors in intracranial ependymomas in children. J Neurosurg. 2000;93(4):605–613. 10.3171/jns.2000.93.4.0605 [DOI] [PubMed] [Google Scholar]
- 39. Dyer S, Prebble E, Davison V, et al. : Genomic imbalances in pediatric intracranial ependymomas define clinically relevant groups. Am J Pathol. 2002;161(6):2133–2141. 10.1016/S0002-9440(10)64491-4 [DOI] [PMC free article] [PubMed] [Google Scholar]
- 40. Sainati L, Montaldi A, Putti MC, et al. : Cytogenetic t(11;17)(q13;q21) in a pediatric ependymoma. Is 11q13 a recurring breakpoint in ependymomas? Cancer Genet Cytogenet. 1992;59(2):213–216. 10.1016/0165-4608(92)90218-W [DOI] [PubMed] [Google Scholar]
- 41. Parker M, Mohankumar KM, Punchihewa C, et al. : C11orf95-RELA fusions drive oncogenic NF-κB signalling in ependymoma. Nature. 2014;506(7489):451–455. 10.1038/nature13109 [DOI] [PMC free article] [PubMed] [Google Scholar]
- 42. Kim SI, Lee Y, Kim SK, et al. : Aggressive Supratentorial Ependymoma, RELA Fusion-Positive with Extracranial Metastasis: A Case Report. J Pathol Transl Med. 2017;51(6):588–593. 10.4132/jptm.2017.08.10 [DOI] [PMC free article] [PubMed] [Google Scholar]
- 43. Grobner SN, Worst BC, Weischenfeldt J, et al. : PedBrain-Seq Project; ICGC MMML-Seq Project. The Landscape of Genomic Alterations Across Childhood Cancers. Nature. 2018;17(7696):321–327. 10.1038/nature25480 [DOI] [PubMed] [Google Scholar]
- 44. von Haken MS, White EC, Daneshvar-Shyesther L, et al. : Molecular genetic analysis of chromosome arm 17p and chromosome arm 22q DNA sequences in sporadic pediatric ependymomas. Genes Chromosom Cancer. 1996;17(1):37–44. [DOI] [PubMed] [Google Scholar]
- 45. Rubio MP, Correa KM, Ramesh V, et al. : Analysis of the neurofibromatosis 2 gene in human ependymomas and astrocytomas. Cancer Res. 1994;54(1):45–47. [PubMed] [Google Scholar]
- 46. Plotkin SR, O'Donnell CC, Curry WT, et al. : Spinal ependymomas in neurofibromatosis Type 2: a retrospective analysis of 55 patients. J Neurosurg Spine. 2011;14(4):543–547. 10.3171/2010.11.SPINE10350 [DOI] [PubMed] [Google Scholar]
- 47. Rousseau G, Noguchi T, Bourdon V, et al. : SMARCB1/INI1 germline mutations contribute to 10% of sporadic schwannomatosis. BMC Neurol. 2011;11:9. 10.1186/1471-2377-11-9 [DOI] [PMC free article] [PubMed] [Google Scholar]
- 48. Zehir A, Benayed R, Berger MF, et al. : Mutational landscape of metastatic cancer revealed from prospective clinical sequencing of 10,000 patients. Nat Med. 2017;23(6):703–713. 10.1038/nm.4333 [DOI] [PMC free article] [PubMed] [Google Scholar]
- 49. Wang PF, Liu N, Song HW, et al. : IDH-1 R132H mutation status in diffuse glioma patients: implications for classification. Oncotarget. 2016;7(21):31393–400. 10.18632/oncotarget.8918 [DOI] [PMC free article] [PubMed] [Google Scholar]
- 50. Yusoff AM, Zulfakhar FN, Sul’ain MD, et al. : Association of The IDH1 C.395G>A (R132H) Mutation with Histological Type in Malay Brain Tumors. Asian Pac J Cancer Prev. 2016;17(12):5195–5201. 10.22034/APJCP.2016.17.12.5195 [DOI] [PMC free article] [PubMed] [Google Scholar]
- 51. Mellai M, Piazzi A, Caldera V, et al. : IDH1 and IDH2 mutations, immunohistochemistry and associations in a series of brain tumors. J Neurooncol. 2011;105(21):345–57. 10.1007/s11060-011-0596-3 [DOI] [PubMed] [Google Scholar]
- 52. Balss J, Meyer J, Mueller W, et al. : Analysis of the IDH1 codon 132 mutation in brain tumors. Acta Neuropathol. 2008;116(6):597–602. 10.1007/s00401-008-0455-2 [DOI] [PubMed] [Google Scholar]
- 53. Uscanga-Perales GI, Santuario-Facio SK, Sanchez-Dominguez CN, et al. : Genetic alterations of triple negative breast cancer (TNBC) in women from Northeastern Mexico. Oncol Lett. 2019;17(3):3581–3588. 10.3892/ol.2019.9984 [DOI] [PMC free article] [PubMed] [Google Scholar]
- 54. Longatto-Filho A, Pinheiro C, Martinho O, et al. : Molecular characterization of EGFR, PDGFRA and VEGFR2 in cervical adenosquamous carcinoma. BMC Cancer. 2009;9:212. 10.1186/1471-2407-9-212 [DOI] [PMC free article] [PubMed] [Google Scholar]
- 55. Bonfiglio S, Vanni I, Rossella V, et al. : Performance comparison of two commercial human whole-exome capture systems on formalin-fixed paraffin-embedded lung adenocarcinoma samples. BMC Cancer. 2016;16:692. 10.1186/s12885-016-2720-4 [DOI] [PMC free article] [PubMed] [Google Scholar]
- 56. Gonzalez-Bosquet J, Calcei J, Wei JS, et al. : Detection of somatic mutations by high-resolution DNA melting (HRM) analysis in multiple cancers. PLoS One. 2011;6(1):e14522. 10.1371/journal.pone.0014522 [DOI] [PMC free article] [PubMed] [Google Scholar]
- 57. Qu HQ, Jacob K, Fatet S, et al. : Genome-wide profiling using single-nucleotide polymorphism arrays identifies novel chromosomal imbalances in pediatric glioblastomas. Neuro Oncol. 2010;12(2):153–63. 10.1093/neuonc/nop001 [DOI] [PMC free article] [PubMed] [Google Scholar]
- 58. Lo Iacono M, Buttigliero C, Monica V, et al. : Retrospective study testing next generation sequencing of selected cancer-associated genes in resected prostate cancer. Oncotarget. 2016;7(12):14394–14404. 10.18632/oncotarget.7343 [DOI] [PMC free article] [PubMed] [Google Scholar]
- 59. Leichsenring J, Volckmar AL, Magios N, et al. : Synonymous EGFR variant p.Q787Q is neither prognostic nor predictive in patients with lung adenocarcinoma. Genes Chromosomes Cancer. 2017;56(3):214–220. 10.1002/gcc.22427 [DOI] [PubMed] [Google Scholar]
- 60. Ceolin L, Siqueira DR, Romitti M, et al. : Molecular basis of medullary thyroid carcinoma: the role of RET polymorphisms. Int J Mol Sci. 2012;13(1):221–39. 10.3390/ijms13010221 [DOI] [PMC free article] [PubMed] [Google Scholar]
- 61. Tomei S, Adams S, Uccellini L, et al. : Association between HRAS rs12628 and rs112587690 polymorphisms with the risk of melanoma in the North American population. Med Oncol. 2012;29(5):3456–3461. 10.1007/s12032-012-0255-3 [DOI] [PMC free article] [PubMed] [Google Scholar]
- 62. Tram E, Ibrahim-Zada I, Briollais L, et al. : Identification of germline alterations of the mad homology 2 domain of SMAD3 and SMAD4 from the Ontario site of the breast cancer family registry (CFR). Breast Cancer Res. 2011;13(4):R77. 10.1186/bcr2926 [DOI] [PMC free article] [PubMed] [Google Scholar]
- 63. Shankar GM, Taylor-Weiner A, Lelic N, et al. : Sporadic hemangioblastomas are characterized by cryptic VHL inactivation. Acta Neuropathol Commun. 2014;2:167. 10.1186/s40478-014-0167-x [DOI] [PMC free article] [PubMed] [Google Scholar]
- 64. Ashktorab H, Mokarram P, Azimi H, et al. : Targeted exome sequencing reveals distinct pathogenic variants in Iranians with colorectal cancer. Oncotarget. 2017;8(5):7852–7866. 10.18632/oncotarget.13977 [DOI] [PMC free article] [PubMed] [Google Scholar]
- 65. McNeill RS, Stroobant EE, Smithberger E, et al. : PIK3CA missense mutations promote glioblastoma pathogenesis, but do not enhance targeted PI3K inhibition. PLoS One. 2018;13(7):e0200014. 10.1371/journal.pone.0200014 [DOI] [PMC free article] [PubMed] [Google Scholar]
- 66. Duerr EM, Rollbrocker B, Hayashi Y, et al. : PTEN mutations in gliomas and glioneuronal tumors. Oncogene. 1998;16(17):2259–2264. 10.1038/sj.onc.1201756 [DOI] [PubMed] [Google Scholar]
- 67. Yao X, Ping Y, Liu Y, et al. : Vascular endothelial growth factor receptor 2 (VEGFR-2) plays a key role in vasculogenic mimicry formation, neovascularization and tumor initiation by Glioma stem-like cells. PLoS One. 2013;8(3):e57188. 10.1371/journal.pone.0057188 [DOI] [PMC free article] [PubMed] [Google Scholar]
- 68. Glubb DM, Cerri E, Gieseet A, et al. : Novel functional germline variants in the VEGF receptor 2 gene and their effect on gene expression and microvessel density in lung cancer. Clin Cancer Res. 2011;17(16):5257–67. 10.1158/1078-0432.CCR-11-0379 [DOI] [PMC free article] [PubMed] [Google Scholar]
- 69. Ohgaki H, Eibl RH, Wiestler OD, et al. : p53 mutations in nonastrocytic human brain tumors. Cancer Res. 1991;51(22):6202–6205. [PubMed] [Google Scholar]
- 70. Sardi I, Giunti L, Donati P, et al. : Loss of heterozygosity and p53 polymorphism Pro72Arg in a young patient with medulloblastoma. Oncol Rep. 2003;10(3):773–775. [PubMed] [Google Scholar]
- 71. Metzger AK, Sheffield VC, Duyk G, et al. : Identification of a germ-line mutation in the p53 gene in a patient with an intracranial ependymoma. Proc Nat Acad Sci U S A. 1991;88(17):7825–7829. 10.1073/pnas.88.17.7825 [DOI] [PMC free article] [PubMed] [Google Scholar]
- 72. Fink KL, Rushing EJ, Schold SC, Jr, et al. : Infrequency of p53 gene mutations in ependymomas. J Neurooncol. 1996;27(2):111–115. 10.1007/BF00177473 [DOI] [PubMed] [Google Scholar]
- 73. Louis DN: The p53 gene and protein in human brain tumors. J Neuropathol Exp Neurol. 1994;53(1):11–21. 10.1097/00005072-199401000-00002 [DOI] [PubMed] [Google Scholar]
- 74. Miller CA, Dahiya S, Li T, et al. : Resistance-promoting effects of ependymoma treatment revealed through genomic analysis of multiple recurrences in a single patient. Cold Spring Harb Mol Case Stud. 2018;4(2): pii: a002444. 10.1101/mcs.a002444 [DOI] [PMC free article] [PubMed] [Google Scholar]
- 75. Gessi M, Capper D, Sahm F, et al. : Evidence of H3 K27M mutations in posterior fossa ependymomas. Acta Neuropathol. 2016;132(4):635–7. 10.1007/s00401-016-1608-3 [DOI] [PubMed] [Google Scholar]
- 76. Johnson RA, Wright KD, Poppleton H, et al. : Cross-species genomics matches driver mutations and cell compartments to model ependymoma. Nature. 2010;466(7306):632–636. 10.1038/nature09173 [DOI] [PMC free article] [PubMed] [Google Scholar]
- 77. Park SH, Won J, Kim SI, et al. : Molecular Testing of Brain Tumor. J Pathol Transl Med. 2017;51(3):205–223. 10.4132/jptm.2017.03.08 [DOI] [PMC free article] [PubMed] [Google Scholar]
- 78. Pagès M, Pajtler KW, Puget S, et al. : Diagnostics of pediatric supratentorial RELA ependymomas: integration of information from histopathology, genetics, DNA methylation and imaging. Brain Pathol. 2019;29(3):325–335. 10.1111/bpa.12664 [DOI] [PMC free article] [PubMed] [Google Scholar]
- 79. Fukuoka K, Kanemura Y, Shofuda T, et al. : Significance of molecular classification of ependymomas: C11orf95-RELA fusion-negative supratentorial ependymomas are a heterogeneous group of tumors. Acta Neuropathol Commun. 2018;6(1):134. 10.1186/s40478-018-0630-1 [DOI] [PMC free article] [PubMed] [Google Scholar]