

Abstract
Background
HIT diagnosis typically uses complementary diagnostic assays (eg, a PF4‐dependent enzyme‐immunoassay [EIA] and a platelet activation assay such as the serotonin‐release assay [SRA]).
Objectives
To determine whether the combination of two automated assays—a latex immunoturbidimetric assay (LIA) that evaluates competitive inhibition of a HIT‐like monoclonal antibody and a chemiluminescence immunoassay (CLIA) for detecting anti‐PF4/heparin IgG—optimizes diagnostic sensitivity while also yielding good specificity, particularly at high assay reactivities.
Patients/Methods
We determined operating characteristics using combined LIA/CLIA results from a HIT observational trial (n = 430; derivation cohort) and 147 consecutive patients with HIT (n = 147; supplementary derivation cohort). We also evaluated 678 consecutive samples referred for HIT testing (replication cohort). LIA/CLIA reactivities were scored individually as “negative” (<1.00 U/mL, 0 points), “weak” (1.00‐4.99 U/mL, 1 point), “moderate” (5.00‐15.99 U/mL, 2 points) and “strong” (≥16.00 U/mL, 3 points), thus contributing up to 6 points (maximum) when LIA/CLIA results were combined. We also examined whether higher LIA/CLIA scores predicted presence of platelet‐activating antibodies by conventional and modified (PF4‐ or PF4/heparin‐enhanced) SRA.
Results
Combined LIA/CLIA testing yielded high diagnostic sensitivity (~99%) similar to EIA. Interpretation of LIA/CLIA results using the 6‐point scale indicated progressively greater likelihood for the presence of platelet‐activating antibodies with increasing scores (semi‐quantitative reactivity). A LIA/CLIA score ≥ 4 points predicted the presence of platelet‐activating antibodies by SRA or PF4‐enhanced SRA with high probability (~98%).
Conclusion
Combined LIA/CLIA testing optimizes diagnostic sensitivity, with progressively greater probability of detecting platelet‐activating antibodies with higher assay reactivity that reaches 98% when both automated assays yield moderate or strong results.
Keywords: blood platelets, clinical laboratory techniques, heparin, immunoassay, thrombocytopenia
Essentials.
LIA and CLIA are two complementary automated rapid assays for detecting HIT antibodies.
Operating characteristics of combined LIA and CLIA testing for HIT diagnosis were evaluated.
Combined LIA/CLIA testing yielded high (~99%) sensitivity for HIT similar to enzyme‐immunoassays.
Combined LIA/CLIA testing is semi‐quantitative (strong reactivity is highly predictive for HIT).
1. INTRODUCTION
Heparin‐induced thrombocytopenia (HIT) is an immune‐mediated, clinical pathological disorder 1 , 2 , 3 notable for its strong association with thrombosis. 4 The “pathological” criterion of HIT is detectability of antiplatelet factor 4 (PF4)/heparin antibodies capable of activating platelets via their FcγIIa receptors. 5 , 6 , 7 , 8 Accordingly, laboratory detection of pathogenic “HIT antibodies” is a cornerstone of diagnosis. 9 , 10 For the past 20 years, the classic laboratory diagnostic paradigm has been a positive PF4‐dependent immunoassay, such as the enzyme‐immunoassay (EIA), with confirmation of platelet‐activating properties through a functional (platelet activation) assay such as the platelet serotonin‐release assay (SRA) 11 , 12 or the heparin‐induced platelet activation test. 13 The EIA and SRA can thus be considered “complementary” assays that evaluate very different properties of HIT antibodies. However, neither type of assay is considered to be a rapid assay.
In recent years, rapid assays have been developed for HIT diagnosis, with results available within 30 minutes of initiation of testing. 10 , 14 Rapid assays offer the opportunity for HIT diagnosis in a timely fashion, particularly when laboratory test results are integrated with clinical pretest probability (Bayesian model). 15 , 16 , 17 Previously, we evaluated two different rapid assays for HIT diagnosis that are automated and can be used on demand. 16 , 17 One assay, the latex immunoturbidimetric assay (LIA), was found to have approximately 95% sensitivity and 95% specificity for HIT diagnosis. 16 The other assay, the chemiluminescence immunoassay (CLIA), is an IgG‐specific immunoassay; it was found to have approximately 98% sensitivity and 98% specificity. 17 The LIA and CLIA can be considered complementary assays. This is because the LIA can be viewed as a functionalized immunoassay 18 as it detects HIT antibodies based upon their ability to inhibit agglutination of microbeads to which a HIT‐like monoclonal antibody (KKO) has been bound, in the presence of PF4/polyanion. 18 In contrast, the CLIA detects HIT antibodies based upon their ability to bind to magnetic particles with PF4/polyanion complexes on their surfaces, with a labeled anti‐IgG antibody resulting in a luminescent reaction. 19 Thus, combining the use of the LIA and CLIA is similar in principle to the combined use of the SRA and EIA in that the assays are complementary for the detection of HIT antibodies. 10 Our study aimed to investigate whether the complementary features of the LIA and CLIA provide useful diagnostic information when samples are tested using both assays versus using only one test in isolation (ie, if by performing both assays, one reduces the chance of a missed diagnosis of HIT, or by identifying a combined reaction profile pointing strongly to a diagnosis of HIT).
Historically, the relationship between the EIA and the SRA has been conceptualized using the “iceberg model,” 20 in which a subset of samples reactive in one or more PF4‐dependent EIAs that additionally have platelet‐activating properties detectable by the SRA are considered to have the greatest risk of HIT. In this model, samples that yield strong‐positive results by EIA (eg, greater magnitude for reactivity by optical density) are more likely to be SRA‐positive (semiquantitative reactivity). 21 , 22 , 23 Recently, this model has been revised to include a subgroup of EIA‐positive patients with so‐called “SRA‐negative HIT.” 24 , 25 , 26 , 27 , 28 This term denotes EIA‐positive but SRA‐negative patients whose clinical picture is suggestive of HIT, and where subthreshold platelet‐activating antibodies can be detected either by a modified SRA or certain other platelet activation assays. For example, a modified SRA, called the PF4‐SRA, which uses high concentrations of PF4 (50 and 100 µg/mL) rather than different concentrations of heparin, can detect such subthreshold HIT antibodies. 27 , 28 , 29 Another modified SRA, 26 referred to here as the PF4/H‐SRA, which performs the SRA in the presence of heparin (0.5 U/mL) and PF4 (10 µg/mL), can also detect subthreshold levels of HIT antibodies.
We capitalized on the availability of 430 patient plasma samples from a prospective cohort study 30 (derivation cohort) and samples from 147 consecutive patients with HIT (supplementary derivation cohort), to estimate the operating characteristics of combined LIA and CLIA testing. We also evaluated 678 samples subsequently referred to our laboratory for HIT antibody testing (replication cohort). All studies using the automated assays were performed using citrated plasma because plasma must be used in the LIA. Our aim was to determine sensitivity of the combined assays, the LIA and CLIA (ie, LIA/CLIA), for detecting SRA‐positive status, as well as for detecting subthreshold platelet‐activating antibodies by PF4‐SRA and PF4/H‐SRA. Among samples that tested positive in one or both automated assays, we also evaluated whether the strength of reactivity predicted for greater likelihood of SRA‐positive status, or positive status for subthreshold platelet‐activating antibodies. This was to evaluate whether combined LIA/CLIA results could provide useful semiquantitative information, as is known for the EIAs. Finally, we evaluated whether strong LIA/CLIA results could predict with high confidence a diagnosis of HIT, thus allowing for rapid positive identification of HIT.
2. PATIENTS AND METHODS
2.1. Patient plasma samples evaluated for diagnosis of HIT
Testing for HIT antibodies using citrated plasma was performed for the following three patient groups.
2.1.1. Derivation cohort
The first group consisted of 430 patients who were evaluated for HIT in a prospective cohort study that evaluated the thrombocytopenia, timing of onset of thrombocytopenia in relation to first dose of heparin, thrombosis, and other explanation (4Ts) scoring system. 30
2.1.2. Supplementary derivation cohort
The second group consisted of 147 consecutive patients at one hospital (Hamilton General Hospital) who were diagnosed as having HIT based upon a positive SRA (with positive EIA corroboration) from February 21, 1999, to September 28, 2018. The SRA‐positive patients had a clinical picture consistent with HIT (ie, 4Ts score of 4 points or greater when reviewed by a clinician experienced in HIT diagnosis [T.E.W.]). The purpose of the supplementary derivation cohort was to increase the numbers of HIT‐positive patients so that the sensitivity of LIA/CLIA test results could be better ascertained.
2.1.3. Replication cohort
The third group of patients consisted of 678 consecutive patients who had a plasma sample sent to our reference lab for HIT testing (from August 16, 2018, to November 11, 2019). For this group, clinical information was not generally available (because many of the patient samples were referred from outside Hamilton); however, we used this group to evaluate further various profiles of LIA/CLIA reactivity in predicting for SRA‐positive status, as well as for detection of platelet‐activating antibodies, whether by the SRA or by use of a modified SRA that detects subthreshold platelet‐activating antibodies (PF4‐SRA or PF4/H‐SRA).
We have previously reported the results of LIA and CLIA testing separately for the derivation group 16 , 17 ; however, the utility of combining these assays has not been previously evaluated, nor have we previously reported test results for the replication data set. We hypothesized that the combination of the two rapid automated assays for HIT—the LIA and the CLIA—could provide exceptionally high diagnostic sensitivity while also providing high diagnostic specificity with strong positive results in one or both assays.
Permission was received from the Hamilton Integrated Research Ethics Board to perform these studies on stored plasma samples.
2.2. Platelet‐activating assays and enzyme immunoassays
Samples were tested in two EIAs, a commercial polyspecific PF4/polyvinyl sulfonate (PVS) EIA that detects antibodies of IgG, IgA, and/or IgM classes (LIFECODES PF4 Enhanced assay; Immucor GTI Diagnostics, Waukesha, WI), 31 as well as an in‐house IgG‐specific EIA that detects antibodies against PF4/heparin. 32 The SRA, 11 , 12 PF4‐SRA, 29 and PF4/H‐SRA 26 were performed as previously described. We defined the SRA as positive if the mean percent serotonin release at 0.1 and 0.3 U/mL heparin was at least 20%, with all controls testing as expected (eg, inhibition at least 50% inhibited in the presence of 100 U/mL heparin and in the presence of Fc receptor‐blocking monoclonal antibody) and if at least one PF4‐dependent EIA was positive. The requirement for a positive EIA was to minimize risk of misclassifying a sample as being falsely positive in the SRA because of non‐HIT platelet‐activating factors. 8 The PF4‐SRA was regarded as positive if serotonin‐release of at least 20% over background was seen at both of the two PF4 concentrations tested, or 50% or more in at least one of the PF4 concentrations tested. The PF4/H‐SRA was regarded as positive if serotonin‐release of at least 20% over background was seen at the PF4/heparin concentration tested.
2.3. LIA
The LIA (HemosIL® HIT‐Ab(PF4‐H)) was performed using an ACL TOP® 500 CTS instrument (Instrumentation Laboratory) following the manufacturer's recommendations. Per the manufacturer, a test result of 1.0 U/mL or greater is considered positive (also per the manufacturer, results that round up to 1.0 [eg, 0.96 U/mL] are considered positive). The test range of the LIA is 0 to 5.7 U/mL. When positive results occur above this range, the test is automatically rerun, after making an on‐board 1/4 dilution, which expands the measurement range to 16.0 U/mL. However, we modified our test definition to perform additional automated on‐board dilutions (two‐fold, up to 1/32), which allowed for a (calculated) positive result as high as 182.4 U/mL. For samples that had automated on‐board dilutions performed yielding two results (eg, results at 1/8 and 1/16 dilutions), the result obtained at the highest dilution was used. Results are available approximately 20 minutes after preparation of citrated plasma.
2.4. CLIA
This rapid, automated chemiluminescence assay (Instrumentation Laboratory) detects binding of anti‐PF4/heparin antibodies to magnetic particles coated with PF4/PVS. 17 , 20 After incubation, magnetic separation, and a wash step, a tracer consisting of an isoluminol‐labeled antihuman IgG antibody is added, which binds to the captured anti‐PF4/heparin antibodies on the particles. After a second incubation, magnetic separation, and washing, reagents that cause chemiluminescence are added, with the emitted light (directly proportional to the concentration of anti‐PF4/heparin antibodies) measured by the instrument. Per the manufacturer, a test result of 1.00 U/mL or greater is considered positive. The test range of the CLIA is 0 to 128.00 U/mL. When positive results occur above this range, it is flagged as >Norm (and was classified as CLIA positive for this study). Results are available approximately 30 minutes after preparation of citrated plasma (or serum).
2.5. Operating characteristics of the combined analysis (LIA, CLIA)
For the derivation set of 430 plasma samples evaluated for the 4Ts trial, we determined the operating characteristics—sensitivity, specificity, positive predictive value (PPV), negative predictive value (NPV), likelihood ratio for a positive test result (LR+), likelihood ratio for a negative test result (LR−), and accuracy—for the combination of the LIA and CLIA test results, in relation to SRA‐positive status. Exact binomial confidence limits were calculated for test sensitivity, specificity, PPV, and NPV, 33 with 95% confidence intervals (CIs) for LR+ and LR− based on formulae provided by Simel et al. 34 All analyses were performed using R version 3.5.2 (2018‐12‐20). 35 For these analyses, the result was considered negative if both the LIA and CLIA were negative, and positive if at least one of the LIA or CLIA was positive. For determination of sensitivity of combined LIA/CLIA testing, we combined the data from all three patient groups, and determined the 95% CI for test sensitivity.
2.6. Magnitude of LIA/CLIA reactivities in predicting for SRA‐positive status
We were interested in determining whether assessment of LIA and CLIA reactivities in combination would yield meaningful differences in predictivity for SRA‐positive status. For these analyses, we classified positive samples as being weak, moderate, or strong, based upon the following classification (applicable to both the LIA and the CLIA):
Weak, 1.00‐4.99 U/mL;
Moderate, 5.00‐15.99 U/mL;
Strong, ≥16.00 U/mL.
We used two approaches for these analyses. Our first approach was to classify sample reactivity per the strongest result obtained in either the LIA or CLIA. For example, if a plasma sample yielded a weak‐positive result in the LIA, and a strong‐positive result in the CLIA, the sample was classified as giving a “strong” result. For our second approach, we used a points‐based system in which weak, moderate, and strong results were scored as 1, 2, and 3 points, respectively. Thus, a sample that gave a weak result with one assay, and a strong assay with the other, would score 4 points (1 + 3 points), whereas a sample that yielded strong results in both assays would be scored as 6 points (3 + 3 points). Accordingly, any sample tested could give one of seven different results; 0, 1, 2, 3, 4, 5, or 6 points (0 points indicated negative testing by both LIA and CLIA).
2.7. Stratum‐specific likelihood ratios
To provide a quantitative assessment of the differing levels of predictivity for a positive result of a given magnitude, we determined the stratum‐specific likelihood ratio (SSLR) for various results, using the following formula 16 with 95% CIs calculated per Peirce and Cornell. 36
2.8. Magnitude of LIA/CLIA reactivities in predicting for platelet‐activating antibodies
For patients who tested SRA‐negative even when the CLIA or LIA tested positive, we were interested in determining whether the samples might contain subthreshold platelet‐activating antibodies detectable by either the PF4‐SRA 29 or the PF4/H‐SRA. 26 We tested all available LIA‐ and/or CLIA‐positive samples, as well as 110 randomly selected plasma samples from patients who tested negative by both LIA and CLIA.
2.9. Further evaluation of patients predicted to have HIT per LIA/CLIA testing
We were interested in evaluating further any patient with moderate/strong combined LIA/CLIA test results (ie, 4 points or greater) who tested negative for platelet‐activating antibodies by SRA, PF4‐SRA, and PF4/H‐SRA. For any such patient recognized in Hamilton, the medical records were reviewed by an investigator (T.E.W.) experienced in evaluating patients with HIT, with a 4Ts score determined.
3. RESULTS
3.1. Diagnostic sensitivity of combined LIA/CLIA testing
We previously observed high sensitivity, approximately 95% and 98%, for the LIA and CLIA, respectively. 16 , 17 We were interested in determining whether diagnostic sensitivity could be improved by taking into account the results of both assays. For this analysis, a positive result (at the manufacturer's cutoff) with either (or both) the LIA and CLIA was considered positive, whereas negative results with both tests was considered negative.
Table 1 shows the sensitivity (95% CIs) for each of three patient groups, as well as the combined analysis. In general, an SRA‐positive sample that tested negative in the LIA tested positive in the CLIA, and vice versa. However, we did observe 3 SRA‐positive samples in the replication data set that tested negative in both the LIA and CLIA; these blood samples were referred from patients outside of Hamilton, and clinical information indicating whether a diagnosis of HIT was likely or not on clinical grounds was not available. Combining all three groups (n = 274 SRA‐positive samples), we found the sensitivity of dual LIA/CLIA testing to be high, at 98.9% (95% CI, 96.8%‐99.8%). This high sensitivity was comparable to that of PF4‐dependent EIAs. Indeed, for our replication data set, 93/94 (98.9%) of the SRA‐positive samples tested positive in the (polyspecific) EIA‐IgG/A/M, whereas 94/94 (100%) of the SRA‐positive samples tested positive in the in‐house IgG‐specific EIA (ie, there was a low “miss” rate for the EIAs comparable to that observed with dual LIA/CLIA testing).
Table 1.
Dual LIA/CLIA sensitivity in 3 different patient cohorts
| Number SRA+ | LIA+ | CLIA+ | LIA+ and/or CLIA+ | Sensitivity for LIA+ and/or CLIA+ (95% CI) | |
|---|---|---|---|---|---|
| 4Ts trial (derivation cohort) | 33 | 32 | 32 | 33 | 100% (89.4%‐100%) |
| Consecutive HGH patients (supplementary derivation cohort) | 147 | 143 | 144 | 147 | 100% (97.5%‐100%) |
| Referred samples (replication cohort) | 94 | 85 | 89 | 91 | 96.8% (91.0%‐99.3%) |
| Total | 274 | 260 | 265 | 271 | 98.9% (96.8%‐99.8%) |
For the referred patient samples, the polyspecific EIA (EIA‐IgGAM) tested positive in 93/94 (98.9%) samples tested, and the in‐house IgG‐specific EIA (EIA‐IgG) tested positive in 94/94 (100%) samples tested. Thus, dual LIA/CLIA screening had similar high diagnostic sensitivity as each of the two PF4‐dependent EIAs.
Abbreviations: 4Ts, four Ts scoring system; CLIA+, chemiluminescence immunoassay‐positive; HGH, Hamilton General Hospital; LIA+, latex immunoturbidimetric assay‐positive; SRA+, serotonin‐release assay‐positive.
3.2. Operating characteristics of dual LIA/CLIA testing
For determination of operating characteristics other than sensitivity, one requires inclusion of SRA‐negative patients within the analysis. These analyses are shown for the 4Ts data set (derivation data set), as well as for the replication data set. Table 2 illustrates the operating characteristics for dual LIA/CLIA testing in relation to SRA‐positive status as the reference standard. As before, a positive result in either (or both) the LIA and CLIA was considered positive, whereas negative results with both assays was considered negative.
Table 2.
Operating characteristics of dual LIA/CLIA testing (at manufacturer's cutoff). (A) Derivation data set (n = 430): 2 × 2 data presentation. (B) Derivation data set: operating characteristics. (C) Replication data set (no sample screening; n = 365): 2 × 2 data presentation. (D) Replication data set (no sample screening): operating characteristics. (E) Replication data set (sample screening; n = 313): 2 × 2 data presentation. (F) Replication data set: operating characteristics
| (A) | SRA‐positive (n = 33) | SRA‐negative (n = 397) |
|---|---|---|
| Both LIA and CLIA negative | 0 | 371 |
| Either LIA or CLIA (or both) positive | 33 | 26 |
| (B) | |
|---|---|
| Operating characteristic | Value (95% CI) |
| Sensitivity | 100% (89.4‐100) |
| Specificity | 93.5% (90.6‐95.7) |
| Positive predictive value (PPV) | 55.93% (42.4‐68.8) |
| Negative predictive value (NPV) | 100% (99.0‐100) |
| Likelihood ratio for a positive result (LR+) | 15.27 (10.5‐22.1) |
| Likelihood ratio for a negative result (LR−) | 0 (0‐undefined) |
| Accuracy | 94.0% (91.3‐96.0) |
| (C) | SRA‐positive (n = 29) | SRA‐negative (n = 336) |
|---|---|---|
| Both LIA and CLIA negative | 1 | 267 |
| Either LIA or CLIA (or both) positive | 28 | 69 |
| (D) | |
|---|---|
| Operating characteristic | Value (95% CI) |
| Sensitivity | 96.6% (82.2‐99.9) |
| Specificity | 79.5% (74.7‐83.7) |
| Positive predictive value (PPV) | 28.9% (20.1‐39.0) |
| Negative predictive value (NPV) | 99.6% (97.9‐100) |
| Likelihood ratio for a positive result (LR+) | 4.7 (3.8‐5.9) |
| Likelihood ratio for a negative result (LR−) | 0.043 (0.006‐0.298) |
| Accuracy | 80.8% (76.4‐84.7) |
| (E) | SRA‐positive (n = 65) | SRA‐negative (n = 248) |
|---|---|---|
| Both LIA and CLIA negative | 2 | 144 |
| Either LIA or CLIA (or both) positive | 63 | 104 |
| (F) | |
|---|---|
| Operating characteristic | Value (95% CI) |
| Sensitivity | 96.9% (89.3‐99.6) |
| Specificity | 58.1% (51.7‐64.3) |
| Positive predictive value (PPV) | 37.7% (30.4‐45.5) |
| Negative predictive value (NPV) | 98.6% (95.1‐99.8) |
| Likelihood ratio for a positive result (LR+) | 2.3 (2.0‐2.7) |
| Likelihood ratio for a negative result (LR−) | 0.053 (0.013‐0.208) |
| Accuracy | 66.1% (60.6‐71.4) |
Table 2A and B show the results for the derivation data set. For the replication data set, we found that operating characteristics differed depending on whether the referring hospital performed immunoassay “screening” for HIT antibodies before sending a sample to the McMaster Platelet Immunology Laboratory. Thus, our replication data are shown divided into whether samples referred from external laboratories did not undergo screening (Table 2C and D), or did undergo screening (Table 2E and F).
Interestingly, we found that the diagnostic specificity of dual LIA/CLIA testing was significantly higher for the derivation data set obtained from the 4Ts trial (specificity = 93.5% [371/397]; Table 2B) versus the replication data set (overall specificity = 70.4% [411/584]); P < .0001 (chi‐squared test). Moreover, within the replication data set, diagnostic specificity was greater if the referred samples did not undergo screening (specificity = 79.5% [267/336]; Table 2C and D) as compared with whether the referred samples did undergo screening (specificity = 58.1% [144/248]; Table 2E and F), with nonoverlapping 95% CIs for the specificity for each of the 3 groups (see Table 2) (all comparisons P < .0001 per chi‐squared test). Corresponding values for the PPV and LR+ also tended to be lower for the replication data sets versus the derivation data set.
To determine whether diagnostic specificity of the EIAs also differed between the derivation and replication cohorts, we calculated the operating characteristics (including specificity) for both the EIA‐IgGAM, as well as the EIA‐IgG, for the same patient groups for which the determinations were made for dual LIA/CLIA testing. Table 3 shows that the specificity of both EIAs was lower for the replication cohorts, particularly for the EIA‐IgG. As seen with the dual LIA/CLIA testing, the specificity of the EIA‐IgG was lower for the replication cohort that did not perform screening (vs the derivation cohort), and lower still for the replication cohort for which screening was done.
Table 3.
Operating characteristics of two EIAs. (A) Derivation data set (n = 430): 2 × 2 data presentation. (B) Derivation data set: operating characteristics of two EIAs. (C) Replication data set (no sample screening) (n = 365): 2 × 2 data presentation. (D) Replication data set: operating characteristics of two EIAs. (E) Replication data set (sample screening) (n = 313): 2 × 2 data presentation. (F) Replication data set: operating characteristics of two EIAs
| (A) | SRA+ (n = 33) | SRA− (n = 397) | SRA+ (n = 33) | SRA− (n = 397) | |
|---|---|---|---|---|---|
| EIA‐IgGAM− | 0 | 331 | EIA‐IgG− | 0 | 339 |
| EIA‐IgGAM+ | 33 | 66 | EIA‐IgG+ | 33 | 58 |
| (B) | ||
|---|---|---|
| Operating characteristic | EIA‐IgGAM (95% CI) | EIA‐IgG (95% CI) |
| Sensitivity | 100% (89.4‐100) | 100% (89.4‐100) |
| Specificity | 83.4% (79.3‐86.9) | 85.4% (81.5‐88.7) |
| PPV | 33.3% (24.2‐43.5) | 36.3% (26.4‐47.0) |
| NPV | 100% (98.9‐100) | 100% (98.9‐100) |
| LR+ | 6.0 (4.8‐7.5) | 6.8 (5.4‐8.7) |
| LR− | 0 (0‐undefined) | 0 (0‐undefined) |
| Accuracy | 84.7% (80.9‐87.9) | 86.5% (82.9‐89.6) |
| (C) | SRA+ (n = 29) | SRA− (n = 336) | SRA+ (n = 29) | SRA− (n = 335)* | |
|---|---|---|---|---|---|
| EIA‐IgGAM− | 0 | 266 | EIA‐IgG− | 0 | 242 |
| EIA‐IgGAM+ | 29 | 70 | EIA‐IgG+ | 29 | 93 |
| (D) | ||
|---|---|---|
| Operating characteristic | EIA‐IgGAM (95% CI) | EIA‐IgG (95% CI) |
| Sensitivity | 100% (88.1‐100) | 100% (88.1‐100) |
| Specificity | 79.2% (74.4‐83.4) | 78.3% (74.1‐82.1) |
| PPV | 29.3% (20.6‐39.3) | 23.8% (16.5‐32.3) |
| NPV | 100% (98.6‐100) | 100% (98.9‐100) |
| LR+ | 4.8 (3.9‐5.9) | 4.6 (3.8‐5.5) |
| LR− | 0 (0‐undefined) | 0 (0‐undefined) |
| Accuracy | 80.8% (76.4‐84.7) | 79.7% (75.7‐83.3) |
| (E) | SRA+ (n = 65) | SRA− (n = 248) | SRA+ (n = 65) | SRA− (n = 248) | |
|---|---|---|---|---|---|
| EIA‐IgGAM− | 1 | 126 | EIA‐IgG− | 0 | 138 |
| EIA‐IgGAM+ | 64 | 122 | EIA‐IgG+ | 65 | 110 |
| (F) | ||
|---|---|---|
| Operating characteristic | EIA‐IgGAM (95% CI) | EIA‐IgG (95% CI) |
| Sensitivity | 98.5% (91.7‐100) | 100% (94.5‐100) |
| Specificity | 50.8% (44.4‐57.2) | 55.7% (49.2‐61.9) |
| PPV | 34.4% (27.6‐41.7) | 37.1% (30.0‐44.8) |
| NPV | 99.2% (95.7‐100) | 100% (97.4‐100) |
| LR+ | 2.0 (1.8‐2.3) | 2.3 (2.0‐2.6) |
| LR− | 0.03 (0.004‐0.213) | 0 (0‐undefined) |
| Accuracy | 60.7% (55.1‐66.2) | 64.9% (59.3‐70.1) |
1 sample was NSQ (not sufficient quantity) for testing by EIA‐IgG.
3.3. SSLRs of dual LIA/CLIA testing
It is well‐established that the probability of SRA‐positive status (and hence the likelihood of a diagnosis of HIT) is strongly associated with the strength of positivity in a PF4‐dependent EIA, 21 , 22 , 23 as well as in the LIA 16 and CLIA. 17 We were therefore interested in determining if semi‐quantitative interpretation of combined LIA and CLIA results was also informative with respect to predicting SRA‐positive status. We performed this in two ways: strongest result (negative, weak, moderate, strong), or with each assay considered separately (6‐point scoring system). As preliminary results showed that the data were similar for both the derivation and replication cohorts, we show the combined results of all applicable data (n = 1108).
3.3.1. Strongest result analysis
Table 4 shows the analysis using the strongest result in either the LIA or the CLIA (n = 1108 samples). For a negative result in both assays, the frequency of a positive SRA was only 3/785 (0.4%), corresponding to a low LR− result (0.03); this low value reflects the aforementioned high sensitivity of combined LIA/CLIA testing. When combined LIA/CLIA testing yielded only a maximal weak‐positive result, the frequency of a positive SRA was relatively low (9.3%), with an SSLR+ that was marginally <1. The corresponding frequency of SRA positivity (56.3% and 92.2%, respectively) and SSLR+ values (9.9 and 91.4, respectively) were considerably greater when combined LIA/CLIA testing yielded a maximal moderate‐positive or strong‐positive result.
Table 4.
Strongest result for the LIA and CLIA: analysis per SRA‐positive (SRA+) status (n = 1108)
| Best result in the LIA and CLIA | SRA+ (n = 127) | SRA− (n = 981) | Proportion with SRA + result | LR (95% CI) |
|---|---|---|---|---|
| Negative in both assays (<1.00) | 3 | 782 | 3/785 (0.4%) | LR− = 0.03 (0.01‐0.08) |
| Weak (1.00‐4.99) is best result | 17 | 165 | 17/182 (9.3%) | SSLR+ = 0.8 (0.5‐1.3) |
| Moderate (5.00‐15.99) is best result | 36 | 28 | 36/64 (56.3%) | SSLR+ = 9.9 (6.3‐15.6) |
| Strong (≥16) is best result | 71 | 6 | 71/77 (92.2%) | SSLR+ = 91.4 (41.8‐199.7) |
For the column, Proportion with SRA + result, the results for the three groups are the same as positive predictive value (PPV) for the three groups labeled weak, moderate, and strong. For the first group, Negative in both assays, the inverse value of 782/785 (99.6%) can be considered as being the negative predictive value (NPV).
Abbreviations: CLIA, chemiluminescence immunoassay; LIA, latex immunoturbidimetric assay; SRA−, SRA‐negative; SRA+, SRA‐positive.
3.3.2. Semiquantitative analysis (6‐point system)
Table 5 shows the data for the semiquantitative analysis (6‐point system) for the endpoint of SRA‐positive status. For each stepwise increase in score, we observed a corresponding increase in the proportion of patients who tested (conventional) SRA‐positive, as well as in the SSLR+ value. For example, for a patient sample scored as only 1 point (ie, weak reaction in the LIA or CLIA, and negative in the other assay), the probability of SRA‐positive status was only 4.0%. In contrast, for a patient scoring 5 or 6 points (ie, moderate‐ or strong‐positive in one assay and strong‐positive in the other assay), the probability of SRA‐positive status was 65/68 (95.5%).
Table 5.
Dual LIA and CLIA tests per the 6‐point scale (semiquantitative analysis): analysis per SRA + status and predictivity for positive testing in PF4(±H)‐SRA
| CLIA/LIA Score | SRA+ (n = 127) | SRA− (n = 981) | Proportion SRA+ | Stratum‐specific likelihood ratios (95% CI) | Proportion of SRA − subjects (%) testing positive by PF4(±H)‐SRA |
|---|---|---|---|---|---|
| 0 | 3 | 782 | 3/785 (0.4%) | LR− = 0.03 (0.01‐0.08) | 3/117 (2.6%) |
| 1 | 6 | 145 | 6/151 (4.0%) | SSLR+ = 0.32 (0.15‐0.69) | 8/112 (7.1%) |
| 2 | 14 | 34 | 14/48 (29.2%) | SSLR+ = 3.18 (1.77‐5.71) | 12/31 (38.7%) |
| 3 | 21 | 13 | 21/34 (61.8%) | SSLR+ = 12.48 (6.48‐24.02) | 7/12 (58.3%) |
| 4 | 18 | 4 | 18/22 (81.8%) | SSLR+ = 34.76 (12.62‐95.77) | 3/3 (100%) |
| 5 | 30 | 2 | 30/32 (93.8%) | SSLR+ = 115.9 (32.3‐415.1) | 1/2 (50%) |
| 6 | 35 | 1 | 35/36 (97.2%) | SSLR+ = 270.4 (53.3‐1370.7) | 0/1 (0%) |
For both the LIA and the CLIA, scoring was as follows: weak‐positive result (1.00‐4.99 U/mL) = 1 point; moderate‐positive result (5.00‐15.9 U/mL) = 2 points; and strong‐positive result (≥16.0 U/mL) = 3 points. Thus, total points could range from 0 points to 6 points.
Abbreviations: CLIA, chemiluminescence immunoassay; LIA, latex immunoturbidimetric assay; LR−, likelihood ratio for a negative result; SRA−, serotonin‐release assay‐negative; SRA+, serotonin‐release assay‐positive; SSLR+, stratum‐specific likelihood ratio for a positive result within the stratum indicated.
3.3.3. Predictivity of the 6‐point scoring system for platelet‐activating antibodies, including subthreshold levels of antibodies detectable by PF4(±H)‐SRA
We and others have reported that occasional patients with HIT can test negative in the SRA, so‐called “SRA‐negative HIT”; in our laboratory, the frequency of SRA‐negative HIT is approximately 5% of patients with HIT. 27 , 28 We were interested in determining whether the proportion of SRA‐negative samples that nevertheless tested positive in a PF4‐enhanced SRA, either the PF4‐SRA or the PF4/H‐SRA, increased with increasing strength of reactivity in the combined LIA/CLIA testing, as per the 6‐point scoring system. This is shown in the rightmost column in Table 5 (Proportion of SRA− subjects testing positive by PF4(±H)‐SRA). We found that the proportion of subjects testing positive in one (or both) of the PF4‐dependent SRAs progressively increased with greater LIA/CLIA score. The proportion ranged from only 2.6% among patients scoring 0 points to 100% in patients scoring 4 points (some anomalous reaction patterns seen in the few SRA‐negative subjects who scored 5 and 6 points is discussed subsequently).
An intriguing finding was the very high proportion of patients with platelet‐activating antibodies among patients whose LIA/CLIA scores were in the mid‐range, (ie, 2 to 4 points). We found that 14/48 (29.2%) of subjects with 2 points had a positive SRA, and 12/31 subjects with available residual sample were found to test positive in a PF4‐enhanced SRA. Thus, at least 54% (26/48) of the patients who scored 2 points had detectable platelet‐activating antibodies (a sample was not available for further testing in three patients). The proportion of patients who had platelet‐activating antibodies was even higher for patients who scored 3 or 4 points. For example, 61.8% (21/34) of subjects with LIA/CLIA score of 3 points were SRA‐positive, and 7/12 (58.3%) of the remaining SRA‐negative subjects had detectable platelet‐activating antibodies by PF4‐dependent SRA. Thus, at least 28/34 (82.3%) of patients scoring 3 points had platelet‐activating antibodies (a sample was not available for further testing in one patient). Further, for the patients who scored 4 points, 18 of 22 were SRA‐positive, and three of three (100%) of the remaining SRA‐negative patients who had available sample for further testing yielded a positive test in a PF4‐dependent SRA, indicating that at least 95.5% (21/22) of subjects scoring 4 points had detectable platelet‐activating antibodies (a sample was not available for further testing in one patient).
The proportion of detectable platelet‐activating antibodies was very high (>95%) in subjects who scored 5 or 6 points. Combining these two groups, 65/68 (95.6%) subjects tested SRA‐positive, with one of three (33.3%) SRA‐negative subjects testing positive in a PF4‐dependent SRA. Thus, 66/68 (97.1%) of patients scoring 5 or 6 points had detectable platelet‐activating antibodies.
3.3.4. Further evaluation of a patient scoring 5 points but with negative SRA, PF4‐SRA, and PF4/H‐SRA
As noted in the previous section, there were two patients who tested 4 points or higher in dual LIA/CLIA testing but in whom we could not detect platelet‐activating antibodies by SRA, PF4‐SRA, or PF4/H‐SRA. One of these two patients was a local patient in Hamilton, which allowed us to evaluate the clinical features of this patient. This patient's plasma yielded a LIA/CLIA score of 5 points, based upon moderate‐positive LIA (7.3 U/mL) and strong‐positive CLIA (18.86 U/mL). Figure 1 shows the clinical and laboratory picture of this patient case. This patient was judged on clinical grounds (4Ts scoring system) to have a high clinical probability for HIT, based upon 2 points for thrombocytopenia (platelet count fall of 75% from 212 to 53 × 109/L [nadir]), 2 points for day 5 timing of onset of thrombocytopenia in relation to first dose of heparin, 1 point for thrombosis (repeated filter thrombosis during continuous renal replacement therapy), and 1 point for other explanation for thrombocytopenia not identified (critical illness, including use of vasopressors). Moreover, this patient had strong‐positive testing in 2 IgG‐dependent EIAs. Indeed, the patient was managed as a presumptive HIT patient by the clinical service, including switching the patient from heparin to fondaparinux, with rapid platelet count recovery. This case suggests that the patient might well have had HIT despite the negative findings by all three tests for platelet‐activating antibodies.
Figure 1.
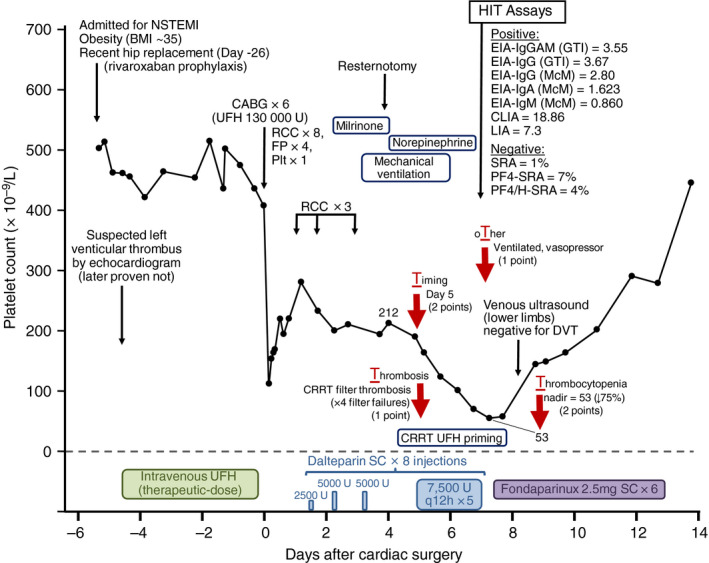
Clinical course and laboratory test results in a patient with LIA/CLIA score of 5 points but negative testing for platelet‐activating antibodies. The patient was scored as high probability for HIT (6 points per the 4Ts scoring system) although the possibility of non‐HIT critical illness‐associated consumptive thrombocytopenia cannot be completely excluded. The four red arrows correspond to the four components of the 4Ts scoring system, and the associated text provides information that supports the score that was given. For one of the EIAs—the EIA‐IgG(GTI)—the high heparin maneuver was performed, with 89% inhibition of reactivity seen at high heparin concentrations. BMI, body mass index; CABG × 6, coronary artery bypass grafting (six grafts); CLIA, chemiluminescence immunoassay; CRRT, continuous renal replacement therapy; DVT, deep vein thrombosis; EIA‐IgA (McM), IgA‐specific in‐house PF4/heparin EIA of the McMaster Platelet Immunology Laboratory; EIA‐IgG (GTI), commercial (from GTI) IgG‐specific PF4/PVS EIA; EIA‐IgG (McM), IgG‐specific in‐house PF4/heparin EIA of the McMaster Platelet Immunology Laboratory; EIA‐IgGAM (GTI), commercial (from GTI) polyspecific PF4/PVS EIA that detects antibodies of IgG, IgA, and/or IgM classes; EIA‐IgM (McM), IgM‐specific in‐house PF4/heparin EIA of the McMaster Platelet Immunology Laboratory; FP, frozen plasma (units); HIT, heparin‐induced thrombocytopenia; LIA, latex immunoturbidimetric assay; NSTEMI, non‐ST‐elevation myocardial infarction; PF4/H‐SRA, PF4/heparin serotonin‐release assay; PF4‐SRA, PF4‐enhanced serotonin‐release assay; Plt, platelet transfusion (adult dose); q12 h, every 12 hours; RCC, red cell concentrate; SC, subcutaneous; SRA, serotonin‐release assay; U, units; UFH, unfractionated heparin
4. DISCUSSION
Our study demonstrates how the combination of two complementary automated rapid assays for HIT can be used for diagnosis of this adverse drug reaction. In particular, we found that combined LIA/CLIA testing achieves high diagnostic sensitivity (~99%) similar to that seen with the PF4‐dependent EIAs. Moreover, our study also shows that both the LIA and the CLIA can be considered to be semiquantitative assays similar to PF4‐dependent EIAs, and that by combining the strength of each reaction, one can predict the likelihood of detecting platelet‐activating antibodies. For example, for a patient who tested weakly positive in the LIA and negative in the CLIA (or vice versa), corresponding to a score of 1 point in our 6‐point scoring system, the probability of platelet‐activating antibodies being detectable was only approximately 5%. This is similar to the probability of a sample testing SRA‐positive when the EIA is only weakly positive (0.40‐0.99 OD units). 21 At the other extreme, for a patient sample that scored 4 points or greater in our 6‐point scoring system (ie, at least either moderate‐positive in both the LIA or CLIA, or strong‐positive in one automated assay but only weak‐positive in the other), the probability of the presence of platelet‐activating antibodies exceeded 95%. This is similar to the predictivity for a positive SRA in samples with an EIA reactivity of 2.00 OD units or greater. 21 However, unlike EIAs, where testing is usually performed in batches and thus results are not usually obtained for at least several hours (and typically not until the next day), the results of the automated assays can be obtained within 30 minutes of the start of testing.
We found that the diagnostic specificity of the combined LIA/CLIA analysis was lower in the replication data set compared with the initial derivation data set. We note that whereas the samples for the derivation data set were obtained during the conduct of the 4Ts trial (with sample acquisition between 2008 and 2013), the replication data set was generated from samples obtained in the recent past (from August 2018 to November 2019). There are two factors that could plausibly account for these differences in specificity. First, it seems likely that some clinicians are ordering HIT testing less often in low pretest probability situations (per Choosing Wisely 37 and American Society of Hematology HIT guidelines recommendations 38 ). Second, some laboratories send samples to the McMaster Platelet Immunology Laboratory if a local screening immunoassay returns positive, thus prompting sample referral for determination of presence of platelet‐activating antibodies by SRA. Indeed, we found that the specificity of both the LIA/CLIA, as well as the two EIAs, was lower for samples obtained from centers that performed local screening (Tables 2 and 3). Clinicians as well as laboratory personnel should be aware that diagnostic specificity is not an inherent property of a laboratory test but rather reflects the prevalence of a disease within a population that undergoes testing, as well as the background rate of factors that could influence false‐positive test results. This is especially an issue with testing for HIT antibodies because only a minority of anti‐PF4/heparin antibodies triggered by heparin exposure are platelet‐activating and hence potentially pathogenic; nevertheless, these nonpathogenic antibodies can be detected (to various degrees) by different immunoassays. 20 Accordingly, any change in testing practice that enriches the sample population for such subclinical antibodies, such as avoiding testing in low probability situations, or in screening samples for antibody positivity before referral for additional testing, will decrease diagnostic specificity. This underscores the importance of considering the magnitude of test reactivity in determining the likelihood of HIT, rather than a single cutoff between a negative and positive result.
The simple 6‐point scale we describe builds on our previous studies in which we reported that both the LIA 16 and the CLIA 17 provide semiquantitative diagnostic information. Per Table 5, we now show that combining LIA/CLIA results provides a graded range of predictivity for presence of platelet‐activating antibodies. Indeed, for a score of 4 points or greater (ie, both the LIA and CLIA yield either moderate or strong positive results), we found the patient to have near‐certain presence of platelet‐activating antibodies (~98%). Indeed, we found only two patients who tested negative for platelet‐activating antibodies by all three assays we performed (SRA, PF4‐SRA, PF4/H‐SRA), among 89 such patient samples identified and for which residual serum or plasma was available to further testing for platelet‐activating antibodies by all three platelet activation assays. Of these two patients in whom we failed to detect platelet‐activating antibodies, there was one patient (from Hamilton) in whom further clinical information was available. As shown in Figure 1, this patient had a clinical course compatible with HIT. These data support the findings of Marchetti and colleagues, 15 who also observed that patients who tested strongly positive in rapid assays (in their study, the combination of the CLIA and the particle gel immunoassay) were likely to have had HIT even when the functional (platelet activation) reference standard assay was negative.
Overall, of 1108 patients evaluated, 785 (70.8%) had a score of 0 points (with frequency of possible HIT per conventional SRA of only 0.4%), and 90 (8.1%) had score of 4 points or greater (near certain diagnosis of HIT). Thus, for at least three‐quarters of the patients evaluated, combined LIA/CLIA testing would provide a result that would either very strongly point away from HIT (LR− of only 0.03) or point strongly toward HIT (SSLR+ of >100). Moreover, for the remaining ~20% of patients, a graded probability of being SRA‐positive, ranging from ~4% to ~62%, would be available, which could guide clinical practice until further test results are available.
CONFLICT OF INTEREST
Dr. Warkentin reports having received consulting fees from Aspen Global, Bayer, CSL Behring, Ergomed, and Octapharma; honoraria for lectures from Alexion; research support from Instrumentation Laboratory; royalties from Informa (Taylor & Francis); and consulting fees related to medical‐legal testimony. The remaining authors declare no competing financial interests.
AUTHOR CONTRIBUTIONS
T.E. Warkentin designed the research study, performed the main analyses, and reviewed clinical data when applicable. J.I. Sheppard performed the LIA and CLIA testing for the derivation data set and was responsible for managing the data set and for preparing the figure. J.C. Moore performed the LIA and CLIA testing for the replication data set. J.W. Smith performed the PF4‐dependent platelet activation assays. N. Li performed the statistical analyses. T.E. Warkentin and J.I. Sheppard wrote the first draft of the manuscript. I. Nazy and D.M. Arnold oversaw the McMaster Platelet Immunology Laboratory investigations and edited the manuscript. All authors reviewed and approved the final version of the manuscript. ORCID profiles: IN, 0000‐0002‐5695‐4343; TEW, 0000‐0002‐8046‐7588.
ACKNOWLEDGEMENTS
This study was funded by Instrumentation Laboratory (Bedford, MA), the manufacturer of the LIA (HemosIL HIT‐Ab(PF4‐H)) and the IgG‐specific CLIA (HemosIL® AcuStar HIT‐IgG(PF4‐H)). The sponsor had no role in the design of the study, performance of the assays, or analysis of the results. The sponsor provided comments to the manuscript, but all final decisions regarding manuscript content were made by the authors. The authors thank Ms Hina Bhakta for performing the serotonin‐release assay.
Warkentin TE, Sheppard J‐AI, Smith JW, et al. Combination of two complementary automated rapid assays for diagnosis of heparin‐induced thrombocytopenia (HIT). J Thromb Haemost. 2020;18:1435–1446. 10.1111/jth.14794
Manuscript handled by: Andreas Greinacher
Final decision: Andreas Greinacher and 10‐Mar‐2020
REFERENCES
- 1. Cuker A. Clinical and laboratory diagnosis of heparin‐induced thrombocytopenia: an integrated approach. Semin Thromb Hemost. 2014;40(1):106‐114. [DOI] [PubMed] [Google Scholar]
- 2. Greinacher A. Clinical practice. Heparin‐induced thrombocytopenia. N Engl J Med. 2015;373(3):252‐261. [DOI] [PubMed] [Google Scholar]
- 3. Arepally GM. Heparin‐induced thrombocytopenia. Blood. 2017;129(21):2864‐2872. [DOI] [PMC free article] [PubMed] [Google Scholar]
- 4. Warkentin TE, Levine MN, Hirsh J, et al Heparin‐induced thrombocytopenia in patients treated with low‐molecular‐weight heparin or unfractionated heparin. N Engl J Med. 1995;332(20):1330‐1335. [DOI] [PubMed] [Google Scholar]
- 5. Kelton JG, Sheridan D, Santos A, et al Heparin‐induced thrombocytopenia: laboratory studies. Blood. 1988;72(3):925‐930. [PubMed] [Google Scholar]
- 6. Chong BH, Fawaz I, Chesterman CN, Berndt MC. Heparin‐induced thrombocytopenia: mechanism of interaction of the heparin‐dependent antibody with platelets. Br J Haematol. 1989;73(2):235‐240. [DOI] [PubMed] [Google Scholar]
- 7. Greinacher A, Juhl D, Strobel U, et al Heparin‐induced thrombocytopenia: a prospective study on the incidence, platelet‐activating capacity and clinical significance of anti‐PF4/heparin antibodies of the IgG, IgM, and IgA classes. J Thromb Haemost. 2007;5(8):1666‐1673. [DOI] [PubMed] [Google Scholar]
- 8. Warkentin TE, Greinacher A, Gruel Y, Aster RH, Chong BH, Scientific and Standardization Committee of the International Society on Thrombosis and Haemostasis . Laboratory testing for heparin‐induced thrombocytopenia: a conceptual framework and implications for diagnosis. J Thromb Haemost. 2011;9(12):2498‐2500. [DOI] [PubMed] [Google Scholar]
- 9. Nagler M, Bakchoul T. Clinical and laboratory tests for the diagnosis of heparin‐induced thrombocytopenia. Thromb Haemost. 2016;116(5):823‐834. [DOI] [PubMed] [Google Scholar]
- 10. Warkentin TE. Laboratory diagnosis of heparin‐induced thrombocytopenia. Int J Lab Hematol. 2019;41(Suppl. 1):15‐25. [DOI] [PubMed] [Google Scholar]
- 11. Sheridan D, Carter C, Kelton JG. A diagnostic test for heparin‐induced thrombocytopenia. Blood. 1986;67(1):27‐30. [PubMed] [Google Scholar]
- 12. Warkentin TE, Arnold DM, Nazi I, Kelton JG. The platelet serotonin‐release assay. Am J Hematol. 2015;90(6):564‐572. [DOI] [PubMed] [Google Scholar]
- 13. Greinacher A, Michels I, Kiefel V, Mueller‐Eckhardt C. A rapid and sensitive test for diagnosing heparin‐induced thrombocytopenia. Thromb Haemost. 1991;66(6):734‐736. [PubMed] [Google Scholar]
- 14. Sun L, Gimotty PA, Lakshmanan S, Cuker A. Diagnostic accuracy of rapid immunoassays for heparin‐induced thrombocytopenia. A systematic review and meta‐analysis. Thromb Haemost. 2016;115(5):1044‐1055. [DOI] [PubMed] [Google Scholar]
- 15. Marchetti M, Barelli S, Zermatten MG, et al. Rapid and accurate Bayesian diagnosis of heparin‐induced thrombocytopenia. Blood. 2020;135(14):1171‐1184. [DOI] [PubMed] [Google Scholar]
- 16. Warkentin TE, Sheppard JI, Linkins LA, Arnold DM, Nazy I. Performance characteristics of an automated latex immunoturbidimetric assay [HemosIL® HIT‐Ab(PF4‐H)] for the diagnosis of immune heparin‐induced thrombocytopenia. Thromb Res. 2017;153:108‐117. [DOI] [PubMed] [Google Scholar]
- 17. Warkentin TE, Sheppard JI, Linkins LA, Arnold DM, Nazy I. High sensitivity and specificity of an automated IgG‐specific chemiluminescence immunoassay for diagnosis of HIT. Blood. 2018;132(12):1345‐1349. [DOI] [PMC free article] [PubMed] [Google Scholar]
- 18. Warkentin TE. Demand on‐demand testing for the diagnosis of heparin‐induced thrombocytopenia. Thromb Res. 2016;140:163‐164. [DOI] [PubMed] [Google Scholar]
- 19. Nagler M, Cuker A. Profile of instrumentation laboratory’s HemosIL® AcuStar HIT‐Ab(PF4‐H) assay for diagnosis of heparin‐induced thrombocytopenia. Expert Rev Mol Diagn. 2017;17(5):419‐426. [DOI] [PubMed] [Google Scholar]
- 20. Warkentin TE, Greinacher A. Laboratory testing for heparin‐induced thrombocytopenia In: Warkentin TE, Greinacher A, editors. Heparin‐Induced Thrombocytopenia (5th edn). Boca Raton, FL: CRC Press; 2013:272‐314. [Google Scholar]
- 21. Warkentin TE, Sheppard JI, Moore JC, Sigouin CS, Kelton JG. Quantitative interpretation of optical density measurements using PF4‐dependent enzyme‐immunoassays. J Thromb Haemost. 2008;6(8):1304‐1312. [DOI] [PubMed] [Google Scholar]
- 22. Bakchoul T, Giptner A, Najaoui A, Bein G, Santoso S, Sachs UJH. Prospective evaluation of PF4/heparin immunoassays for the diagnosis of heparin‐induced thrombocytopenia. J Thromb Haemost. 2009;7(8):1260‐1265. [DOI] [PubMed] [Google Scholar]
- 23. Greinacher A, Ittermann T, Bagermühl J, et al Heparin‐induced thrombocytopenia: towards standardization of platelet factor 4/heparin antigen tests. J Thromb Haemost. 2010;8(9):2025‐2031. [DOI] [PubMed] [Google Scholar]
- 24. Padmanabhan A, Jones CG, Curtis BR, et al A novel PF4‐dependent platelet activation assay identifies patients likely to have heparin‐induced thrombocytopenia/thrombosis. Chest. 2016;150(3):506‐515. [DOI] [PMC free article] [PubMed] [Google Scholar]
- 25. Pandya KA, Johnson EG, Davis GA, Padmanabhan A. Serotonin release assay (SRA)‐negative HIT, a newly recognized entity: implications for diagnosis and management. Thromb Res. 2018;172:169‐171. [DOI] [PubMed] [Google Scholar]
- 26. Vayne C, Guery EA, Kizlik‐Masson C, et al Beneficial effect of exogenous platelet factor 4 for detecting pathogenic heparin‐induced thrombocytopenia antibodies. Br J Haematol. 2017;179(5):811‐819. [DOI] [PubMed] [Google Scholar]
- 27. Warkentin TE, Sheppard JI, Smith JW, Arnold DM, Nazy I. Timeline of heparin‐induced thrombocytopenia seroconversion in serial plasma samples tested using an automated latex immunoturbidimetric assay. Int J Lab Hematol. 2019;41(4):493‐502. [DOI] [PMC free article] [PubMed] [Google Scholar]
- 28. Warkentin TE, Nazy I, Sheppard JI, Smith JW, Kelton JG, Arnold DM. Serotonin‐release assay‐negative heparin‐induced thrombocytopenia. Am J Hematol. 2020;95(1):38‐47. [DOI] [PubMed] [Google Scholar]
- 29. Nazi I, Arnold DM, Warkentin TE, Smith JW, Staibano P, Kelton JG. Distinguishing between anti‐platelet factor 4/heparin antibodies that can and cannot cause heparin‐induced thrombocytopenia. J Thromb Haemost. 2015;13(10):1900‐1907. [DOI] [PubMed] [Google Scholar]
- 30. Linkins LA, Bates SM, Lee AYY, Heddle NM, Wang G, Warkentin TE. Combination of 4Ts score and PF4/H‐PaGIA for diagnosis and management of heparin‐induced thrombocytopenia: prospective cohort study. Blood. 2015;126(5):597‐603. [DOI] [PubMed] [Google Scholar]
- 31. Visentin GP, Moghaddam M, Beery SE, McFarland JG, Aster RH. Heparin is not required for detection of antibodies associated with heparin‐induced thrombocytopenia/thrombosis. J Lab Clin Med. 2001;138(1):22‐31. [DOI] [PubMed] [Google Scholar]
- 32. Horsewood P, Warkentin TE, Hayward CPM, Kelton JG. The epitope specificity of heparin‐induced thrombocytopenia. Br J Haematol. 1996;95(1):161‐167. [DOI] [PubMed] [Google Scholar]
- 33. Collett D. Modelling Binary Data. Boca Raton, FL: Chapman & Hall/CRC; 1999:24. [Google Scholar]
- 34. Simel DL, Samsa GP, Matchar DB. Likelihood ratios with confidence: sample size estimation for diagnostic test studies. J Clin Epidemiol. 1991;44(8):763‐770. [DOI] [PubMed] [Google Scholar]
- 35. R Core Team . R: A Language and Environment for Statistical Computing. Vienna, Austria: R Foundation for Statistical Computing; 2018. [Google Scholar]
- 36. Peirce JC, Cornell RG. Integrating stratum‐specific likelihood ratios with the analysis of ROC curves. Medical Decis Making. 1993;13(2):141‐151. [DOI] [PubMed] [Google Scholar]
- 37. Hicks LK, Bering H, Carson KR, et al. Five hematologic tests and treatments to question. Blood. 2014;124(24):3524‐3528. [DOI] [PubMed] [Google Scholar]
- 38. Cuker A, Arepally GM, Chong BH, et al American Society of Hematology 2018 guidelines for management of venous thromboembolism: heparin‐induced thrombocytopenia. Blood Adv. 2018;22(2):3360‐3392. [DOI] [PMC free article] [PubMed] [Google Scholar]