

Abstract
Aims
To investigate the impact on weight loss of the treatment changes in overweight or obese people that may be needed in case of gastrointestinal (GI) tolerability issues during escalation of the glucagon‐like peptide‐1 analogue liraglutide.
Materials and methods
The individual longitudinal body weight data from the main trial periods of three phase II/III trials in overweight or obese patients (56‐week treatment with once‐daily liraglutide 1.2, 1.8, 2.4 or 3.0 mg or placebo, n = 4952) were analysed using a non‐linear mixed‐effect modelling approach. Individual pharmacokinetic profiles were derived based on published pharmacokinetic models. Baseline body weight, baseline glycated haemoglobin (HbA1c), age, gender, diabetes status (no diabetes, prediabetes or type 2 diabetes), race and trial region were investigated as covariates. As a form of external validation, the model was used to predict the weight regain after treatment cessation at week 56 (data not included in model development).
Results
A pharmacokinetic/pharmacodynamic model provided an adequate description of the weight loss trajectories for all studied doses. Gender and diabetes status were identified as the most influential covariates, and an underlying seasonal weight fluctuation was identified. Slower than that recommended, one‐week dose‐escalation algorithms led up to 2 weeks slower initial weight loss but similar long‐term weight loss trajectories.
Conclusions
The relationship between liraglutide systemic exposure and weight loss was successfully established in overweight or obese people. The model could predict the time course of weight regain after treatment cessation and suggests that GI tolerability can be mitigated by slower escalation with only minor impact on the weight loss trajectory.
Keywords: clinical trial, dose–response relationship, GLP‐1 analogue, liraglutide, pharmacodynamics
1. INTRODUCTION
The global obesity epidemic continues to grow, with an estimated 38% of the world's adult population predicted to be overweight and 20% obese by 2030.1, 2, 3 Even though first‐line interventions, such as diet and increased physical activity, can lead to weight loss, studies show that people tend to regain the lost weight in the long term, potentially owing to well‐regulated body weight homeostatic mechanisms and decreased effort regarding weight maintenance over time.4, 5, 6 Thus, effective and well‐tolerated interventions are needed to aid with weight reduction and help sustain the lost weight in the long term. Novel incretin hormone‐based pharmacotherapeutic approaches have been proposed as a viable strategy for weight management in overweight or obese patients. Glucagon‐like peptide‐1 (GLP‐1) is a member of the incretin hormone family that stimulates insulin secretion and dose‐dependently inhibits glucagon secretion. It has been shown to lead to weight loss via a reduction in energy intake by increasing satiety and reducing hunger.7, 8, 9, 10, 11, 12
Liraglutide is an acylated human GLP‐1 receptor agonist with a half‐life of ~13 hours following subcutaneous injection, supporting a once‐daily dosing regimen.13, 14 While the positive correlation of liraglutide therapy and weight loss has been established, the objective of the present analysis was to further describe how the systemic concentration of liraglutide is quantitatively linked to weight loss over time.13, 14, 15 Quantitative approaches, such as population pharmacokinetic/pharmacodynamic (PK/PD) modelling, can be used to describe and quantify the relationships and can delineate both the maximal effects expected from a pharmacotherapeutic intervention and the rate over time at which these changes take place.16
Gastrointestinal (GI) side effects, such as nausea and vomiting, are the most common side effects of liraglutide therapy and have been shown to be transient over time due to tolerance development.17 To reduce the likelihood of GI side effects, a dose‐escalation algorithm is used during the treatment initiation phase, with 0.6 mg as the starting dose and a weekly increment of 0.6 mg up to the target 3.0 mg dose.18, 19, 20, 21 If patients do not tolerate the increased dose, it is recommended to delay the dose escalation by 1 week.18, 19, 20, 21 However, the impact on long‐term weight loss with more conservative algorithms than the standard escalation algorithm is currently unknown. Additionally, patients who discontinue liraglutide treatment have been shown to regain some of the lost weight, but the rate at which this weight regain happens is also unknown.
The aim of the present study was to describe and quantify the longitudinal trajectories of weight loss in overweight or obese people undergoing treatment with liraglutide using a population PK/PD modelling approach and to evaluate the impact of covariates. The developed model was used to investigate the impact of slower dose escalations on the long‐term weight changes and explore the rate at which weight is regained after cessation of liraglutide treatment.
2. METHODS
2.1. Data description
Data from three randomized, controlled phase II and III trials, Trial 1: SCALE Obesity and Prediabetes (NCT00422058)22, Trial 2: SCALE Diabetes (NCT01272232)23 and Trial 3: phase II, dose‐finding trial (NCT00422058),24 were used to develop a population PK/PD model for liraglutide‐induced weight loss. The double‐blind, placebo‐controlled, parallel‐group studies were performed in: overweight or obese adults with at least one weight‐related comorbidity (ie, hypertension and/or dyslipidaemia; Trial 1), overweight or obese adults with type 2 diabetes mellitus (Trial 2) or obese adults (without diabetes/weight‐related comorbidity; Trial 3).
Participants were randomized to once‐daily liraglutide or liraglutide placebo injections, both as an adjunct to a reduced‐calorie diet, and increased physical activity. Participants receiving liraglutide were initiated at a dose of 0.6 mg/d, with weekly dose increments of 0.6 mg up to the allocated randomization dose. Trials 1 and 2 consisted of a 56‐week main trial period and 12‐week re‐randomization and follow‐up periods, leading to an overall duration of 68 weeks. In Trial 1, at week 56, all participants who did not have prediabetes at baseline were re‐randomized 1:1 to either continue liraglutide treatment or be switched to placebo. In Trial 2, all participants discontinued liraglutide treatment and were followed up for a 12‐week period. The duration of Trial 3 was 20 weeks of treatment. In Trials 1 and 2, participants who discontinued (left/were withdrawn from) the trial prematurely before week 56, were asked, if possible, to return to the trial sites 56 weeks after randomization, and their weight at that time was recorded (retrieved dropouts).
2.2. Model development and evaluation
A PK/PD model for body weight change from baseline for placebo and liraglutide‐treated participants was developed using data from the main phase of the trials, that is, 56 weeks for Trials 1 and 2, and 20 weeks for Trial 3. Individual liraglutide plasma concentrations were predicted using the individual parameter estimates (empirical Bayes estimates) from a previously developed population PK model (one‐compartment model with linear absorption and elimination; Equation S1).25 For participants for whom individual estimates for variables were not available, these were approximated using the same PK model, in combination with the individual baseline characteristics.
Various structural models were explored to describe the time course of weight change from baseline for placebo‐ and liraglutide‐treated participants. Exposure–response data over different weeks identified a deviation from a classic indirect response model previously used to describe weight loss over time.26 Additionally, while an indirect response model could characterize the long‐term weight changes for both the placebo and the on‐treatment groups, it consistently under‐predicted the weight changes in the treatment initiation time period.27 For this reason, and for consistency with the current understanding of the physiological changes that occur when initiating a weight management intervention, the model was expanded to incorporate a bi‐phasic structure, which consists of an early and a sustained weight change phase.6
The bi‐phasic model was parameterized as the sum of two processes, both represented by indirect response models, a transient (fast) weight loss phase with rate d(wfast)/dt and a sustained (slow) weight loss phase with rate d(wslow)/dt. The transient weight loss phase was described by a two‐exponential model with a bi‐phasic pattern, allowing for a time‐dependent production rate. Additionally, because the data indicated a dependency on the time of the year, this was accounted for by estimating the underlying oscillations in body weight over the time of the year using a cosine function. The PK/PD model was implemented based on the equations below:
The overall weight change is given by:
| (1) |
The transient (fast) weight loss phase is given by:
| (2) |
where wfast is the transient (fast) weight loss, k1 is the transient body weight gain/loss rate constant, Pmax, fast is the maximum transient placebo effect, Emax, fast is the maximum transient liraglutide effect (equals zero for the placebo group) and keff is the transient body weight loss rate constant for the liraglutide treatment group.
The sustained (slow) weight loss phase is given by:
| (3) |
where wslow is the sustained (slow) weight loss, k2 is the sustained body weight gain/loss rate constant, Pmax, slow is the maximum sustained placebo effect, PRbnd is a slope parameter allowing for weight gain over time (disease progression), PAmpis the amplitude of the weight change that can be attributed to the time of the year, day.of.year represents the time of the year in days, ranging between 1 and 365 for January 1 and December 31, respectively, Emax, slow is the maximal sustained liraglutide effect, EC50 is the liraglutide concentration leading to half‐maximal sustained liraglutide effect and c represents the individually predicted liraglutide concentrations. All rate constants were parameterized as half‐lives for easier interpretation (i.e. Thalf = ln(2)/k). Modelling was performed on per cent change from baseline transformed data. The initial conditions for the differential equations described by Equation 2 and Equation 3 were equal to zero.
Population PK/PD analysis for repeated measures was performed using non‐linear mixed‐effects modelling with NONMEM® (version 7.3, ICON Development Solutions, Hanover, Maryland).28 Parameter estimation was performed using the first‐order conditional estimation method with interaction (FOCE‐I). Pirana was used as a user interface for the model development procedure, and Perl speaks NONMEM (PsN) version 4.6.0 was used for controlling NONMEM runs.29 R version 3.5.2 (R Foundation for Statistical Computing) was used for dataset creation and graphical visualization.30
Inter‐individual variability (IIV) for model variables was evaluated using the normal or log‐normal distribution (mean of 0 and variance of ω2). A systematic stepwise search for IIV was performed based on the maximum likelihood. IIV was included following a significant decrease in the objective function value (ΔOFV>10.83, P <0.001) and a reduction in unexplained residual variability >10%. IIV was assumed to be mutually independent. Residual unexplained variability was modelled using an additive residual error model. A detailed description of the model‐building strategy is provided in the Supporting Information.
A predefined set of covariates based on prior knowledge of the liraglutide mechanism and previous liraglutide exposure–response analyses were tested using a stepwise covariate search algorithm for all variables identified with IIV (forward inclusion: P <0.01; backwards elimination P <0.001).15, 26, 29 The covariates assessed were: baseline body weight, baseline HbA1c, age at baseline, diabetes status (no diabetes, prediabetes or type 2 diabetes), sex (female/male), race (white, black or African American, Native Hawaiian or other Pacific Islander and American Indian or Alaska native) and trial region (Europe and Oceania, North America, Asia, Africa and South America). A detailed description of the covariate selection strategy is provided in the Supporting Information.
The influence of time of the year on the rate of weight change was initially graphically explored. First, using a temporary and exploratory model structure (Supporting Information, yearly variation sub‐model), we estimated deviation factors for each month of the year, using January as reference. An oscillation pattern would be indicative of an underlying structure, suggesting the influence of time of the year on weight change. Following the identification of the weight oscillation pattern, different seasonal fluctuation sub‐models were explored, and the final model was qualified based on the objective function and visual improvement in goodness‐of‐fit plots.
The precision of model parameters was derived by performing a sampling‐importance‐resampling procedure.31 The performance of the final model was investigated via a visual predictive check to determine if the model accurately reproduced the variability in the observed data.
2.3. Simulations of treatment initiation algorithms and weight regain following cessation of treatment
Using the final model and assuming a population consisting of the same gender and trial region ratios, as observed in Trial 1, three scenarios for treatment initiation algorithms were simulated. Liraglutide therapy is suggested to be initiated at a dose of 0.6 mg/d with weekly dose increments of 0.6 mg/d to mitigate the risk of GI side effects (nausea and vomiting). To explore the influence of more conservative dose‐escalation algorithms in the 1‐year weight loss trajectories, algorithms based on dose escalation every 2 and 3 weeks were simulated. Additionally, to explore the time course of weight regain following treatment cessation, the following four different scenarios were simulated: liraglutide treatment discontinuation at 5, 20, 32 and 56 weeks after treatment initiation.
3. RESULTS
3.1. Data and demographics
The baseline summary characteristics of the participants included in the analysis are presented in Table 1. The study population consisted of 4952 participants aged between 18 and 82 years, of whom 3630 were women and 1322 were men,. The mean baseline weight was 105.5 kg and ranged between 60 kg and 244 kg. The mean baseline HbA1c was 2.7 mmol/mol and ranged between 2.5 mmol/mol and 3.1 mmol/mol. The majority of the participants were white (n = 4260), with a large group of black or African‐American (n = 447) and a minority of Asian participants (n = 150). The majority of the observations were recorded in Europe (n = 2117) and North America (n = 2195).
Table 1.
Demographics and summary of baseline characteristics for subjects included in the analysis
| Characteristics | Trial 1 (n = 3662) | Trial 2 (n = 824) | Trial 3 (n = 466) | Combined trials (n = 4952) | ||||
|---|---|---|---|---|---|---|---|---|
| Liraglutide dose | ||||||||
| 0 mg | 1225 | 209 | 98 | 1532 | ||||
| 1.2 mg | ‐ | ‐ | 94 | 94 | ||||
| 1.8 mg | ‐ | 203 | 90 | 293 | ||||
| 2.4 mg | ‐ | ‐ | 92 | 92 | ||||
| 3.0 mg | 2437 | 412 | 92 | 2941 | ||||
| Gender | ||||||||
| Female | 2869 | 408 | 353 | 3630 | ||||
| Male | 793 | 416 | 113 | 1322 | ||||
| Trial region | ||||||||
| Europe | 1339 | 312 | 466 | 2117 | ||||
| North America | 1786 | 409 | 0 | 2195 | ||||
| South America | 233 | 0 | 0 | 233 | ||||
| Asia | 210 | 49 | 0 | 259 | ||||
| Africa | 30 | 54 | 0 | 84 | ||||
| Oceania | 64 | 0 | 0 | 64 | ||||
| Race | ||||||||
| White | 3114 | 687 | 459 | 4260 | ||||
| Black or African American | 348 | 94 | 5 | 447 | ||||
| Asian | 131 | 19 | 0 | 150 | ||||
| American Indian or Alaska native | 8 | 4 | 0 | 12 | ||||
| Native Hawaiian or other Pacific Islander | 4 | 0 | 0 | 4 | ||||
| Other | 57 | 17 | 2 | 76 | ||||
| Mean (SD) | Range | Mean (SD) | Range | Mean (SD) | Range | Mean (SD) | Range | |
|---|---|---|---|---|---|---|---|---|
| Age, years | ||||||||
| Average liraglutide concentration, nM | 38.6 (10) | 13.7–101.7 | 26.5 (9.4) | 9.4–72.5 | 27.1 (11.6) | 7.2–67.9 | 35.2 (11.4) | 7.2–101.7 |
| Baseline body weight, kg | 106.3 (21.4) | 63–244 | 106 (21.6) | 60.1–193.3 | 97.5 (13) | 69.2–141.2 | 105.5 (20.9) | 60.1–244 |
| Baseline BMI, kg/m2 | 38.3 (6.4) | 27–77.2 | 37.1 (6.8) | 27–67.6 | 34.4 (2.8) | 29.1–41 | 37.8 (6.3) | 27–77.2 |
| Baseline HbA1c, mmol/mol | 2.7 (0.03) | 2.5–2.9 | 2.9 (0.07) | 2.7–3.1 | 2.7 (0.03) | 2.6–2.8 | 2.7 (0.09) | 2.5–3.1 |
Abbreviations: BMI, body mass index; HbA1c, glycated haemoglobin; n, number of individuals.
3.2. Pharmacodynamic model
The observed and model‐predicted mean weight changes relative to baseline for the three different trials and treatment groups are presented in Figure 1. As seen from the model predictions, the final population PK/PD model provided an adequate description of the weight loss trajectories of the placebo and liraglutide treatment groups. Figure 1 also presents the good fit of the model predicted mean weight change for participants who discontinued Trials I and II prematurely (ie, week 56, in‐trial). Additionally, the model‐predicted weight regain trajectories were in good agreement with and showed little deviation from the observed data after treatment cessation (data after week 56 were not used in model development). Finally, diagnostic plots and the visual predictive check showed no evidence of systematic bias (Supporting Information, Figures S1 and S2). The structural parameter estimates of the population PK/PD model are presented in Supporting Information, Table S2.
Figure 1.
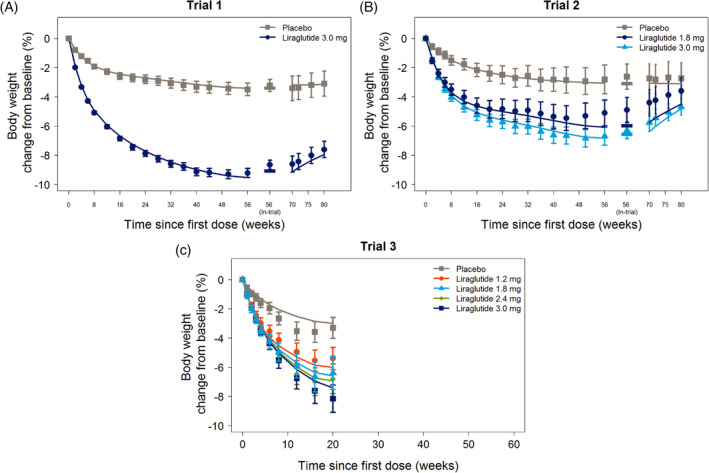
Observed mean weight relative to baseline for Trial 1 (A), Trial 2 (B) and Trial 3 (C) versus time since first dose. The main trial phase for Trials 1 and 2 was up to week 56. Participants that discontinued the trial prematurely were asked to return to trial sites at week 56, and their weight was recorded (in‐trial). After the main phase, participants were discontinued from liraglutide treatment and followed up for 12 weeks. Response data are presented as mean change from baseline body weight as observed, with 95% confidence intervals. Lines represent the mean model population predictions. Data up to week 56 were included in the model development
The bi‐phasic PK/PD model that was used to describe the weight change–time profiles led to a significant improvement in both the log‐likelihood (ΔOFV = ‐6710, +3 parameters) and the goodness‐of‐fit plots as compared to a classic indirect response model.27 Figure 2 shows the early and sustained weight change phases, as well as the net weight loss effects for the placebo group and following liraglutide 3.0 mg therapy. Treatment differences could be identified for both the transient and the sustained weight loss phases. Liraglutide increased the sustained weight change from baseline in a concentration‐dependent manner via a saturable concentration–effect relationship. The estimated liraglutide EC50 was 22.5 nmol/L (95% confidence interval 17.5–28.2), which is in good agreement with previous exposure–response analyses.15 The liraglutide concentration–response relationship to change from baseline per week of treatment is shown in Figure S3.
Figure 2.
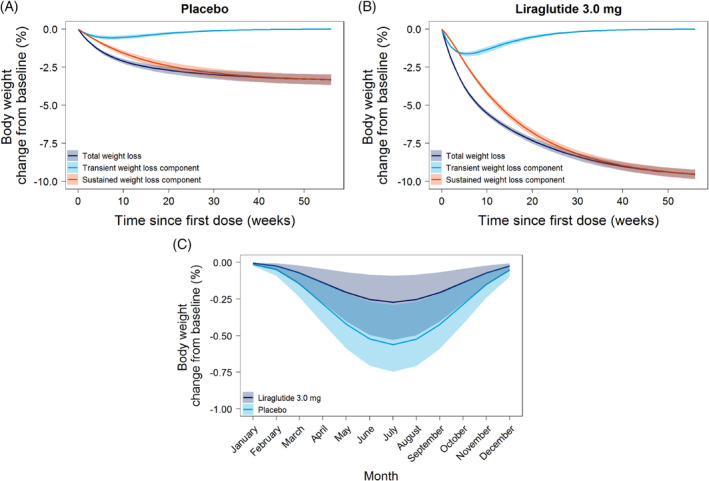
Model predicted transient (fast), sustained (slow) and net (total) weight changes for the placebo (A) and liraglutide 3.0 mg (B) group for participants with normoglycaemia. Treatment differences could be identified for both the transient and the sustained weight loss phases. The simulated population was based on the gender and trial region ratios, as observed in Trial 1. The simulations were performed without the yearly variations sub‐model. (C) Model‐predicted yearly fluctuation for body weight change from baseline for the placebo group (light blue) and for liraglutide 3.0 mg‐treated subjects with normoglycaemia (dark blue) according to the pharmacokinetic/pharmacodynamic model. The solid lines show the cosine curve with a period of 365 days that best described the underlying yearly fluctuation trend, normalized to the beginning of the year. 95% confidence intervals (shaded areas) were constructed from 2000 parameter vectors sampled from the multivariate normal distribution based on the estimated covariance matrix
3.3. Effect of covariates on weight change
The stepwise covariate analysis showed that sex, diabetes status, age and trial region were the main covariates affecting the weight change time course. Diabetes status primarily affected the transient and sustained maximum placebo effects, as well as the sustained body weight loss rate constant for the liraglutide treatment groups and maximal sustained liraglutide effect, with participants with type 2 diabetes achieving lower weight loss effects as compared to those with or without prediabetes for both the placebo and liraglutide treatment groups. Sex was found to affect the transient body weight loss rate constant for the liraglutide treatment groups and maximal sustained liraglutide effect, as well as the amplitude of seasonal weight changes. Age affected the maximum sustained placebo effect via an inverse relationship. Finally, trial region was found to affect the maximum sustained placebo effect and the sustained body weight loss rate constant, with participants from North America, South America and Asia achieving 78%, 105% and 120% maximum sustained placebo effects, respectively, as compared to participants from Europe. The magnitude and direction of the included covariate effects are presented in Figures S4 and S5.
3.4. Seasonal variation effect
The presence of a seasonal rhythm was evident when relating the monthly deviation estimates to the time of the year that the observation was recorded (Figure S6). The graphical exploration indicated that a cosine function would be appropriate for describing the underlying structure. Inclusion of a cosine function led to a significant change in the objective function value (P <0.0001) and a decrease in the IIV for Pmax, slow and PRbnd. Exploration of differences in the magnitude of the seasonal variation effect across different groups showed that the amplitude for participants with normoglycaemia treated with liraglutide 3.0 mg was 44.5% lower than for the control group (Figure 2C).
3.5. Simulations
The final model was used to simulate the long‐term weight loss following liraglutide treatment (assuming compliance equal to the observed data in the three randomized control trials) using different escalation algorithms (Figure 3A). One‐, 2‐ and 3‐week escalation algorithms reaching the target dose of 3.0 mg within 4, 8 and 12 weeks were simulated, and the expected time to 5% weight change from baseline was 8.4, 9.6 and 10.9 weeks, respectively. Loss of effect for the more conservative as compared to the typical escalation algorithm was <1% at all time points as compared to the typical escalation (0.4% and 0.7% for the 2‐ and 3‐week escalation algorithms, respectively). Finally, simulations of weight regain were performed after treatment discontinuation after 5, 20, 32 and 56 weeks of treatment initiation. The expected duration of treatment benefit, defined as separation by >1% weight change as compared to placebo following treatment discontinuation was 10, 18, 27 and 29 weeks for the 5, 24, 36 and 56 weeks of treatment, respectively.
Figure 3.
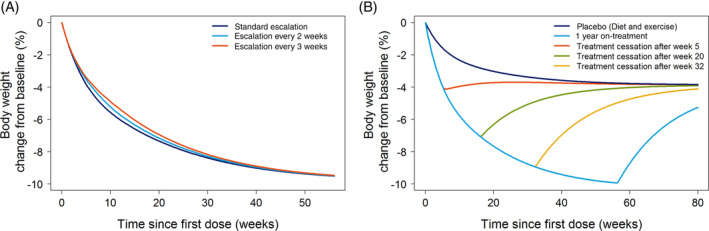
Model simulations of the (A) weight loss trajectories for three different treatment initiation dose‐escalation algorithms and (B) weight regain trajectories following liraglutide treatment cessation 5 (orange line), 20 (green line), 32 (yellow line) and 56 (light blue) weeks after treatment initiation
4. DISCUSSION
We developed a population PK/PD model incorporating data from three clinical trials to quantify the effect of liraglutide on weight change following 1‐year treatment in overweight or obese patients. Our novel model captured the early and long‐term phases of weight change through a bi‐phasic model structure and allowed us to identify liraglutide treatment effect on both phases. Additionally, we were able to quantify an underlying rhythm of weight change attributable to the time of the year, which is likely to occur because of the natural seasonal rhythms of increased activity and reduced caloric intake during the summer season.32 Finally, simulations with our model and different treatment initiation escalation algorithms revealed that, despite some small differences in the early phases of weight change, similar long‐term weight loss effects could be expected for all algorithms.
Our model was able to accurately describe the longitudinal changes in body weight after either diet and exercise alone or as an adjunct to liraglutide therapy. The model's bi‐phasic structure was designed to capture (1) the rapid changes in body weight during the first few weeks of reduced caloric intake, potentially attributed to changes in body water stores and (2) the comparatively slower long‐term body weight changes attributable to changes in lean and fat mass.6 The bi‐phasic model described the data significantly better than a simple exponential decay model and is in agreement with previous attempts to describe and quantify weight changes after weight management interventions.6 Interestingly, it allowed us to identify liraglutide effects on both phases, potentially attributed to a higher rate of weight loss due to body water decrease when on liraglutide treatment and a long‐term sustained weight reduction due to the anorectic effects of liraglutide. Our model slightly overpredicted the effects for the 1.8 mg dose in Trial 2 after week 48. The mechanism behind this deviation between the model and data (after week 48) is unclear and speculative, and thus was not accounted for.
After treatment cessation at week 56, some weight regain was observed in the liraglutide groups. As we did not include the follow‐up data in the model development, we were able, as a form of external validation, to explore whether our model could predict the weight regain trajectories. The external validation confirmed that the model was able to predict accurately the weight regained due to treatment discontinuation for the 3.0 mg dose. The observed regain for the 1.8 mg dose in Trial 2 was somewhat faster than the model predicted, probably due to model misfit after week 48. Liraglutide has a relatively short half‐life, meaning that most of its systemic concentrations are expected to be cleared within 2 days of treatment cessation.13 Thus, the weight regain trajectories will be driven by the maximum effect and rate constants of the placebo model alone. Because our model captured the placebo data accurately, it is likely to lead to accurate predictions of the durability and rate of weight regain following treatment cessation. Simulations of treatment discontinuation after 5, 20, 32 and 56 weeks of treatment suggest that a treatment benefit after discontinuation is longer for participants who have used liraglutide for a longer time, and can be expected for up to 29 weeks before the weight reaches within 1% of the weight change that is expected for participants after diet and exercise.
During model development, we were able to identify a small seasonal variation in weight change. The magnitude of this yearly variation was consistent with previous findings in an overweight population, and interestingly, it was found to be smaller in the liraglutide‐treated groups than the placebo group.32 These differences could potentially be attributed to the sustained effect of liraglutide on food intake or food preference across the treatment period.33 Despite the clear seasonal effects in Trials 1 and 2, these could not be detected in Trial 3, potentially because of its shorter duration, the smaller number of enrolled participants and the very limited or no data for the months of July to December. Additionally, we could not capture potential alignment differences for the northern and southern hemispheres, potentially because of the much smaller dataset for the southern hemisphere, as compared to the northern one, that did not include robust information about all months of the year (the majority of participants were randomized in Europe and North America [n = 4312] as compared to southern hemisphere countries [Australia, n = 64; Brazil, n = 143; Mexico, n = 90; South Africa, n = 84]). The small magnitude of the seasonal effects suggests that they should not necessarily be taken into account during the design and interpretation of longitudinal studies. However, the fact that it was possible to detect these effects in a randomized clinical trial setting suggests that it may be relevant to consider them across any time course evaluation of weight management interventions.
According to the liraglutide prescribing information, the recommended dosage for weight management is 3.0 mg daily.18, 19, 20, 21 To reduce the likelihood of GI symptoms, a dose‐escalation algorithm is proposed to be used during the treatment initiation phase, with 0.6 mg as the starting dose and a weekly increment of 0.6 mg up to the target 3.0 mg dose. If patients are unable to tolerate an increased dose during dose escalation, it should be considered to delay dose escalation by ~1 additional week. Previous exposure–response modelling analyses suggest that liraglutide‐induced nausea can be mitigated by slower dose escalation.34 Simulations based on our model were performed to assess the influence on weight change when more conservative (ie, 2‐ and 3‐week escalation step intervals) than the prescribing information recommended (ie, 1‐week interval) algorithms are used. Despite some small differences in the early weight loss phases, the 1‐year weight loss profile was found to be similar across all different escalation algorithms. These results are potentially important for the initiation of liraglutide treatment in GLP‐1‐naïve patients, who appear more sensitive to GI side effects (nausea and vomiting) during the escalation period. Because liraglutide therapy is known to lead to GI side effects early in the treatment initiation phase, which are transient over time35, 36, such delayed escalation algorithms could bear the potential of lower side effect incidence rates with similar long‐term weight loss effects to those of the standard escalation algorithm. Additionally, the slower dose‐escalation algorithms are expected to lead to similar HbA1c control to the standard algorithm because the effect of liraglutide on HbA1c reaches a plateau for doses >1.8 mg,25 which, even with the slowest dose‐escalation algorithm (i.e. escalation every 3 weeks), is reached within 4 weeks from the start of treatment.
In conclusion, we developed the first population PK/PD model to link liraglutide systemic concentrations to longitudinal trajectories of weight loss in overweight or obese patients. The modelling approach allowed us to identify both a transient and a more sustained weight loss component and, additionally, a subtle signal of seasonal weight changes. Finally, model simulations suggested that slower escalation algorithms, as described in the prescribing information for liraglutide 3.0 mg for weight loss, can be applied with only a modest impact on the expected weight loss outcome.18, 19, 20, 21 These results are potentially valuable for patients who experience worse GI side effects and would thus benefit from a slower dose escalation. Additionally, we demonstrate weight benefits of liraglutide 3.0 mg beyond cessation of treatment, and that these effects continue for a longer time for patients with a longer liraglutide 3.0 mg treatment duration.
CONFLICTS OF INTERESTS
A.S, H.A and R. V. O. are employed by and hold stock in Novo Nordisk A/S.
AUTHOR CONTRIBUTIONS
T.P, A.S, H.A, T.M.L and R.V.O contributed to the conceptual design. T.P. performed the modelling analysis and wrote the first draft. All authors contributed to the interpretation of the data. All authors were involved in the writing, reviewing and editing of the manuscript, gave final approval and agreed to be accountable for all aspects of the work.
Supporting information
Appendix S1: Supporting information
ACKNOWLEDGMENTS
This work was supported by the Novo Nordisk STAR Fellowship Programme and the Innovation Fund Denmark.
Papathanasiou T, Strathe A, Agersø H, Lund TM, Overgaard RV. Impact of dose‐escalation schemes and drug discontinuation on weight loss outcomes with liraglutide 3.0 mg: A model‐based approach. Diabetes Obes Metab. 2020;22:969–977. 10.1111/dom.13985
Peer Review The peer review history for this article is available at https://publons.com/publon/10.1111/dom.13985.
Funding information Innovation Fund Denmark; Novo Nordisk A/S
REFERENCES
- 1. James WP. WHO recognition of the global obesity epidemic. Int J Obes (Lond). 2008;32(Suppl 7):S120‐S126. [DOI] [PubMed] [Google Scholar]
- 2. Hruby A, Hu FB. The Epidemiology of Obesity: A Big Picture. Pharmacoeconomics. 2015;33(7):673‐689. [DOI] [PMC free article] [PubMed] [Google Scholar]
- 3. Kelly T, Yang W, Chen CS, Reynolds K, He J. Global burden of obesity in 2005 and projections to 2030. Int J Obes (Lond). 2008;32(9):1431‐1437. [DOI] [PubMed] [Google Scholar]
- 4. Hall KD, Kahan S. Maintenance of Lost Weight and Long‐Term Management of Obesity. Med Clin North Am. 2018;102(1):183‐197. [DOI] [PMC free article] [PubMed] [Google Scholar]
- 5. Swinburn BA, Sacks G, Hall KD, et al. The global obesity pandemic: shaped by global drivers and local environments. Lancet. 2011;378(9793):804‐814. [DOI] [PubMed] [Google Scholar]
- 6. Hall KD, Sacks G, Chandramohan D, et al. Quantification of the effect of energy imbalance on bodyweight. Lancet. 2011;378(9793):826‐837. [DOI] [PMC free article] [PubMed] [Google Scholar]
- 7. Turton MD, O'Shea D, Gunn I, et al. A role for glucagon‐like peptide‐1 in the central regulation of feeding. Nature. 1996;379(6560):69‐72. [DOI] [PubMed] [Google Scholar]
- 8. Field BCT, Wren AM, Cooke D, Bloom SR. Gut hormones as potential new targets for appetite regulation and the treatment of obesity. Drugs. 2008;68(2):147‐163. [DOI] [PubMed] [Google Scholar]
- 9. Suzuki K, Simpson KA, Minnion JS, Shillito JC, Bloom SR. The role of gut hormones and the hypothalamus in appetite regulation. Endocr J. 2010;57(5):359‐372. [DOI] [PubMed] [Google Scholar]
- 10. Steinert RE, Feinle‐Bisset C, Asarian L, et al. GLP‐1, and PYY(3‐36): Secretory Controls and Physiological Roles in Eating and Glycemia in Health, Obesity, and After RYGB. Physiol Rev. 2017;97(1):411‐463. [DOI] [PMC free article] [PubMed] [Google Scholar]
- 11. Holst JJ. The physiology of glucagon‐like peptide 1. Physiol Rev. 2007;87(4):1409‐1439. [DOI] [PubMed] [Google Scholar]
- 12. Drucker DJ, Nauck MA. The incretin system: glucagon‐like peptide‐1 receptor agonists and dipeptidyl peptidase‐4 inhibitors in type 2 diabetes. Lancet. 2006;368(9548):1696‐1705. [DOI] [PubMed] [Google Scholar]
- 13. Knudsen LB, Nielsen PF, Huusfeldt PO, et al. Potent derivatives of glucagon‐like peptide‐1 with pharmacokinetic properties suitable for once daily administration. J Med Chem. 2000;43(9):1664‐1669. [DOI] [PubMed] [Google Scholar]
- 14. Nauck MA, Kleine N, Orskov C, Holst JJ, Willms B, Creutzfeldt W. Normalization of fasting hyperglycaemia by exogenous glucagon‐like peptide 1 (7‐36 amide) in type 2 (non‐insulin‐dependent) diabetic patients. Diabetologia. 1993;36(8):741‐744. [DOI] [PubMed] [Google Scholar]
- 15. Wilding JP, Overgaard RV, Jacobsen LV, Jensen CB, le Roux CW. Exposure‐response analyses of liraglutide 3.0 mg for weight management. Diabetes Obes Metab. 2016;18(5):491‐499. [DOI] [PMC free article] [PubMed] [Google Scholar]
- 16. Mould DR, Upton RN. Basic concepts in population modeling, simulation, and model‐based drug development. CPT Pharmacometrics Syst Pharmacol. 2012;1:e6. [DOI] [PMC free article] [PubMed] [Google Scholar]
- 17. Blonde L, Russell‐Jones D. The safety and efficacy of liraglutide with or without oral antidiabetic drug therapy in type 2 diabetes: an overview of the LEAD 1‐5 studies. Diabetes Obes Metab. 2009;11(Suppl 3):26‐34. [DOI] [PubMed] [Google Scholar]
- 18.US label information for Saxenda, current version or updates. http://www.accessdata.fda.gov/drugsatfda_docs/label/2014/206321Orig1s000lbl.pdf). Accessed December 8, 2019.
- 19.Saxenda® (liraglutide) summary product information. European Medicines Agency. 2015; https://ec.europa.eu/health/documents/community-register/2015/20150323131125/anx_131125_en.pdf. Accessed December 8, 2019.
- 20.Saxenda® (liraglutide) summary product information. Novo Nordisk Canada Inc., 2017.
- 21.Saxenda® (liraglutide) summary product information. Australian Government Therapeutic Goods Administration. 2019; https://www.tga.gov.au/sites/default/files/auspar-liraglutide-190429-pi.pdf. Accessed December 8, 2019.
- 22. Pi‐Sunyer X, Astrup A, Fujioka K, et al. A randomized, controlled trial of 3.0 mg of liraglutide in weight management. N Engl J Med. 2015;373(1):11‐22. [DOI] [PubMed] [Google Scholar]
- 23. Davies MJ, Bergenstal R, Bode B, et al. Efficacy of Liraglutide for Weight Loss Among Patients With Type 2 Diabetes: The SCALE Diabetes Randomized Clinical Trial. JAMA. 2015;314(7):687‐699. [DOI] [PubMed] [Google Scholar]
- 24. Astrup A, Rossner S, Van Gaal L, et al. Effects of liraglutide in the treatment of obesity: a randomised, double‐blind, placebo‐controlled study. Lancet. 2009;374(9701):1606‐1616. [DOI] [PubMed] [Google Scholar]
- 25. Overgaard RV, Petri KC, Jacobsen LV, Jensen CB. Liraglutide 3.0 mg for Weight Management: A Population Pharmacokinetic Analysis. Clin Pharmacokinet. 2016;55(11):1413–1422. [DOI] [PMC free article] [PubMed] [Google Scholar]
- 26. Overgaard RV, Lindberg S, Thielke D. Impact on HbA1c and body weight of switching from other GLP‐1 receptor agonists to semaglutide: A model‐based approach. Diabetes Obes Metab. 2019;21(1):43‐51. [DOI] [PMC free article] [PubMed] [Google Scholar]
- 27. Jusko WJ, Ko HC. Physiologic indirect response models characterize diverse types of pharmacodynamic effects. Clin Pharmacol Ther. 1994;56(4):406‐419. [DOI] [PubMed] [Google Scholar]
- 28. Beal S, Sheiner L, Boeckmann A, Bauer R. NONMEM user's guides. (1989–2009). Icon Dev. Solut: Ellicott City; 2009. [Google Scholar]
- 29. Keizer RJ, Karlsson MO, Hooker A. Modeling and Simulation Workbench for NONMEM: Tutorial on Pirana, PsN, and Xpose. CPT Pharmacometrics Syst Pharmacol. 2013;2:e50. [DOI] [PMC free article] [PubMed] [Google Scholar]
- 30. R Core Team . R: A language and environment for statistical computing. R Foundation for Statistical Computing, Vienna, Austria: 2019; https://www.R-project.org/. Accessed December 8, 2019. [Google Scholar]
- 31. Dosne AG, Bergstrand M, Harling K, Karlsson MO. Improving the estimation of parameter uncertainty distributions in nonlinear mixed effects models using sampling importance resampling. J Pharmacokinet Pharmacodyn. 2016;43(6):583‐596. [DOI] [PMC free article] [PubMed] [Google Scholar]
- 32. Ma Y, Olendzki BC, Li W, et al. Seasonal variation in food intake, physical activity, and body weight in a predominantly overweight population. Eur J Clin Nutr. 2006;60(4):519‐528. [DOI] [PMC free article] [PubMed] [Google Scholar]
- 33. Hayes MR, Schmidt HD. GLP‐1 influences food and drug reward. Curr Opin Behav Sci. 2016;9:66‐70. [DOI] [PMC free article] [PubMed] [Google Scholar]
- 34. Overgaard RV, Lund M, Strathe A. Liraglutide‐induced Nausea Can Be Managed by Slower Dose‐escalation. Obesity Week 2017; 2017; Washington, DC: https://2017.obesityweek.com/abstract/liraglutide-induced-nausea-can-be-managed-by-slower-dose-escalation/. Accessed December 8, 2019. [Google Scholar]
- 35. Buse JB, Rosenstock J, Sesti G, et al. Liraglutide once a day versus exenatide twice a day for type 2 diabetes: a 26‐week randomised, parallel‐group, multinational, open‐label trial (LEAD‐6). Lancet. 2009;374(9683):39‐47. [DOI] [PubMed] [Google Scholar]
- 36. Lean ME, Carraro R, Finer N, et al. Tolerability of nausea and vomiting and associations with weight loss in a randomized trial of liraglutide in obese, non‐diabetic adults. Int J Obes (Lond). 2014;38(5):689‐697. [DOI] [PMC free article] [PubMed] [Google Scholar]
Associated Data
This section collects any data citations, data availability statements, or supplementary materials included in this article.
Supplementary Materials
Appendix S1: Supporting information