

Abstract
Pseudo‐isocyanine chloride (PIC) is a cationic dyestuff that exhibits self‐assembly in aqueous solution, promoted either by increasing the PIC concentration or by decreasing the temperature. PIC‐aggregates exhibit a characteristic and sharp absorption band as well as a fluorescence band at a wavelength of 573 nm making PIC an interesting candidate to analyze the self‐assembly process in various environments. The present work developed PIC‐based, synthetic model systems, suitable to investigate how macromolecular crowding influences self‐assembly processes. Four synthetic additives were used as potential crowders: Triethylene glycol (TEG), polyethylene glycol (PEG), Ficoll 400 as a highly branched polysaccharide, and sucrose corresponding to the monomeric unit of Ficoll. Combined UV/Vis spectroscopy and time‐resolved light scattering revealed a strong impact of crowding based on excluded volume effects only for Ficoll 400. Sucrose had hardly any influence on the self‐assembly of PIC and PEG and TEG impeded the PIC self‐assembly. Development of such a PIC based model system led over to in‐cell experiments. HeLa cells were infiltrated with PIC solutions well below the aggregation threshold in the infiltrating solution. In the cellular environment, PIC was exposed to a significant crowding and immediately started to aggregate. As was demonstrated by fluorescence imaging, the extent of aggregation can be modulated by exposing the cells to salt‐induced osmotic stress. The results suggest future use of such a system as a sensor for the analysis of in vitro and in vivo crowding effects on self‐assembly processes.
Keywords: crowding, in cell, J-aggregates, pseudo-isocyanine chloride, self-assembly
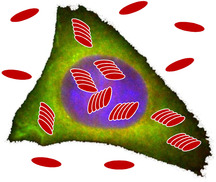
Stand out from the crowd! The cationic dyestuff PIC reversibly self‐assembles in aqueous solution. A comparative investigation of such PIC self‐assembly in the presence of synthetic polymers with PIC self‐assembly in living Hela cells suggests PIC as a promising candidate for a sensor to examine the impact of varying cellular conditions like macromolecular crowding on self‐assembly processes of proteins in cells (see figure).
Introduction
Proteins are organic molecules with a variable and often only marginal solubility in water. The marginal water solubility may cause a pronounced tendency to self‐assemble toward large filaments often performing distinct tasks in living systems, like the assembly of the cytoskeleton proteins.1 However, protein self‐assembly may also interfere with the proper functioning of living systems like the amyloid formation of (partly) misfolded proteins, which causes amyloidogenic diseases like Alzheimer's dementia.2, 3
Although analysis of self‐assembly processes has become a mature topic in biophysics and biochemistry, the majority of studies in that field were carried out in vitro, under test tube conditions, with purified proteins. Fluorescence dyes, such as Thioflavin T, are commonly used in such studies that show an increase in fluorescence upon binding to amyloid. Kinetic experiments at variable concentration allow to model the aggregation mechanism.4 Yet, most of those studies discard the fact that the respective processes in living systems usually propagate under crowding conditions.5 The cytosol of living cells has a solid content of 30 %–40 % by weight, with proteins establishing more than 50 % thereof.1, 5
Based on excluded volume considerations,6, 7, 8, 9 Minton et al.10, 11, 12 calculated activity coefficients of the monomers at variable contents of cosolutes, herein also denoted as crowders, and predicted a shift of the equilibrium toward assemblies with increasing concentration of crowder if the space occupied by monomeric units is smaller in the aggregate state than in the monomeric state. Assembly and disassembly on the other hand are slowed down the more space is required by the transition states. Experimental work supports the general relevance of excluded volume effects on the self‐assembly of proteins. Polyethylene glycole (PEG) promotes dimer formation of pyruvate dehydrogenase,13, 14 in line with predictions based on excluded volume effects,14, 15 but has no effect on the self‐assembly of myoglobin.16 Similar promotion of oligomerization was observed with fibrinogen in the presence of bovine serum albumin (BSA) as crowder and tubulin in the presence of dextran as crowder.17 Like the formation of oligomers, self‐assembly is usually fostered by synthetic as well as natural crowding agents. Dextran enhances amyloid formation of human apolipoprotein C‐II.18 Dextran also promotes formation of actin filaments.19 In another study, albumin and hemoglobin turned out to act as crowder proteins enhancing the GTP‐induced self‐assembly of the bacterial cell division protein FtsZ.20 Use of PEG even led to the formation of bundles of actin filaments mediated by a depletion interaction among the filaments21 as does Ficoll 70 and dextran with the GTP‐induced self‐assembly of FtsZ.22 In all these cases acceleration of the self‐assembly can be related to the excluded volume effect of crowders. In the light of the rich patterns of interactions exerted on each other by the large variety of cosolutes, this may come as a surprise. In fact, the impact of cosolutes in general is more complex23 and further studies showed that the effect of different crowding agents may not be additive24 and the presence of other cosolutes acting as osmolytes or chaperones may have a significant effect on crowding of synthetic and natural macromolecules.25 Noteworthy, some species used as crowders do not accelerate but suppress the self‐assembly of certain proteins.25
As is indicated by this selection of experimental work, it is still difficult to identify systematic trends. This can at least in part be attributed to the large variety of proteins showing self‐assembly and to the broad range of cosolutes including species as diverse as polymeric chains, compact proteins and smaller molecules of variable size and chemical nature. In order to make one step forward in classification of crowders, a few representative proteins like human islet amyloid polypeptide (IAPP),25 MET16,26 and Ab27 may be selected to be exposed systematically to different crowding agents. It is at this point where we would like to stress an analogy between proteins and synthetic dyestuffs as this analogy serves as an alternative starting point.28 Dyestuffs like proteins are organic molecules with usually a marginal solubility in water. A marginal solubility is an important prerequisite enabling proteins and dyes to carry out tasks in nature1 and in technical applications29 respectively. Both classes of organic molecules have hydrophobic spots, dipoles, ionic groups and, residues capable of forming H‐bonds. Above all, distinct patterns of such residues induce orientated attachment among monomers during self‐assembly thereby leading to fibers with long range order in at least one direction. Given these similarities, we suggest to select an appropriate dyestuff molecule exhibiting self‐assembly for an analysis of its sensitivity to crowding in solution and thus to address this important aspect of biological systems.
One promising candidate for such a study is pseudo‐isocyanine chloride (PIC). PIC was presented almost simultaneously by Jelley30, 31 and Scheibe et al.32, 33 as a cationic dyestuff, which shows a sharp absorption band at the long wavelength of 573 nm, once the dyestuff concentration drops beyond a certain temperature. That temperature threshold increases with increasing PIC concentration. Noteworthy, the appearance of the peak at 573 nm is accompanied by a gradual increase of the viscosity, which was correctly attributed to a self‐assembly of the dyestuff molecules34 with the resulting assemblies denoted as Scheibe‐ or J‐aggregates. Further studies revealed a sharp fluorescence band for J‐aggregates at 575 nm close to the J‐peak, while PIC monomers hardly show any fluorescence in this wavelength regime.34, 35 The extraordinary interaction of PIC with light pointed to potential applications as photographic sensitizer.36 A thermodynamic interpretation of concentration dependent UV/Vis measurements indicated that trimers at the least are necessary to generate the characteristic J‐peak37 and that the self‐assembly can be interpreted in terms of a chain reaction mechanism based on nucleation and growth.38 Additionally, dimers were identified as a third component by its own specific UV/Vis spectrum.39, 40 X‐ray diffraction41 in combination with electron microscopy42 revealed PIC filaments similar to those observed for protein aggregates43 and gave insight into the alignment of the monomers in those J‐aggregates. A detailed light‐scattering analysis yielded worm‐like aggregates with a persistence length of 500 nm and a final average length of the fiber of 600 nm.44 The exciton‐band responsible for the J‐peak turned out to be delocalized over segments limited to a maximum size of a 100 monomers, which makes the final aggregate size much larger than those segments.45 A suitable way to represent the appearance of the J‐aggregates is a phase diagram where the temperature of the onset of aggregation is plotted versus the respective PIC concentration.44 Accordingly, Figure 1 shows light scattering data from literature44 in pure water and in 0.01 m NaCl solution. Additionally, UV/Vis spectroscopy data in pure water from Daltrozzo et al.38 was evaluated as it is outlined in the Supporting Information (Figure S1).
Figure 1.
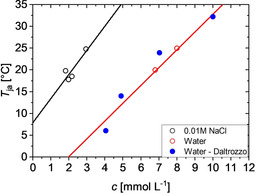
Temperature threshold for aggregation of PIC as a function of PIC concentration determined by means of static light scattering44 in pure water (red circles) and in 0.01 m NaCl solution (black circles) and by means of UV/Vis spectroscopy38 in pure water (blue solid spheres).
Inspired by these properties, we selected PIC as a protein substitute in order to study two interlinked topics. Reversible self‐assembly of PIC will enable us to investigate in vitro fundamental aspects of such self‐assembly with and without crowding agents. Once such purely synthetic model systems prove successful, PIC shall be transfected into cells and its self‐assembly be analyzed under in vivo conditions. For the in vitro investigation of fundamental aspects, the following additives are applied as crowding agents: Triethylene glycol (TEG), polyethylene glycol (PEG), Ficoll 400 as a highly branched polysaccharide and sucrose corresponding to the monomeric unit of Ficoll. Formation and disintegration of PIC assemblies is triggered via small temperature variations in the presence and absence of selected crowders. UV/Vis absorption reveals varying amounts of J‐aggregates by means of their absorption at 573 nm and time‐resolved (TR) light scattering provides the averaged particle mass, squared radius of gyration and hydrodynamic radius of the growing intermediates. Striking effects and differences are established among the different crowders by means of UV/Vis spectroscopy and TR‐light scattering to begin with. After a qualitative outline of the major effects, phase diagrams which represent the aggregation threshold temperature as a function of the PIC concentration are established systematically and separately for each of the crowders in comparison to the phase behavior in the absence of crowder. Our focus is then transferred to in vivo experiments. Self‐assembly of PIC is carried out in HeLa cells thus providing a realistic scenario for aggregation in living systems. To this end, the cells will be exposed to dilute PIC solutions with their PIC concentration well below the aggregation threshold. Variable conditions are applied in order to learn how such a system responds and whether the responses are suitable to turn in‐cell PIC into a sensor for variable crowding conditions.
Results and Discussion
In vitro experiments with synthetic systems
Effect of crowding on PIC aggregation
UV/Vis spectroscopy provides evidence for at least three different species, the monomers, H‐dimers and J‐aggregates. The prefixes H and J refer to the specific alignment of the monomers in the aggregate, with H denoting a parallel, congruent alignment of the molecular long axis and J indicating a co‐planar inclined alignment.46 Figure 2 compares UV/Vis spectra of PIC in pure water at a concentration of 6 mm, which is well below the threshold concentration of formation of J‐aggregates (Figure 1) and with spectra recorded in the presence of 25 % by weight of four crowding agents, TEG, PEG, sucrose and Ficoll 400.
Figure 2.
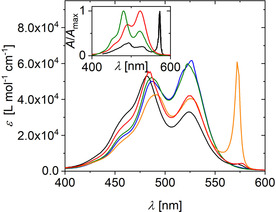
UV/Vis spectra of PIC in aqueous solution at a concentration of 6 mm without and with 25 % by weight of crowding agents. The color code indicates absence of crowder (black), TEG (green), PEG (blue), sucrose (red), Ficoll 400 (orange). The inset shows spectra as absorbance normalized to maximum absorbance for J‐aggregates (black), H‐dimers (green) and monomers (red). The spectrum of J‐aggregates in pure water stems from Neumann et al.47 The monomer spectrum was established in aqueous solution at [PIC]=3 μm and the H‐dimer spectrum was replotted from Horng et al.48 As is outlined in the Supporting Information, the addition of 0.01 m NaCl has no significant influence on the monomer spectrum (Figure S2).
Comparison of the spectrum of PIC in pure water and of PIC in solution containing 25 wt % sucrose provides evidence for an almost complete lack of J‐aggregates. Both spectra indicate a significant portion of H‐dimer, which is noticeable from the fact that the peak close to 485 nm is more intensive than the one appearing at 525 nm (inset of Figure 2). Small differences in the two spectra can be attributed to a slight shift in monomer/H‐dimer equilibrium in favor of monomers for the sample containing 25 wt % sucrose. The samples with 25 wt % PEG or TEG differ significantly from the one in pure water but are comparable with that of PIC in pure water at considerably lower concentrations (3 μm, see Figure 2 inset and Figure 3), where PIC is in its monomeric state. Hence, even dimerization or the formation of small oligomers is blocked with PEG or TEG. An entirely different effect is observed once Ficoll 400 is used as a crowding agent. As is outlined in Figure 2, a significant J‐peak appears for PIC at a concentration of 6 mm.
Figure 3.
UV/Vis spectra of PIC in aqueous solution at a concentration of 6 mm without crowding agent at variable temperature and with 25 % by weight of Ficoll 400 at T=25 °C (orange). The color code indicates the temperature in the absence of crowder: 10 °C (green), 15 °C (blue), 20 °C (red), and 25 °C (black). The black dashed curve represents a spectrum of PIC in aqueous solution at a concentration of 3 μm at 25 °C.
As already mentioned, self‐assembly of PIC is promoted by a decrease in temperature. This is illustrated in Figure 3 for PIC in pure water. Such a trend is a characteristic signature of growth processes proceeding via monomer addition with an exothermic reaction enthalpy and an entropy loss. Such features are for instance observed for many chain reactions in polymer chemistry where this threshold temperature is usually denoted as ceiling temperature.49 A significant J‐peak appears first at a temperature of 15 °C. This may again be compared with the state where 25 % by weight of Ficoll 400 is present as a crowder. Strikingly, the effect of adding Ficoll 400 to water is more pronounced than a temperature drop in pure water by 10 °C. Hence, Ficoll 400 strongly promotes formation of J‐aggregates.
The induction of PIC self‐assembly can be nicely visualized with a TR‐light scattering experiment during a gradual temperature decrease. In the presence of PEG, TEG, sucrose and in the absence of crowder as reference experiment T was gradually decreased from 25 °C to 10 °C and in the presence of Ficoll 400 the high threshold temperature made an extension of the temperature gradient to a starting value of 35 °C necessary. Figure 4 a represents the evolution of the weight averaged molar mass Mw as a function of time during the respective temperature gradients. In all cases, the PIC concentration was 6 mm and the content of crowder was fixed at 2 % by weight. In the absence of a crowding agent, the aggregation sets in at ≈15 °C. The modulations of this threshold by crowders are in agreement with expectations from UV/Vis experiments. Whereas PEG and TEG causes a shift of the threshold toward lower temperatures, sucrose had hardly any impact. Ficoll 400 unambiguously promotes aggregation of PIC as the onset temperature for self‐assembly is shifted to higher temperatures by 10 °C.
Figure 4.
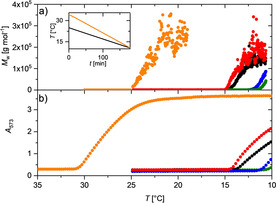
a) Evolution of aggregate mass of PIC in aqueous solution at a PIC concentration of 6 mm with time in the absence (black) and presence of 2 % by weight of crowding agents during a temperature gradient of 25 °C→10 °C for PEG (blue), TEG (green), Sucrose (red) and during a temperature gradient of 35 °C→10 °C for Ficoll 400 (orange). Temperature can be transformed to time according to the inset, which shows the temperature gradients applied for the experiments with PEG, TEG, sucrose and without crowding agent (black) and the experiment with Ficoll 400 (orange). b) Evolution of the absorbance A 573 recorded at a wavelength of 573 nm of a PIC solution with time at a PIC concentration of 6 mm in the absence (black) and presence of 2 % by weight of crowing agents during the same temperature gradient as applied in a). The color code indicates the type of crowding agent: Ficoll (orange), TEG (green), PEG (blue), and Sucrose (red).
Additional experiments outlined the Supporting Information (Figure S3 a) demonstrate, that the interference of PEG and TEG with the self‐assembly of PIC disappears at PEG and TEG contents of 1 %. At 25 % of PEG and TEG, on the other hand, aggregation of PIC is fully inhibited in the temperature regime investigated. An application of cyclic cooling/heating profiles (Figure S3 a and S3 b), demonstrates full reversibility of the self‐assembly processes.
Analogous trends can be recorded by means of UV/Vis spectroscopy. Based on the fact that the absorbance at a wavelength of 573 nm A 573 is a characteristic signature of J‐aggregates, the process of self‐assembly can be followed by time‐resolved recording of A 573 during a temperature gradient. Figure 4 b summarizes A 573 recorded at the same temperature gradients applied for the light scattering experiments with the PIC concentration fixed at 6 mm and the content of crowders fixed at 2 % by weight.
All trends show an initial part with a constantly low absorption indicating absence of J‐aggregates as long as the temperature is high enough. At a distinct temperature which is characteristic for the respective solvent conditions, the absorbance abruptly increases. As anticipated from the preceding paragraphs, the onset of absorption is shifted to lower temperatures in the presence of PEG and of TEG, with the onset temperature for TEG and PEG close to 10 °C corresponding to the lower limit of the applied gradient. The trend observed in the presence of sucrose is closest to that recorded in pure water, confirming the negligible effect of sucrose on the aggregation of PIC. Strikingly, the onset temperature observed in the presence of 2 % by weight of Ficoll 400 is shifted to the opposite direction by a fairly large temperature increment, again indicating that Ficoll 400 promotes the self‐assembly of PIC. Agreement of the threshold temperatures determined with the two methods is satisfactory with small discrepancies not exceeding 1 °C, except for the evaluation of the threshold value in the presence of 2 % Ficoll, where the uncertainty is slightly larger (details are outlined in Section S3 of the Supporting Information). UV/Vis measurements together with the light scattering experiments confirm that the aggregates shown in Figure 4 a are J‐aggregates, and the J‐aggregates observed in Figure 4 b within the uncertainty of the threshold temperature are large aggregates and not small oligomers.
Threshold temperature at variable PIC concentration and crowder content
The onset temperatures extracted from such diagrams are denoted as T ja and plotted in a separate graph as a function of the crowder content in Figure 5. Such a plot provides a comparative overview on the effect of crowding at a distinct PIC concentration. The horizontal line close to 15 °C indicates the threshold in the absence of any crowder serving as a reference. The strongest impact is exerted by Ficoll 400, which intensifies aggregation with increasing concentration of Ficoll 400. PEG and TEG show the opposite effect, with TEG acting as a stronger inhibitor of aggregation. Sucrose shows hardly any effect.
Figure 5.
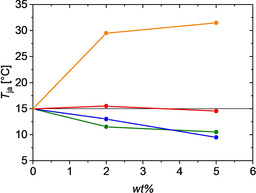
Temperature threshold for aggregation of PIC as a function of crowder content at a PIC concentration of 6 mm and in the absence of crowder. The color code indicates the absence of crowder (black horizontal line), Ficoll 400 (orange), TEG (green), PEG (blue), and sucrose (red).
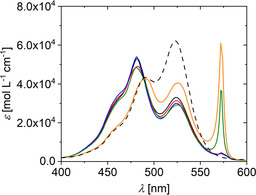
A straightforward extension of this series of experiments leads to a complementing overview, which characterizes the aggregation pattern as a phase diagram generated by a selected concentration of crowder. Now recordings of A 573 as a function of temperature have to be carried out at a variable PIC concentration at a given crowder concentration. Figure 6 presents the phase diagram for PEG, TEG, sucrose and Ficoll 400 at a crowder concentration of 2 % by weight in comparison to the respective trend observed in the absence of crowder. Furthermore, the phase diagram in Leibovitz solution is shown as a reference to the in‐cell measurements. A strong shift of the threshold line to lower PIC concentrations is observed, which can at least in part be explained by the physiological amount of sodium chloride of 138 mm in the Leibovitz solution. The presence of sodium chloride promotes aggregation, as it is shown in Figure 1 for 10 mm sodium chloride content.
Figure 6.
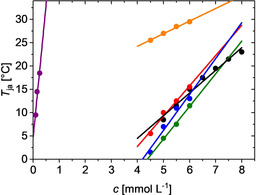
Temperature threshold for aggregation of PIC as a function of PIC concentration at various conditions: Analysis in pure water (black) serves as reference data, Leibovitz solution (purple) is applied as solvent for PIC for the experiments with HeLa cells, and the presence of 2 % by weight of PEG (blue), of TEG (green), of sucrose (red) and of Ficoll 400 (orange) illustrate the impact of various crowding agents.
Whereas the threshold temperatures T ja recorded for Ficoll 400 is shifted to lower PIC concentrations, PEG and TEG induces the opposite effect. As is shown in the Supporting Information, increasing the concentration of Ficoll 400 slightly shifts the respective threshold curve to lower PIC concentrations and at the same time slightly decreases its slope (Figure S4).
Among the additives applied as crowding agents in the present work, only Ficoll 400 shows an impact on the self‐assembly of PIC, which can be qualitatively reconciled with a crowding effect based on simple excluded volume considerations.10, 11, 12 Ficoll 400 is a branched and hence compact polymer, with sucrose the chemical monomer. Sucrose was therefore used a suitable additive to test for specific interactions between Ficoll and PIC. No significant impact on PIC aggregation could be identified, which excludes significant excess interactions between Ficoll and PIC compared to water and PIC. This supports the hypothesis that excluded volume effects establish the dominating feature exerted by Ficoll 400 on the self‐assembly of PIC.
Contrary to the effect of Ficoll 400, PEG and TEG reduce the tendency of PIC to aggregate. This has to be induced by specific interaction of the chemical residues of PEG or TEG with those in PIC. As suggested by Knowles et al.,50 aromatic C and cationic N indeed interact favorably with (‐CH2‐OH) and (‐CH2‐O‐CH2‐) residues compared to the respective interaction with water molecules. These favorable interactions with PEG and TEG likely occur with monomeric PIC and/or with growing ends of PIC filaments, thus nicely explaining the observed impact of PEG and TEG on the interaction of PIC. As a result, PIC is a self‐assembling system sensitive to macromolecular crowding based on excluded volume effects. Encouraged by this feature, we decided to transfer PIC into cells in order to study the response of PIC to the crowded environment of the cytosol and its variations. Such experiments are particularly promising as the fluorescence of PIC J‐aggregates observed at a wavelength of 573 nm may serve as a powerful tool to analyze self‐assembly of PIC in‐cell.
In vivo experiments with HeLa cells
Accordingly, we studied PIC aggregation in adherent living HeLa cells to explore how the crowding effect in cells modulates aggregation. Therefore, PIC was dissolved in Leibovitz imaging medium (c=50 μm) and added to the cells before imaging. Initially, no fluorescence was observed and no aggregation occurred in the Leibovitz medium. Surprisingly, we found that fluorescence occurred within a few minutes inside the cells (Figure 7 a–d), while the medium in the extracellular space remained non‐fluorescent. Confocal microscopy revealed that the fluorescence is mainly observed from bright cytoplasmic speckles and faint regions in the nucleus (Figure S5 a and S5 b). We independently confirmed the accumulation of PIC in the cell by measuring the change in concentration in the extracellular medium by UV/Vis spectroscopy (Figure S6; see Materials and Methods for further details). The result was that the concentration in the cell is 100 times higher than in the extracellular medium. The accumulation of aggregates inside the cells shows that the cell membrane is permeable for monomeric PIC. The dye aggregates within the cell whereas it does not aggregate at the same temperature in the extracellular space (Figure 6). We summarize these findings in the illustration in Figure 7 e.
Figure 7.
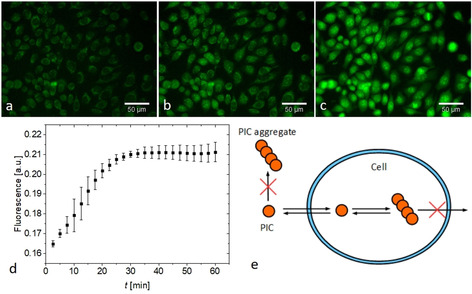
a–c) Exemplary fluorescence images of PIC aggregation in HeLa cells at 21 °C a) 2.5 min b) 10 min c) 40 min after addition of PIC. Scale bar 50 μm. d) Aggregation kinetics of PIC measured by the cell‐averaged fluorescence intensities. Three independent measurements were performed and data shown as mean±s.d. e) Model for PIC aggregation inside cells.
We then studied the temperature‐dependence of in‐cell aggregation. The mechanism of aggregation was similar at 12 °C, 21 °C and 37 °C, following the Scheme in Figure 7 e, with subtle variations in kinetics at different temperature and subcellular environments (Figure 8). As is outlined in Figure 6, Ficoll 400 shifts the threshold line to much lower PIC concentrations, thereby making aggregation of PIC at higher PIC concentrations insensitive to temperature. A similar effect may be caused by the cellular environment, which locates the states analyzed in Figure S7 deep into the aggregate regime. We also found PIC aggregation in the cells for 5 μm and 0.5 μm PIC solutions. For the 5 μm solution the aggregation kinetics were comparable to the 50 μm solution (Figure S8). In summary, we observed the aggregation of PIC in cells exposed to concentrations well below the aggregation threshold, suggesting that excluded volume effects dominate the in‐cell behaviors.
Figure 8.
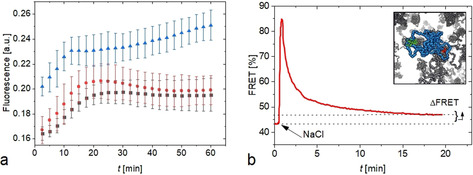
a) PIC aggregation kinetics in HeLa Cells at 0 mm (black squares), 100 mm (red spheres) and 500 mm (blue triangles) concentrations of sodium chloride in the extracellular medium. Three independent measurements were performed and data shown as mean±s.d. b) Crowding effect in HeLa Cells after osmotic upshift by 100 mm measured by a crowding sensor (inset; PEG shown in blue, FRET dyes in green and red and PEG crowding agents in gray). An increase in FRET corresponds to an increase in crowding. After the osmotic shock that leads to a peak in crowding, cells recover their original volume by regulatory volume increase, except of a residual difference (ΔFRET). The data is taken from reference53 and the graph modified for comparison.
PIC aggregation in cells under osmotic stress
To test if macromolecular crowding in the cell is a cause of aggregate formation we investigated how osmotic stress modulates PIC aggregation. Osmotic stress is an effective tool to modulate the cellular volume and crowding density.51, 52, 53, 54 We used NaCl for an osmotic upshift of the medium leading to a decrease in cell volume and an increase in crowding. The PIC solutions (50 μm) in water were supplemented with NaCl to a final concentration of 100 mm and 500 mm and added to the cell at t=0. Compared to the untreated cells, we found an increase in the overall fluorescence intensity as well as faster aggregation kinetics (Figure 8 a).
The strongest increase in fluorescence intensity was observed within the first minutes after the osmotic shock in particular for the 500 mm solution. This is in line with the corresponding strong increase in cellular crowding during this period.
It is known that this increase is caused by an immediate reduction of the cellular volume (due to the osmotic pressure) with invariant cellular biomass.55 As this leads to detrimental effects, such as protein aggregation,18, 56, 57 cells developed different responses to tightly regulate crowding (crowding homeostasis).58 As a short‐term response (within minutes) cells accumulate inorganic salts and a recovery of the cellular volume is observed, leading to the decline in crowding. This mechanism is known as the regulatory volume increase (RVI).59, 60 At longer timescale (up to several hours) the salts utilized for the RVI are replaced by osmolytes to reduce the ionic strength back to a basal level that may otherwise be detrimental to cells.61, 62
To directly relate PIC aggregation to the changes in crowding for our specific cellular system, we refer to our osmotic upshift experiments in HeLa Cells. In this study,53 cellular crowding was measured using a previously introduced crowding sensor (Figure 8 b, inset).54 The sensor consists of a 10 kDa polyethylene glycol polymer that was labelled at both ends by Atto488 and Atto565 dyes. In crowded conditions, the sensor adopts more compact conformations, which is measured by an increase in Förster resonance energy transfer. A strong increase in FRET is observed within the first minute after the osmotic shock experiments. This is caused by the cellular volume collapse and the increase in crowding. At longer timescales, the RVI reduces the crowding close to basal level. This is in line with the early modulation of PIC aggregation after the osmotic upshift. However, a significant increase in crowding beyond basal level is also observed beyond 12 min (indicated by the ΔFRET in Figure 8 b), which is compensated by the accumulation of osmolytes at longer timescales. The residual increase in crowding could explain the modulation of PIC aggregation at longer times in particular for the 500 μm solution. The osmotic shock experiments confirm that PIC aggregation in cells is particularly sensitive to excluded volume changes.
Conclusions and Outlook
Pseudo‐isocyanine chloride (PIC) is a water‐soluble cationic dyestuff, which reversibly forms fiber‐like aggregates. Aggregation is triggered once the temperature of the solution drops below a certain threshold value, which increases with increasing PIC concentration.38, 45 A characteristic signature of these fiber‐like aggregates is a narrow absorption band and a fluorescence band at a wavelength of 573 nm,34, 35 which offers a straightforward and easy to handle tool to track the appearance of aggregates as a function of changing environmental conditions.
In a first step, we dissolved PIC in aqueous solutions at variable crowding contents. Four synthetic additives were used as potential crowders: Triethylene glycol (TEG), polyethylene glycol (PEG), Ficoll 400 as a highly branched polysaccharide and sucrose corresponding to the monomeric unit of Ficoll. Combined UV/Vis spectroscopy and time‐resolved light scattering during temperature gradients showed that the formation of fiber‐like aggregates coincides with the appearance of the absorption at 573 nm, denoted as J‐peak. This enabled us to determine threshold temperatures at variable PIC‐concentrations, which can be correlated in terms of a phase diagram. Ficoll 400 is the only additive, for which a drastic promotion of self‐assembly is observed. Promotion of self‐assembly can unambiguously be attributed to macromolecular crowding dominated by an excluded volume effect. Sucrose, the monomeric unit of Ficoll does not affect the self‐assembly thus supporting the excluded volume nature of the crowding exerted by Ficoll. Unlike with Ficoll 400, PEG and TEG shifts the threshold temperature for the self‐assembly to lower temperature compared to the phase behavior of PIC in pure water, thereby decreasing the tendency of PIC to form aggregates. These results do not only suggest a use of such synthetic mixtures to scrutinize theoretical predictions on the impact of excluded volume effects on self‐assembly processes10, 11, 12 but give rise to an application of PIC in vivo in order to learn if and how PIC responds to changing environmental conditions in cells which lie at the origin of macromolecular crowding.
Accordingly, we exposed HeLa Cells with PIC solutions in Leibovitz medium with PIC concentrations in the range of 0.5 μm<[PIC]<50 μm being significantly smaller than the respective threshold value in the Leibovitz medium. During exposure of the cells to these PIC solutions, the cells were tracked via fluorescence imaging in order to follow the appearance of in‐cell aggregation of PIC with the fluorescence band at 573 nm. At PIC concentrations of 5 μm and 50 μm a significant fluorescence developed with time in the cells, clearly signaling PIC aggregation. Analysis of the overlaying Leibovitz medium revealed a loss of PIC via infiltration, indicating a PIC concentration in‐cell a 100 times higher than in the overlaying Leibovitz medium. Finally, osmotic stress experiments with excess NaCl salt in the infiltrating PIC medium were applied while analyzing the cells for fluorescence to signal aggregation of PIC. Addition of NaCl in fact further promotes aggregation of PIC in‐cell, which can unambiguously be attributed to a temporary compression of the cellular volume and along with this an amplification of crowding. It is these results, which indicate PIC as an extremely promising candidate as a sensor to examine varying cellular conditions with respect to their impact on self‐assembly processes of proteins in cells.
Experimental Section
Materials
1,1’‐Diethyl‐2,2’‐cyanine chloride (PIC) was prepared from 1,1’‐diethyl‐2,2’‐cyanine iodide from (Sigma Aldrich) via ion exchange (Amberlite IRA 402 Cl) under exclusion of light. The molar mass of PIC is 362.9 g mol−1. The crowding agents triethylene glycol (TEG), polyethylene glycol (PEG, Mn=400 g mol−1), sucrose and Ficoll 400 (Mn=400 000 g mol−1) were provided by Sigma Aldrich (Darmstadt, Germany). Leibovitz's l‐15 medium was obtained from Thermo Fisher (Waltham, USA). LS‐MS Grade water from VWR International (Radnor, USA) was used to prepare the solvents. For the cell culture it was used Dulbecco's Modified Eagle's Medium—low glucose (DMEM), Dulbecco's Phosphate Buffered Saline (DPBS), EDTA, Penicillin‐Streptomycin, Fetal Bovine Serum (FBS), Trypsine (0,05 %) EDTA (0,02 %) which were provided by Sigma–Aldrich and sodium chloride obtained from Sigma–Aldrich
Sample preparation
Aqueous solutions of crowding agents with contents varying from 2 wt % to 25 wt % served as solvents. Solvents containing Ficoll 400 were slightly acidic. As Ficoll would undergo chemical decomposition, especially at elevated temperatures, the pH of the solvent thus had to be adjusted to 7 to ensure chemical stability of Ficoll 400. Stock solutions of PIC in the presence of crowding agents had a PIC concentration of 6 mm. Stock solutions in pure water were prepared either at 6 or 8 mm of PIC. In Leibovitz's solution, the concentration of the stock solution was set to [PIC]=0.25 mm. Solutions were then stirred overnight at a temperature of 50° C in the absence of light to ensure complete dissolution without decomposition. For in vivo experiments the stock solution of PIC was diluted to 50 μm.
Cell culture
HeLa Cells were split every 2 to 3 days when reaching a confluency of 80 to 90 % in a T‐25 flask. The confluency was monitored with a light microscope (Leica). To split the cells, the old growth medium was removed and washed with 1 mL DPBS twice. Trypsine (0.5 mL) was added to detach the cells. Afterwards, growth medium (3.5 mL) was added and the corresponding amount of cell were transferred to a new T‐25 flask with additional growth medium (3 mL). To prepare for the experiment, HeLa Cells were split into small Fluorodishes (10 mm diameter, WPI) one day before the experiments. Before imaging the cells were washed twice with DPBS (200 μL) and placed under the microscope. PIC in Leibovitz's solution (200 μL) was added to the samples. For osmotic shock experiments, NaCl was added to the solution to reach a final concentration of 100 μm and 500 μm.
For the absorption spectroscopy, to determine the concentration of PIC in the cells, samples of the same amount of cells were split to 24‐well dishes. After 24 h, the cells were washed twice with DPBS (200 μL). PIC solution (200 μL) was added to the cells and incubated for distinct time intervals. Afterwards, the supernatant was removed and analyzed by absorption spectroscopy. The remaining cells were detached from the surface with Trypsine (200 μL) and the population was counted.
Fluorescence microscopy
The cells were imaged with a Zeiss Observer.Z1 wide field microscope. PIC was excited by using an LED with a wavelength of 530 nm. Emission light was detected using the AHF Analysentechnik beam splitter Dual 532/640 ET, the AHF Analysentechnik detector cube H 643 and a Zeiss AxioCam HSm camera. To control the temperature of the samples the Brook Industries Z‐HC‐K‐3112 temperature stage was used. Images were recorded every 2.5 minutes (100 ms exposure time) for 60 min and analyzed using ImageJ. ROIs (Regions of Interest) were set to analyze the average fluorescence intensity in the cytoplasm. A sample size of at least 100 cells was measured and analyzed and the errors determined as standard deviation (s.d.).
Confocal fluorescence microscopy
The cells were imaged using an Olympus FV 3000 confocal microscope. PIC was excited with a wavelength of 532 nm. Emission light was detected using the beam splitter DM405/488/561 and a PMT. The scanning speed was 2 μs/pixel measuring 512×512 pixel. The detection range for the emission light was between 550 and 600 nm. The images were acquired after 30 min of cellular treatment with PIC solution.
Determination of in‐cell concentration
PIC concentration was determined using absorption spectroscopy. The absorption coefficient of PIC was determined as ϵ 525=50000 L mol−1 cm−1 using Lambert–Beer's law. The in‐cell concentration was then calculated by the loss of PIC in the supernatant [Eq. (1)]:
| (1) |
cstandard is the concentration of PIC that was added to the cells. csupernatant is the remaining concentration after cellular uptake for a specific incubation time. Thereby the concentration of PIC accumulated the cells can be calculated. Thus, the amount of substance in one cell (ncell) can be calculated by [Eq. (2)]
| (2) |
The volume Vsupernatant is the volume that was used for incubation and Ncell the cell count. The concentration of PIC in the cell can be calculated using the average volume of HeLa Cells (Vcell=2600 μm3).63 [Eq. (3)]
| (3) |
The error was determined using the standard derivation error calculation and comes from the faulty concentration measurement via UV/Vis spectroscopy.
UV/Vis spectroscopy
UV/VIS spectra were recorded with a Lambda‐19 spectrometer from Perkin–Elmer (Waltham, USA). Spectra were recorded from 400 to 600 nm with a scan speed of 120 nm min−1 and a slit width of 2 mm. A custom‐built copper block was used as a cuvette holder, which can be thermostated externally to enable temperature sensitive measurements. For concentrations of [PIC] >1 mm, a demountable cuvette with a path length of 0.01 cm was used. For samples with a concentration of 0.1 mm≤[PIC]≤1 mm, cuvettes with a path length of 1 cm were used. The monomer spectrum of PIC at 3 μm was recorded in a cuvette with a path length of 5 cm. All cuvettes were provided by Hellma Analytics (Mühlheim, Germany).
Static and dynamic light scattering (SLS and DLS)
Light‐scattering experiments were made with a multi‐detection laser light‐scattering system ALV/CGS‐3/MD‐8 from ALV GmbH (Langen, Germany). A He‐Ne Laser with a wavelength of 632.8 nm was used as a light source. The system provides an array of 8 detectors with a shift between two neighboring detectors of 8°, thus allowing simultaneous dynamic and static light scattering in a time‐dependent manner. An angular range of 30°≤θ≤86° was covered, corresponding to a q‐range in water of 6.8×10⁻³≤q≤18×10−3 nm−1 with [Eq. (4)]
| (4) |
as the momentum transfer vector, n=1.332 the refractive index of water at T=25 °C, θ the scattering angle and λ0 the laser wavelength in vacuum. For each datapoint, scattered light was recorded for 10 seconds. Cylindrical light scattering cuvettes from Hellma (Mühlheim, Germany) with a diameter of 2.4 cm were used.
To remove dust, the solutions were filtered prior to a scattering experiment by means of Millex‐GV (PVDF, 0.22 μm) syringe filters from Merck Millipore (Billerica, USA). The solutions were successively equilibrated in the light scattering device for 10 minutes. The starting temperature is 35 °C for the sample containing Ficoll 400 and 25 °C for all other solutions. A measurement was started together with a temperature gradient, during 3 h ending at 10 °C. The gradients were controlled by an external thermostat.
Data from static light scattering were evaluated with the Zimm approximation.64 Dynamic light scattering was analyzed in terms of a cumulant analysis.65 A detailed description of both approaches can be found in the Supporting Information (Section 8).
The refractive indices of crowder solutions, which also served as solvents for PIC are required for SLS and DLS data evaluation. Refractive indices of crowder solutions were measured with an Abbe refractometer from Carl Zeiss AG (Oberkochen, Germany) at 25 °C, covering a concentration regime of 1 wt % to 25 wt % of crowder. Each solution was measured three times.
For DLS data analysis, the dynamic viscosities η of the crowder solutions are needed in addition. Dynamic viscosities were determined with an Ubbelohde viscosimeter from Schott AG (Mainz, Germany) at 25 °C at 1 wt % and 5 wt % of crowder content. The viscosity of each solution was determined three times. The slight temperature dependence of the viscosity was taken into account by applying the known relative temperature dependence of the water viscosity on the aqueous solutions of the crowders respectively.
Determination of the aggregation threshold via UV/Vis‐spectroscopy
A dilution series of the stock solution of PIC in pure water was prepared, covering a concentration regime from 5 to 8 mm in steps of 0.5 mm. For solutions containing crowding agents, a concentration regime from 4 to 8 mm was covered in steps of 0.5 mm. Absorption at 573 nm A573 was then recorded as a function of temperature, which was decreased in increments of 1 °C. The temperature increment during which A573 increased at least two‐fold was defined as the aggregation threshold temperature. An example of this approach is shown in the Supporting Information (Figure S1 b).
Temperature‐dependent recording of A573
For all stock solutions of PIC at 6 mm in either pure water or in the presence of crowding agents (2 wt %), the absorption at 573 nm A573 was recorded in a time‐dependent manner while decreasing the temperature from 25 °C to 10 °C with a linear temperature gradient of 0.375 °C min−1. For the sample containing Ficoll, the starting temperature was increased to 35 °C in order to capture the aggregation threshold. In order to stress the temperature dependence, the time axis was transformed into a temperature axis.
Conflict of interest
The authors declare no conflict of interest.
Supporting information
As a service to our authors and readers, this journal provides supporting information supplied by the authors. Such materials are peer reviewed and may be re‐organized for online delivery, but are not copy‐edited or typeset. Technical support issues arising from supporting information (other than missing files) should be addressed to the authors.
Supplementary
Acknowledgements
B.H. and R.P. carried out all experiments and contributed equally to this work. S.E., and K.H. designed the study. The authors are grateful to Professor W. Schröer, Bremen University, for the donation of an additional sample of PIC.
B. Hämisch, R. Pollak, S. Ebbinghaus, K. Huber, Chem. Eur. J. 2020, 26, 7041.
Contributor Information
Prof. Dr. Simon Ebbinghaus, Email: s.ebbinghaus@tu-braunschweig.de.
Prof. Dr. Klaus Huber, Email: klaus.huber@upb.de.
References
- 1. Alberts B., Bray D., Lewis J., Raff M., Roberts K., Watson J. D., The Molecular Biology of the Cell, Garland Publishers, New York, 1994. [Google Scholar]
- 2. Dobson C. M., Nature 2003, 426, 884. [DOI] [PubMed] [Google Scholar]
- 3. Selkoe D. J., Annu. Rev. Cell Biol. 1994, 10, 373. [DOI] [PubMed] [Google Scholar]
- 4. Cohen S. I. A., Linse S., Luheshi L. M., Hellstrand E., White D. A., Rajah L., Otzen D. E., Vendruscolo M., Dobson C. M., Knowles T. P. J., Proc. Natl. Acad. Sci. USA 2013, 110, 9758. [DOI] [PMC free article] [PubMed] [Google Scholar]
- 5. Ellis R. J., Trends Biochem. Sci. 2001, 26, 597. [DOI] [PubMed] [Google Scholar]
- 6. Asakura S., Oosawa F., J. Chem. Phys. 1954, 22, 1255. [Google Scholar]
- 7. Asakura S., Oosawa F., J. Polym. Sci. 1958, 33, 183. [Google Scholar]
- 8. Vrij A. V., Pure Appl. Chem. 1976, 48, 471. [Google Scholar]
- 9. Lekkerkerker H. N. W., Tuinier R., Colloids and the Depletion Interaction, Springer, 2011. [Google Scholar]
- 10. Minton A. P., Biopolymers 1981, 20, 2093. [Google Scholar]
- 11. Minton A. P., Mol. Cell. Biochem. 1983, 55, 119. [DOI] [PubMed] [Google Scholar]
- 12. Chatelier R. C., Minton A. P., Biopolymers 1987, 26, 1097. [DOI] [PubMed] [Google Scholar]
- 13. Bosma H. J., Voordouw G., De Kok A., Veeger C., FEBS Lett. 1980, 120, 179. [DOI] [PubMed] [Google Scholar]
- 14. Nichol L. W., Ogston A. G., Wills P. R., FEBS Lett. 1981, 126, 18. [DOI] [PubMed] [Google Scholar]
- 15. Ross P. D., Minton A. P., Biochem. Biophys. Res. Commun. 1979, 88, 1308. [DOI] [PubMed] [Google Scholar]
- 16. Wilf J., Minton A. P., Biochim. Biophys. Acta Protein Struct. 1981, 670, 316. [DOI] [PubMed] [Google Scholar]
- 17. Rivas G., Fernandez J. A., Minton A. P., Biochemistry 1999, 38, 9379. [DOI] [PubMed] [Google Scholar]
- 18. Hatters D. M., Minton A. P., Howlett G. J., J. Biol. Chem. 2002, 277, 7824. [DOI] [PubMed] [Google Scholar]
- 19. Rosin C., Schummel P. H., Winter R., Phys. Chem. Chem. Phys. 2015, 17, 8330. [DOI] [PubMed] [Google Scholar]
- 20. Rivas G., Fernandez J. A., Minton A. P., Proc. Natl. Acad. Sci. USA 2001, 98, 3150. [DOI] [PMC free article] [PubMed] [Google Scholar]
- 21. Hosek M., Tang J. X., Phys. Rev. E 2004, 69, 051907. [DOI] [PubMed] [Google Scholar]
- 22. González J. M., Jiménez M., Vélez M., Mingorance J., Andreu J. M., Vicente M., Rivas G., J. Biol. Chem. 2003, 278, 37664. [DOI] [PubMed] [Google Scholar]
- 23. Sukenik S., Harries D., Prion 2012, 6, 26. [DOI] [PMC free article] [PubMed] [Google Scholar]
- 24. Monterroso B., Reija B., Jiménez M., Zorrilla S., Rivas G., PLoS One 2016, 11, e0149060. [DOI] [PMC free article] [PubMed] [Google Scholar]
- 25. Gao M., Estel K., Seeliger J., Friedrich R. P., Dogan S., Wanker E. E., Winter R., Ebbinghaus S., Phys. Chem. Chem. Phys. 2015, 17, 8338. [DOI] [PubMed] [Google Scholar]
- 26. Sukenik S., Politi R., Ziserman L., Danino D., Friedler A., Harries D., PLoS One 2011, 6, e15608. [DOI] [PMC free article] [PubMed] [Google Scholar]
- 27. Witte T., Haller L. A., Luttmann E., Krüger J., Fels G., Huber K., J. Struct. Biol. 2007, 159, 71. [DOI] [PubMed] [Google Scholar]
- 28. Michels R., Hertle Y., Hellweg T., Huber K., J. Phys. Chem. B 2013, 117, 15165. [DOI] [PubMed] [Google Scholar]
- 29. Edwards D. J., Ormerod A. P., Tiddy G. J. T., Jaber A. A., Mahendrasingham A., in Physico-Chemical Princ. Color Chem. (Eds: A. T. Peters, H. S. Freeman), Springer Netherlands, Dordrecht, 1996, pp. 83–106. [Google Scholar]
- 30. Jelley E. E., Nature 1936, 138, 1009. [Google Scholar]
- 31. Jelley E. E., Nature 1937, 139-140, 631. [Google Scholar]
- 32. Scheibe G., Kandler L., Ecker H., Naturwissenschaften 1937, 25, 474. [Google Scholar]
- 33. Scheibe G., Kandler L., Ecker H., Naturwissenschaften 1937, 25, 75. [Google Scholar]
- 34. Scheibe G., Angew. Chem. 1937, 50, 212. [Google Scholar]
- 35. Cooper W., Chem. Phys. Lett. 1970, 7, 73. [Google Scholar]
- 36. Herz A. H., Adv. Colloid Interface Sci. 1977, 8, 237. [Google Scholar]
- 37. Zimmermann H., Scheibe G., Z. Elektrochem. 1956, 60, 566. [Google Scholar]
- 38. Daltrozzo E., Scheibe G., Gschwind K., Halmerl F., Photograph. Sci. Eng. 1974, 18, 441. [Google Scholar]
- 39. Kopainsky B., Hallermeier J. K., Kaiser W., Chem. Phys. Lett. 1981, 83, 498. [Google Scholar]
- 40. Kopainsky B., Hallermeier J. K., Chem. Phys. Lett. 1982, 87, 7. [Google Scholar]
- 41. von Berlepsch H., Böttcher C., Dähne L., J. Phys. Chem. B 2000, 104, 8792. [Google Scholar]
- 42. Von Berlepsch H., Böttcher C., J. Phys. Chem. B 2002, 106, 3146. [Google Scholar]
- 43. Tycko R., Biochemistry 2003, 42, 3151. [DOI] [PubMed] [Google Scholar]
- 44. Herzog B., Huber K., Stegemeyer H., Langmuir 2003, 19, 5223. [Google Scholar]
- 45. Fidder H., Wiersma D. A., Phys. Rev. Lett. 1991, 66, 1501. [DOI] [PubMed] [Google Scholar]
- 46. Kasha M., Rawls H. R., El-Bayoumi M. A., Pure Appl. Chem. 1965, 11, 371. [Google Scholar]
- 47. Neumann B., Pollmann P., Phys. Chem. Chem. Phys. 2000, 2, 4784. [Google Scholar]
- 48. Horng M.-L., Quitevis E. L., J. Chem. Educ. 2000, 77, 637. [Google Scholar]
- 49. Dainton F. S., Ivin F. R. S., Ivin K. J., Q. Rev. Chem. Soc. 1958, 12, 61. [Google Scholar]
- 50. Knowles D. B., Shkel I. A., Phan N. M., Sternke M., Lingeman E., Cheng X., Cheng L., O'Connor K., Record M. T., Biochemistry 2015, 54, 3528. [DOI] [PMC free article] [PubMed] [Google Scholar]
- 51. Sukenik S., Ren P., Gruebele M., Proc. Natl. Acad. Sci. USA 2017, 114, 6776. [DOI] [PMC free article] [PubMed] [Google Scholar]
- 52. Boersma A. J., Zuhorn I. S., Poolman B., Nat. Methods 2015, 12, 227. [DOI] [PubMed] [Google Scholar]
- 53. Gnutt D., Brylski O., Edengeiser E., Havenith M., Ebbinghaus S., Mol. Biosyst. 2017, 13, 2218. [DOI] [PubMed] [Google Scholar]
- 54. Gnutt D., Gao M., Brylski O., Heyden M., Ebbinghaus S., Angew. Chem. Int. Ed. 2015, 54, 2548; [DOI] [PMC free article] [PubMed] [Google Scholar]; Angew. Chem. 2015, 127, 2578. [Google Scholar]
- 55. Burg M. B., Cell. Physiol. Biochem. 2000, 10, 251. [DOI] [PubMed] [Google Scholar]
- 56. Minton A. P., Front. Phys. 2014, 2, 48. [Google Scholar]
- 57. Uversky V. N., Cooper E. M., Bower K. S., Li J., Fink A. L., FEBS Lett. 2002, 515, 99. [DOI] [PubMed] [Google Scholar]
- 58. Van Den Berg J., Boersma A. J., Poolman B., Nat. Rev. Microbiol. 2017, 15, 309. [DOI] [PubMed] [Google Scholar]
- 59. Burg M. B., Ferraris J. D., Dmitrieva N. I., Physiol. Rev. 2007, 87, 1441. [DOI] [PubMed] [Google Scholar]
- 60. Hoffmann E. K., Lambert I. H., Pedersen S. F., Physiol. Rev. 2009, 89, 193. [DOI] [PubMed] [Google Scholar]
- 61. Yancey P. H., Clark M. E., Hand S. C., Bowlus R. D., Somero G. N., Science 1982, 217, 1214. [DOI] [PubMed] [Google Scholar]
- 62. Yancey P. H., J. Exp. Biol. 2005, 208, 2819. [DOI] [PubMed] [Google Scholar]
- 63. Zhao L., Kroenke C. D., Song J., Piwnica-Worms D., Ackerman J. J. H., Neil J. J., NMR Biomed. 2008, 21, 159. [DOI] [PMC free article] [PubMed] [Google Scholar]
- 64. Zimm B. H., J. Chem. Phys. 1948, 16, 1093. [Google Scholar]
- 65. Koppel D. E., J. Chem. Phys. 1972, 57, 4814. [Google Scholar]
Associated Data
This section collects any data citations, data availability statements, or supplementary materials included in this article.
Supplementary Materials
As a service to our authors and readers, this journal provides supporting information supplied by the authors. Such materials are peer reviewed and may be re‐organized for online delivery, but are not copy‐edited or typeset. Technical support issues arising from supporting information (other than missing files) should be addressed to the authors.
Supplementary