

Abstract
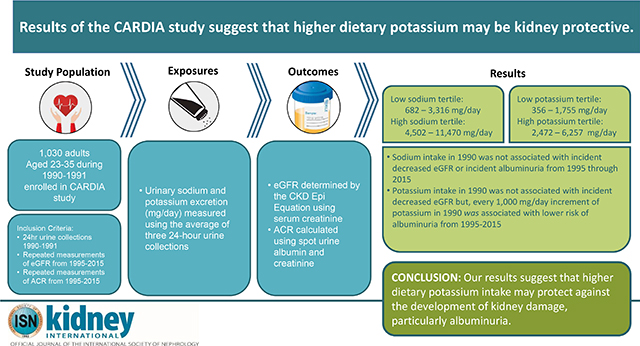
The association between dietary sodium and potassium intake with the development of kidney disease remains unclear, particularly among younger individuals. Here, we determined whether dietary sodium and potassium intake are associated with incident chronic kidney disease (CKD) using data from 1,030 adults (age 23–35 in 1990–1991) from the Coronary Artery Risk Development In Young Adults study, based on repeated measurements of estimated glomerular filtration rate (eGFR) and urinary albumin to creatinine ratio (ACR) from 1995 through 2015. Urinary sodium and potassium excretion (mg/day), calculated from three 24-hour urine collections in 1990–1991, were averaged to measure sodium and potassium intake. Serum creatinine was used to calculate eGFR using the CKD EPI equation; spot urine albumin and creatinine were used to calculate ACR, each at five visits from 1995–1996 through 2015–2016. CKD was defined as decreased eGFR (under 60 ml/min/1.73m2) or the development of albuminuria (ACR over 30 mg/g). We used log binomial regression models adjusted for socio-demographic, behavioral, and clinical factors to determine whether sodium and potassium intake were associated with incident CKD (decreased eGFR or developed albuminuria) among those free of CKD in 1995. Dietary sodium intake was not significantly associated with incident CKD. However, every 1,000 mg/day increment of potassium intake in 1990 was significantly associated with a 29% lower risk of incident albuminuria (relative risk 0.71, 95% confidence interval 0.53, 0.95), but not eGFR. Thus, higher dietary potassium intake may protect against the development of kidney damage, particularly albuminuria.
Keywords: urine sodium, urine potassium, albuminuria, eGFR, chronic kidney disease (CKD)
Graphical Abstract
Introduction
Chronic kidney disease (CKD) is a major public health issue associated with increased risk of renal failure, cardiovascular disease (CVD), and all-cause mortality.1,2 The prevalence of CKD has been on the rise and now impacts greater than 10% of the US population,3 posing a great health and economic burden. 4 Current international guidelines for individuals with CKD recommend lifestyle modification for CKD management,5–7 such as dietary sodium reduction.6–11 However, the rationale for sodium reduction among individuals with CKD is predicated on the blood pressure (BP) lowering effect of a low sodium diet12 rather than a directly established association between high sodium diet and the development of CKD.5
Given that elevated BP is a major risk factor for CKD, dietary risk factors for elevated BP—such as high sodium and low potassium intakes, may also act as risk factors for the development of CKD. Yet, studies investigating the association between dietary sodium or potassium with renal function13–22 are limited in that: they have focused on populations with existing CKD or other chronic conditions such as diabetes,14,16,17,21–23 utilize subjective measures of diet,13,19 and have produced inconsistent results. For example, among individuals with CKD, some studies have shown null findings,15,22 while other studies have shown that high sodium is associated with progression of renal disease,17,23 or a “J” shape relationship between sodium and renal outcomes.13,14 The association between dietary potassium intake and renal outcomes has been less explored and also inconsistent. 21–24 To date, few studies have investigated the relationship of objectively measured dietary sodium or potassium (i.e. from 24-hour urine)26 with incident CKD or changes in renal function among a young, relatively healthy CKD-free population.
The goal of the current study is to determine whether 24-hour urinary sodium and potassium excretion in 1990 is associated with incident CKD, and changes in renal function from 1995 through 2015 among participants of the Coronary Artery Risk Development In young Adults (CARDIA) study.
Results
Mean age in the sample was 30 in 1990 with 57% female, 54% Black, and a mean of 14 years of education (Table 1).Mean systolic BP was 108 mmHg, with 6.6% having hypertension and only 1.8% treated for hypertension. Overall, mean sodium and potassium intakes were 4,074 mg/day and 2,223 mg/day, respectively. Compared to those among the low sodium tertile (range: 682 – 3,316 mg/day) those in the high tertile (range: 4,502 – 11,470 mg/day) were more likely to be men, have fewer years of education, have greater levels of physical activity, have a higher BMI, higher systolic BP, and more likely to have hypertension. Compared to those in the high potassium tertile (range: 2,472 – 6,257 mg/day) those in the low tertile (range: 356 – 1,755 mg/day) were more likely to be women, Black, have fewer years of education, have a lower income, were more likely to smoke, and have lower levels of physical activity.
Table 1.
Characteristics of study participants across tertiles of urinary sodium and potassium in 1990, CARDIA study
| Overall | Tertiles of average urinary sodiuma |
Tertiles of average urinary potassiuma |
|||||
|---|---|---|---|---|---|---|---|
| Low (range: 682−3,316 mg/day) | Medium (range: 3,319−4,491 mg/day) | High (range: 4,502−11,470 mg/day) | Low (range: 356−1,755 mg/day) | Medium (range: 1,759−2,471 mg/day) | High (range: 2,472−6,257 mg/day) | ||
| Characteristics | N=1,030 | n=343 | n=344 | n=343 | n=343 | n=344 | n=343 |
| Age, years | 30.2 (3.6) | 30.2 (3.8) | 30.3 (3.5) | 30.1 (3.5) | 30.0 (3.8) | 30.0 (3.6) | 30.5 (3.3) |
| Female, n (%)*ⱡ | 589 (57.2) | 246 (71.7) | 219 (63.7) | 124 (36.2) | 259 (75.5) | 206 (59.9) | 124 (36.2) |
| Black, n (%)ⱡ | 556 (54.0) | 187 (54.5) | 181 (52.6) | 188 (54.8) | 252 (73.5) | 186 (54.1) | 118 (34.4) |
| Education, years*ⱡ | 14.1 (2.2) | 14.2 (2.1) | 14.2 (2.3) | 13.8 (2.3) | 13.6 (2.0) | 14.0 (2.2) | 14.5 (2.4) |
| Income < $35,000, n (%)ⱡ | 621 (60.3) | 212 (62.5) | 211 (62.4) | 198 (58.6) | 226 (67.7) | 212 (62.0) | 183 (54.0) |
| Smoker, n (%)ⱡ | 297 (28.8) | 89 (26.0) | 101 (29.5) | 107 (31.2) | 117 (34.1) | 104 (30.2) | 76 (22.2) |
| Physical Activity, total intensity score*ⱡ, mean (interquartile range) | 385.6 (160−539) | 345.4 (138−465) | 396.5 (179−563) | 415.0 (180−597) | 337.3 (125−459) | 376.0 (156−513) | 443.6 (210−627) |
| BMI, kg/m2*ⱡ mean (interquartile range) | 27.0 (22.6−29.8) | 25.4 (21.7−27.7) | 26.7 (22.6−29.0) | 29.1 (24.2−32.2) | 26.8 (22.0−30.6) | 27.5 (22.7−30.3) | 26.8 (23.0−28.7) |
| Systolic BP, mmHg* | 108.1 (11.7) | 105.1 (10.6) | 108.0 (11.6) | 111.4 (12.0) | 106.9 (11.9) | 108.9 (12.1) | 108.7 (11.1) |
| Hypertension, n (%)* | 68 (6.6%) | 17 (5.0) | 21 (6.1) | 30 (8.9) | 9 (2.6) | 30 (8.7) | 18 (5.3) |
| Antihypertension medication use, n (%) | 18 (1.8%) | 6 (1.8) | 5 (1.5) | 7 (2.0) | 1 (0.3) | 4 (1.2) | 5 (1.5) |
| Diuretic use, n (%) | 8 (0.8) | 1 (0.3) | 2 (0.6) | 5 (1.5) | 1 (0.3) | 4 (1.2) | 3 (0.9) |
| Diabetes, n (%) | 13 (1.3) | 4 (1.2) | 3 (0.9) | 6 (1.8) | 4 (1.2) | 4 (1.2) | 5 (1.5) |
| Total cholesterol, mg/dL | 179.0 (34.3) | 176.6 (32.7) | 179.1 (35.0) | 181.2 (35.0) | 178.5 (34.3) | 178.4 (33.0) | 180.0 (35.6) |
| Sodium, mg/day | 4,074 (1,487) | 2,627 (542) | 3,843 (339) | 5,753 (1,124) | 3,291 (986) | 4,105 (1,364) | 4,827 (1,623) |
| Potassium, mg/day | 2,223 (902) | 1,826 (786) | 2,141 (798) | 2,701 (892) | 1,340 (295) | 2,099 (197) | 3,229 (712) |
| Creatinine, mg/day | 1,630 (668) | 1,288 (374) | 1,551 (449) | 2,051 (836) | 1,310 (368) | 1,627 (489) | 1,952 (872) |
Abbreviations: BMI: body mass index; CARDIA: Coronary Artery Risk Development in Young Adults; CVD: cardiovascular disease.
Data are presented as mean (SD) unless otherwise noted.
Characteristic differs by tertile of urinary sodium excretion, p for trend < 0.05
Characteristic differs by tertile of urinary potassium excretion, p for trend < 0.05
Among individuals without decreased eGFR or albuminuria in 1995 (i.e. free from CKD in 1995), the cumulative incidence of decreased eGFR, albuminuria, and decreased eGFR or albuminuria from 1995–2015 was: 5.1%, 11.8%, and 13.6%, respectively (not shown). Sodium intake in 1990 was not significantly associated with incident decreased eGFR or incident albuminuria from 1995 through 2015 (Figure 1). Low vs. high tertile for potassium intake in 1990 was not significantly associated with incident decreased eGFR (5.3% vs. 5.4%, p=0.89) but was significantly associated with incident albuminuria (16.2% vs. 9.4%, p=0.03).
Figure 1:

Proportion of participants with incident decreased eGFR, albuminuria, and decreased eGFR or albuminuria from 1995 – 2015 by tertiles of sodium and potassium intake in 1990, the CARDIA study.
the number of individuals free from decreased eGFR, albuminuria, or either in 1995 is: 938, 808, and 796 respectively. These numbers represent the analytic sample sizes for each Figure 1 analysis.
Abbreviations: CARDIA: Coronary Artery Risk Development in Young Adults; eGFR: estimated glomerular filtration rate; Decreased eGFR is defined by an eGFR < 60 ml/min/1.73 m2; Albuminuria is defined by an albumin to creatinine ratio > 30 mg/g
From fully adjusted log binomial regression models, each 1,000 mg/day increment of sodium intake in 1990 was not significantly associated with incident decreased eGFR (RR: 1.01, 95% CI: 0.82, 1.24) or incident albuminuria (RR: 0.94, 95% CI: 0.80, 1.10) from 1995 through 2015 (Table 2). Potassium intake in 1990 was not significantly associated with incident decreased eGFR (RR: 1.10, 95% CI: 0.76, 1.61). However, each 1,000 mg/day increment of potassium in 1990 was significantly associated with lower risk of albuminuria (RR: 0.71, 95% CI: 0.52, 0.95) from 1995 through 2015. Results from the sensitivity analysis using tertiles of sodium or tertiles of potassium were consistent with our main conclusions and showed that middle or highest tertile of potassium vs. the lowest potassium tertile was significantly associated with a lower risk of albuminuria (results not shown).
Table 2.
Associations of sodium and potassium intake in 1990 with incident decreased eGFR and albuminuria (1995-2015), the CARDIA study.
| aModels | Decreased eGFR (eGFR < 60 ml/min/1.73 m2) RR (95% CI) | Albuminuria (ACR > 30 mg/g) RR (95% CI) | Decreased eGFR or albuminuria RR (95% CI) |
|---|---|---|---|
| Sodium (per 1 gram) | |||
| Model 1 | 1.10 (0.92, 1.32) | 1.03 (0.90, 1.19) | 1.06 (0.94, 1.21) |
| Model 2 | 1.07 (0.89, 1.30) | 1.02 (0.89, 1.18) | 1.05 (0.92, 1.19) |
| Model 3 | 1.04 (0.86, 1.25) | 0.97 (0.84, 1.13) | 1.01 (0.88, 1.16) |
| Model 4 | 1.01 (0.82, 1.24) | 0.94 (0.80, 1.10) | 0.99 (0.86, 1.15) |
| Potassium (per 1 gram) | |||
| Model 1 | 1.08 (0.79, 1.47) | 0.75 (0.58, 0.97) | 0.83 (0.66, 1.05) |
| Model 2 | 1.02 (0.74, 1.42) | 0.77 (0.59, 0.99) | 0.81 (0.63, 1.03) |
| Model 2 | 1.18 (0.83, 1.68) | 0.74 (0.56, 0.99) | 0.82 (0.63, 1.06) |
| Model 3 | 1.10 (0.76, 1.61) | 0.71 (0.52, 0.95) | 0.80 (0.61, 1.05) |
| Na/K | |||
| Model 1 | 1.03 (0.85, 1.25) | 1.14 (1.00, 1.30) | 1.13 (1.00, 1.27) |
| Model 2 | 1.04 (0.86, 1.28) | 1.14 (0.99, 1.30) | 1.15 (1.01, 1.30) |
| Model 3 | 0.94 (0.78, 1.18) | 1.08 (0.94, 1.25) | 1.09 (0.95, 1.24) |
| Model 4 | 0.96 (0.74, 1.23) | 1.09 (0.93, 1.26) | 1.10 (0.95, 1.27) |
Abbreviations: ACR: albumin to creatinine ratio; CARDIA: Coronary Artery Risk Development in Young Adults; eGFR: estimated glomerular filtration rate.
Model 1 is unadjusted; model 2 is adjusted for baseline (1995) eGFR (decreased eGFR outcome), ACR (Albuminuria outcome), or both eGFR and baseline ACR (Decreased eGFR or albuminuria ourcome); model 3 is additionally adjusted for 1995 age, sex, race, education, family income; model 4 additionally adjusts for 1995 smoking status, physical activity, body mass index, systolic blood pressure, diuretic use, diabetes, total cholesterol, and any antihypertension medication use (1995-2015).
Results from the sensitivity analysis using cystatin C to measure eGFRcys (as an outcome) were consistent with the results from the main models and showed no significant association between urinary sodium or potassium excretion in 1990 with rapid decline in eGFRcys from year 1995 through 2005 (results not shown).
Figure 2 displays eGFR and ACR trajectories (or growth curves) according to levels of sodium and potassium intake in 1990. On average eGFR declined 17.2 ml/min/1.73m2 over the 20 year follow-up period (95% CI: 16.1, 18.3) with decline unrelated to either sodium or potassium excretion. On average ACR increased 1.24 mg/g over the 20 year follow-up (95% CI: 1.16, 1.33) with a slower increase at higher levels of potassium but not sodium (see Figure 2).
Figure 2.

Predicted trajectories of eGFR and ACR between 1995 and 2015 by tertiles of urinary sodium and potassium excretion in 1990, the CARDIA study.
Estimates are based on the fully-adjusted linear mixed effect growth models of urinary sodium and potassium excretion in 1990 with time-dependent measures of eGFR and ACR. Predicted eGFR and ACR trajectories are shown by sodium and potassium intake. Other covariates used in the models were set to year 2000 values at the following levels: age 40, 57% women, 54% black, 14 years of education, 2% family income < $5k, 4% family income ≥ $5k and < $12k, 4% family income ≥ $12k and < $16k, 7% family income ≥ $16k and < $25k, 10% family income ≥ $25k and < $35k, 18% family income ≥ $35k and < $50k, 25% family income ≥ $50k and < $75k, 30% family income ≥ $75k, 61% never smokers, 18% current smokers, 21% never smokers, with an average of 339 exercise units, mean body mass index of 30 kg/m, 5% with diabetes, mean total cholesterol of 185 mg/dL, mean systolic blood pressure of 114 mmHg,, 4% on diuretics, and 9% on antihypertension medications.
Urinary sodium excretion in 1990 was not significantly associated with eGFR decline (sodium*time estimate: −0.18, 95% CI: −0.05, 0.02, p=0.29) or ACR increases (sodium*time estimate: −0.001, 95% CI: −0.007, 0.001, p=0.18). Urinary potassium excretion in 1990 was not significantly associated with eGFR decline (potassium*time estimate: −0.03, 95% CI: −0.03, 0.08, p=0.36) but was significantly associated with ACR (potassium*time estimate: −0.0031, 95% CI: − 0.0066, 0.0004, p=0.08). In other words, with urinary potassium excretion in the lower tertile, ACR increased 32% over 20 years vs. 17% in the higher tertile of urinary potassium excretion. Note: estimates for ACR models are log transformed.
Abbreviations: ACR: albumin to creatinine ratio; CARDIA: Coronary Artery Risk Development in Young Adults; eGFR: estimated glomerular filtration rate; USDA: US Department of Agriculture
Discussion
In a young sample of black or white adults, 14% developed either decreased eGFR or albuminuria between 1995 and 2015. Sodium intake in 1990 was not significantly associated with incident CKD or changes in renal function measured using either eGFR or ACR. However, every 1,000 mg increment of potassium in 1990 was significantly associated with a 29% lower risk of albuminuria and a less rapid ACR growth rate from 1995 through 2015. Taken together our results suggest that a diet high in potassium may help prevent renal damage.
For individuals with CKD, guidelines have historically recommended sodium restriction to low levels (i.e. < 1,500 mg/day for individuals with CKD in 2010).27 However, a number of studies, particularly among individuals with chronic conditions such as diabetes, noted an increase in CVD/renal outcomes among individuals with very low or very high sodium intake.13,14,28–30 US Department of Agriculture sodium guidelines were subsequently revised in 2015 to < 2,300 mg/day for all, with additional sodium reduction advisable for some.31 Despite the lack of consensus regarding an optimal lower sodium target for all adults, sodium intake at low levels, or even below 2,300 mg per day is rare. In fact, among US adults, mean sodium intake is 3,608 mg/day,32 well above current recommendations. In the current sample, mean sodium intake was nearly 4,000 mg/day; even mean sodium in the lowest sodium tertile (2,624 mg/day) exceeded recommendations. Therefore, due to its impact on BP, sodium reduction to more healthful levels is still advocated among individuals with CKD.33–35 For example, International kidney disease working groups still recommend restricting sodium to < 2,000 mg per day.7 Consistent with these recommendations, observational findings support sodium reduction. For example, results from the Reasons for Geographic and Racial Differences in Stroke study showed that higher sodium was associated with albuminuria, predominantly in heavier adults.20 Likewise, among healthy young adult males, dietary sodium restriction was found to reduce albuminuria independent of BP.36 Further, findings from the Nurse’s Health Study showed greater eGFR decline among individuals with higher sodium intake.19 In our study, of young, relatively healthy individuals, including those without CKD, we were unable to detect an association of sodium with CKD or with changes in eGFR or ACR. Despite these null findings, we caution over-interpretation of our results; further studies are certainly warranted to fully investigate these associations—perhaps in an older and/or larger sample with more power.
Among the general population including those with early stages of CKD, high potassium intake is recommended (i.e. > 4,700 mg/day).31 In our study, we found a strong significant association whereby potassium intake was associated with a lower risk of albuminuria. Even the lower, most conservative, bound of our estimate—a 5% lower risk of developing albuminuria—is substantial given that albuminuria is a common condition. Our results have also been mirrored by other studies. For example, cross sectional data from the National Health and Nutrition Examination Survey showed that low potassium intake measured from 24-hour dietary recall was associated with increased odds of CKD.37 Longitudinal results from the ONTARGET and TRANSCEND trials also showed higher potassium associated with lower odds of renal outcomes.22 Among participants of the Prevention of Renal and Vascular End-Stage Disease, a prospective population based sample of Dutch men and women aged 28 to 75 years of age, each 21 mmol/24 hour decrement of potassium (equivalent to 819 mg/day) was associated with a 16% higher risk of developing CKD over ten years.25 Likewise, in a Japanese cohort of individuals with diabetes, lower vs. higher potassium intake was associated with eGFR decline.21 Interestingly in our study, we found associations of potassium with ACR but not eGFR. Previous studies, particularly among those with CKD, have shown that potassium is associated with eGFR decline.23 Given these findings, further exploration of the relationship between dietary potassium and eGFR in healthy populations is warranted.
There are a number of mechanisms through which high dietary potassium may reduce the risk of renal damage: indirectly through hemodynamic effects as well as directly independent of BP. For example, a diet high in potassium may increase levels of serum potassium which can reduce vascular resistance.38,39 In turn, reduced vascular resistance can lower BP—improving renal function. Reduced vascular resistance can also directly lower the risk of renal dysfunction by increasing eGFR.39,40 High dietary potassium intake has also been linked to increased renal kallikrein expression, which promotes both vasodilation and reduces the risk of glomerulosclerotic lesions and tubular injury.41 Finally, potassium is a known marker of fruit and vegetable consumption42 and healthy diet.43 A healthy diet, specifically one with high fruits and vegetables intake can lower BP through anti-inflammatory and anti-oxidant effects that may subsequently prevent or blunt the progression of renal dysfunction.44,45
The current study includes some limitations worth noting. While, our measures of sodium and potassium (an average of 3 timed 24-hour urine collections) are accurate for a given point in time, we did not have repeated measures throughout the outcome period (years 1995 to 2015). Given natural dietary changes that occur throughout the lifecourse, as well as secular trends related to sodium content in processed and packaged foods,46 sodium and potassium intake in 1990 may not be reflective of habitual sodium and potassium intake throughout a 25 year follow-up period. The relatively young age of the sample (roughly 30 years old in 1990) was both a major strength and limitation. Due to the young age, we were able to observe declines in renal function throughout young adulthood. However, we were underpowered to detect CKD given its development later in the lifecourse. Along these lines, given our sample size, roughly 1,000 individuals, we were not powered to detect heterogeneity in our effect estimate. For example, studies have shown more pronounced associations between sodium or potassium and renal function among obese vs. normal individuals.20,36 Finally, our measures of CKD: ACR and eGFR (measured using serum creatinine) were imperfect. For example, creatinine is known to vary based on sex, race, and muscle mass. We could not fully account for these factors in our analysis—though we did attempt to address this issue through sex and race specific eGFR calculations. Additionally, we ran a sensitivity analysis across three years of the study period in which eGFR—measured through cystatin C—was available. However, this analysis was underpowered.
Despite such limitations, this study has many strengths. First, given the young sample and long follow-up period we were able to observe the natural history of disease. We highlight this as particularly important given that the majority of studies examining the relationship between sodium and potassium with renal outcomes have focused on older cohorts with prevalent renal damage. Further, this study includes gold-standard measures of both sodium and potassium intake,26 though we do acknowledge that 24-hour urine is a better measure of sodium than potassium. Finally, though imperfect, we also included two clinically ascertained measures of renal function (ACR and eGFR) measured five times over a period of 20-years.
In summary, in a sample of young, relatively healthy black or white adults, dietary sodium intake in 1990 was not significantly associated with subsequent eGFR decline or incident albuminuria. While low intake of potassium in 1990 was not associated with eGFR decline, we did find that it was significantly associated an increased risk of albuminuria between 1995 and 2015. Our findings suggest that a diet high in potassium may lower risk of renal damage among healthy disease-free individuals. Additional studies, with larger sample sizes, are warranted to further clarify this association.
Methods
Study population
CARDIA is an ongoing cohort study which enrolled 5,114 participants aged 18 to 30 years old in 1985–86 from 4 centers in: Birmingham, AL; Minneapolis, MN; Chicago, IL; and Oakland, CA. Recruitment was balanced within center by sex, age, and education. Individuals were asked to participate in an examination at study entry and to be re-examined in years 2, 5, 10 (our study baseline), 15, 20, 25, and 30. Going forward we refer to each CARDIA follow-up visit by the calendar year in which it began. Standardized protocols were used to assess demographic, social, and clinical data at each study visit. Comprehensive study details have been described elsewhere.47 The study was approved by the institutional review boards from each field center and the coordinating center.
Measurement of sodium and potassium in 1990
In 1990, three timed 24-hour urine samples were collected from a sub-sample of 1,104 CARDIA participants. Individuals who were chosen to participate were randomly recruited from sex-race specific groups at each study site. The volume of each 24-hour urine collection was measured and an aliquot of each 24-hour urine collection was sent to the laboratory for measurement of sodium, potassium, and urine creatinine (i.e. three separate aliquots per person corresponding to each 24-hour collection). Sodium and potassium were analyzed by potentiometric methods; urine creatinine by colorimetric methods, all on a Kodak Ektachem 400 and normalized to reflect one day. Laboratory values of sodium, potassium, and creatinine for each of the three 24-hour collections were then converted into mg/day. For each participant we removed outlier values (sodium and potassium values greater than 20,000 mg/day). In total, only two outliers for sodium and one outlier for potassium was removed across all three collections and all participants had at least one value for sodium or potassium even after outliers were excluded. Next, to account for the possibility of an incomplete urine collection, we applied an exclusion criteria to each 24-hour urine collection. Any urine collection with a total volume < 500 mL, creatinine < 688 mg for men or < 430 mg for women was deemed incomplete and set to missing for that collection.48 Additionally, given that urinary creatinine excretion is relatively stable from day to day, we tested for within person differences in mean creatinine excretion for each collection using paired t-tests. We found that there were no significant differences in creatinine excretion across collections. Overall, 2.5% of the sample had only 1 complete collection, with 14% of the sample with two complete collections, and the remaining 84% with all 3 complete collections. We then calculated the average sodium and potassium (in mg/day) from the complete collectionsand categorized them into tertiles.
Measurement of renal function from 1995 to 2015
Estimated glomerular filtration rate (eGFR) and albumin to creatinine ratio (ACR) were used to characterize renal function. Decreased eGFR: serum creatinine was measured from blood samples using the Jaffe method. Using the CKD Epi Equation49 we calculated sex and race specific eGFR from standardized values of serum creatinine at all five study visits from 1995 through 2015 (it was not assessed in 1990). An eGFR value < 60 ml/min/1.73m2 at any visit was used to define decreased GFR.50 Albuminuria: urine albumin and urine creatinine were measured at all five examinations from 1995 through 2015 using one spot urine collection (it was not assessed in 1990). Urinary albumin was assessed using a nephelometric procedure. Urinary creatinine was assessed also using the Jaffe method. ACR was calculated as the ratio of urinary albumin (mg) to urinary creatinine (g). An ACR value > 30 mg/g at any visit was used to define albuminuria.50 In addition to examining decreased eGFR and albuminuria separately, we used the Kidney Disease Improving Global Outcomes (KDIGO) Chronic Kidney Disease Work Group7 categories of moderate, high, or very high risk to classify participants in an aggregated CKD measure of either decreased eGFR or albuminuria at any visit. The KDIGO normal/low risk category was defined as both ACR< 30 and eGFR ≥ 60. Based on those measures, our primary outcomes were: incident decreased eGFR, incident albuminuria, and incident decreased eGFR or albuminuria at any visit between 2000 and 2015 (i.e. among individuals who in 1995 did not present with either condition).
As a secondary outcome, and following previously published methods,51,52 we used cystatin C to calculate rapid decline in renal function, defined as an eGFRcys loss of >3% ml/min/1.73m2 per year. Cystatin C was only measured in years 1995, 2000, and 2005. For these years stored sera samples were analyzed for cystatin C by nephelometer using the N Latex cystatin C kit at the University of Minnesota.
Measurement of covariates
Age, sex, race, years of education, income, and smoking status (defined as never, current, and former) were self-reported and ascertained by standardized questionnaires. Physical activity was measured using total amount of exercise in exercise units, which was calculated using reports of the amount of time per week spent in 13 categories of physical activity over the past year. Body mass index (BMI) was calculated as weight in kilograms divided by height in meters squared (kg/m2). Diabetes was defined as fasting serum glucose level ≥ 126 mg/dL or self-reported diabetes medication use in each exam year. Total cholesterol (mg/dl) was measured from fasting blood draws. BP was measured while seated using a standard automated BP measurement monitor (OMRON model HEM907XL; Omron). Additionally, participants reported their medication use, including use of diuretic medications. All the covariates were repeatedly ascertained from examinations from 1990 through 2015.
Statistics
We first described socio-demographic and health characteristics of the study sample in 1990 overall and by tertiles of urinary sodium and potassium excretion. Next, we estimated the proportion of participants who in 1995 (baseline) did not present with decreased eGFR or albuminuria and went on to develop one or the other (i.e. the cumulative incidence across the study period) according to sodium and potassium tertile.
We used log binomial regression models to obtain relative risks and assess whether 1,000 mg increments of dietary sodium and potassium in 1990 were associated with incident decreased eGFR, albuminuria, and decreased eGFR or albuminuria between 1995 and 2015. This analysis was conducted among the individuals who in 1995 did not present with decreased eGFR or albuminuria (i.e. free from CKD in 1995). We presented three models: model 1 was unadjusted; model 2 was adjusted for socio-demographic characteristics (age, sex, race, education, and income); model 3 was additionally adjusted for health and behavioral characteristics (smoking status, physical activity, BMI, diabetes, total cholesterol, systolic BP, and diuretic medication use). As a sensitivity analysis, we repeated these models using tertiles of sodium, tertiles or potassium (as secondary predictors), and also using rapid decline of CKD (defined from eGFRcys) as a secondary outcome.
Finally, we graphed trajectories (or growth curves) of eGFR and ACR from 1995 through 2015 according to values of sodium and potassium in 1990. To do this, we used repeated measures linear mixed models with random intercepts. By using a random intercept, initial eGFR or ACR could vary between individuals. Random slopes were not added as they did not improve model fit. The data structure included year 1995 (our study baseline) and four follow-up time points through 2015. Participants’ eGFR and ACR was treated as a time-dependent outcome, and thus each model estimated eGFR or ACR as a function of time. Time was operationalized as calendar years of the study (from 1995 through 2015). Predictors (sodium and potassium excretion in 1990) were treated as fixed covariates along with baseline age, sex, race, education, and income. Important covariates such as: smoking status, physical activity, BMI, diabetes, cholesterol, systolic BP, diuretic use, and use of antihypertensive medications were time updated to take into account changes overtime. Model fit was assessed using −2 log likelihood tests for nested models and also through inspection of model residuals. Each growth curve was graphed at four different values: three values corresponding to the mean of each tertile (i.e. mean sodium in the low, middle, and high sodium tertile), with the fourth value corresponding to the US Department of Agriculture recommendation threshold (i.e. 2,300 mg/day for sodium and 4,700 mg/day for potassium).31 Given the skewed distribution of ACR, values for ACR were first log transformed to meet linearity assumptions. Model estimated means generated from the ACR models were back transformed to ease interpretation; growth curves from these models reflect model estimates for the geometric means of ACR throughout time. Alpha levels were set to 0.05 or 0.10 for interactions.53 All analyses were conducted using SAS version 9.4 (SAS Institute, Cary, NC).
Analytical Sample
Of the 1,104 individuals who participated in the 24-hour urine sub-study in 1990 (i.e. had a measure of sodium or potassium), we excluded 74 individuals (44 without at least one measure of eGFR or ACR and 30 due to incomplete urine collection), resulting in a final analytical sample size of 1,030. 79% of the analytical sample participated in every study visit. Compared to participants who did not miss a single study visit, those who missed at least one visit were more likely to be black (64% vs. 51%) and have less years of education (13.6 years vs. 14.2 years). However, there were no statistically significant differences by age, sex, income, or more importantly urinary sodium or potassium excretion (our exposures), or the outcomes of interest across these groups.
Acknowledgments
Sources of support: Funding for this study was supported in part by a grant from the American Heart Association (17POST32490000). Dr. Elfassy is currently supported by a grant from NIH/NIMHD (K01MD014158). Funders did not have a role in the study design, analysis, interpretation, writing of the report, or decision to submit the report for publication.
The Coronary Artery Risk Development in Young Adults Study (CARDIA) is supported by contracts HHSN268201300025C, HHSN268201300026C, HHSN268201300027C, HHSN268201300028C, HHSN268201300029C, and HHSN268200900041C from the National Heart, Lung, and Blood Institute and the Intramural Research Program of the National Institute on Aging.
Footnotes
Publisher's Disclaimer: This is a PDF file of an unedited manuscript that has been accepted for publication. As a service to our customers we are providing this early version of the manuscript. The manuscript will undergo copyediting, typesetting, and review of the resulting proof before it is published in its final form. Please note that during the production process errors may be discovered which could affect the content, and all legal disclaimers that apply to the journal pertain.
Contributor Information
Tali Elfassy, Division of Epidemiology, Department of Public Health Sciences, University of Miami.
Lanyu Zhang, Division of Epidemiology, Department of Public Health Sciences, University of Miami.
Leopoldo Raij, Department of Medicine, University of Miami.
Kirstin Bibbins Domingo, Department of Epidemiology and Biostatistics, University of California San Francisco.
Cora E. Lewis, Department of Epidemiology, University of Alabama at Birmingham School of Medicine.
Norrina Bai Allen, Department of Preventive Medicine, Feinberg School of Medicine, Northwestern University.
Kiang J. Liu, Department of Preventive Medicine, Feinberg School of Medicine, Northwestern University.
Carmen A. Peralta, University of California San Francisco.
Michelle C. Odden, Health Research and Policy, department of Epidemiology, Stanford University.
Adina Zeki Al Hazzouri, Department of Epidemiology, Mailman School of Public Health, Columbia University.
References
- 1.Sarnak MJ, Levey AS, Schoolwerth AC, et al. Kidney disease as a risk factor for development of cardiovascular disease: a statement from the American Heart Association Councils on Kidney in Cardiovascular Disease, High Blood Pressure Research, Clinical Cardiology, and Epidemiology and Prevention. Circulation. 2003;108(17):2154–2169. [DOI] [PubMed] [Google Scholar]
- 2.Go AS, Chertow GM, Fan D, McCulloch CE, Hsu CY. Chronic kidney disease and the risks of death, cardiovascular events, and hospitalization. N Engl J Med. 2004;351(13):1296–1305. [DOI] [PubMed] [Google Scholar]
- 3.Coresh J, Selvin E, Stevens LA, et al. PRevalence of chronic kidney disease in the united states. JAMA. 2007;298(17):2038–2047. [DOI] [PubMed] [Google Scholar]
- 4.Khan S, Amedia CA, Jr. Economic burden of chronic kidney disease. Journal of evaluation in clinical practice. 2008;14(3):422–434. [DOI] [PubMed] [Google Scholar]
- 5.Levin A, Hemmelgarn B, Culleton B, et al. Guidelines for the management of chronic kidney disease. CMAJ: Canadian Medical Association Journal. 2008;179(11):1154–1162. [DOI] [PMC free article] [PubMed] [Google Scholar]
- 6.Stevens PE, Levin A. Evaluation and management of chronic kidney disease: synopsis of the kidney disease: improving global outcomes 2012 clinical practice guideline. Ann Intern Med. 2013;158(11):825–830. [DOI] [PubMed] [Google Scholar]
- 7.KDIGO Group. KDIGO Clinical Practice Guideline for the Management of Blood Pressure in Chronic Kidney Disease. Kidney Int. 2012;Suppl 2012(2):337–414. [Google Scholar]
- 8.Clinical practice guidelines for nutrition in chronic renal failure. K/DOQI, National Kidney Foundation. American journal of kidney diseases : the official journal of the National Kidney Foundation. 2000;35(6 Suppl 2):S1–140. [DOI] [PubMed] [Google Scholar]
- 9.James PA OS, Carter BL, Cushman WC, Dennison-Himmelfarb C, et al. 2014 Evidence Based Guideline for the Management of High Blood Pressure in Adults Report From the Panel Members Appointed to the Eighth Joint National Committe (JNC8). JAMA. 2014;311(5):507–520. [DOI] [PubMed] [Google Scholar]
- 10.Verbeke F, Lindley E, Van Bortel L, et al. A European Renal Best Practice (ERBP) position statement on the Kidney Disease: Improving Global Outcomes (KDIGO) clinical practice guideline for the management of blood pressure in non-dialysis-dependent chronic kidney disease: an endorsement with some caveats for real-life application. Nephrology, dialysis, transplantation : official publication of the European Dialysis and Transplant Association - European Renal Association. 2014;29(3):490–496. [DOI] [PubMed] [Google Scholar]
- 11.Thijssen S, Kitzler TM, Levin NW. Salt: its role in chronic kidney disease. Journal of renal nutrition : the official journal of the Council on Renal Nutrition of the National Kidney Foundation. 2008;18(1):18–26. [DOI] [PubMed] [Google Scholar]
- 12.Appel L,. Moore TJ, Obarzanek E, Vollmer WM, Svetkey LP, et al. A Clinical Trial of the Effects of Dietary Patterns on Blood Pressure. NEJM. 1997;336(16):1117–1124. [DOI] [PubMed] [Google Scholar]
- 13.Yoon CY, Noh J, Lee J, et al. High and low sodium intakes are associated with incident chronic kidney disease in patients with normal renal function and hypertension. Kidney Int. 2018;93(4):921–931. [DOI] [PubMed] [Google Scholar]
- 14.Thomas MC, Moran J, Forsblom C, et al. The association between dietary sodium intake, ESRD, and all-cause mortality in patients with type 1 diabetes. Diabetes Care. 2011;34(4):861–866. [DOI] [PMC free article] [PubMed] [Google Scholar]
- 15.Fan L, Tighiouart H, Levey AS, Beck GJ, Sarnak MJ. Urinary sodium excretion and kidney failure in nondiabetic chronic kidney disease. Kidney Int. 2014;86(3):582–588. [DOI] [PMC free article] [PubMed] [Google Scholar]
- 16.McQuarrie EP, Traynor JP, Taylor AH, et al. Association between urinary sodium, creatinine, albumin, and long-term survival in chronic kidney disease. Hypertension (Dallas, Tex : 1979). 2014;64(1):111–117. [DOI] [PubMed] [Google Scholar]
- 17.Vegter S, Perna A, Postma MJ, Navis G, Remuzzi G, Ruggenenti P. Sodium Intake, ACE Inhibition, and Progression to ESRD. Journal of the American Society of Nephrology : JASN. 2012;23(1):165–173. [DOI] [PMC free article] [PubMed] [Google Scholar]
- 18.Han SY, Hong JW, Noh JH, Kim DJ. Association of the estimated 24-h urinary sodium excretion with albuminuria in adult koreans: the 2011 Korea National Health and Nutrition Examination Survey. PLoS One. 2014;9(10):e109073. [DOI] [PMC free article] [PubMed] [Google Scholar]
- 19.Aaron KJ, Campbell RC, Judd SE, Sanders PW, Muntner P. Association of dietary sodium and potassium intakes with albuminuria in normal-weight, overweight, and obese participants in the Reasons for Geographic and Racial Differences in Stroke (REGARDS) Study. The American journal of clinical nutrition. 2011;94(4):1071–1078. [DOI] [PMC free article] [PubMed] [Google Scholar]
- 20.Verhave JC, Hillege HL, Burgerhof JG, et al. Sodium intake affects urinary albumin excretion especially in overweight subjects. Journal of internal medicine. 2004;256(4):324–330. [DOI] [PubMed] [Google Scholar]
- 21.Nagata T, Sobajima H, Ohashi N, et al. Association between 24h Urinary Sodium and Potassium Excretion and Estimated Glomerular Filtration Rate (eGFR) Decline or Death in Patients with Diabetes Mellitus and eGFR More than 30 ml/min/1.73m2. PLoS One. 2016;11(5):e0152306. [DOI] [PMC free article] [PubMed] [Google Scholar]
- 22.Smyth A, Dunkler D, Gao P, et al. The relationship between estimated sodium and potassium excretion and subsequent renal outcomes. Kidney Int. 2014;86(6):1205–1212. [DOI] [PubMed] [Google Scholar]
- 23.He J, Mills KT, Appel LJ, et al. Urinary Sodium and Potassium Excretion and CKD Progression. J Am Soc Nephrol. 2016;27(4):1202–1212. [DOI] [PMC free article] [PubMed] [Google Scholar]
- 24.Elbehary S, Szerlip HM, McCullough PA. Potassium Excretion and Outcomes in CKD: Is K Intake OK? American journal of kidney diseases : the official journal of the National Kidney Foundation. 2017;69(3):325–327. [DOI] [PubMed] [Google Scholar]
- 25.Kieneker LM, Bakker SJ, de Boer RA, Navis GJ, Gansevoort RT, Joosten MM. Low potassium excretion but not high sodium excretion is associated with increased risk of developing chronic kidney disease. Kidney Int. 2016;90(4):888–896. [DOI] [PubMed] [Google Scholar]
- 26.Institute of Medicine (US) Committee on Strategies to Reduce Sodium Intake; Henney JETC, Boon CS, editors. Strategies to Reduce Sodium Intake in the United States. Washington D.C.: National Academies Press (US); 2010. [PubMed] [Google Scholar]
- 27.US Department of Health and Human Services Dietary Guidelines for Americans. In. Vol 7th edition. Washington, D.C.: U.S Government Printing Office; 2010. [Google Scholar]
- 28.Ekinci EI, Clarke S, Thomas MC, et al. Dietary salt intake and mortality in patients with type 2 diabetes. Diabetes Care. 2011;34(3):703–709. [DOI] [PMC free article] [PubMed] [Google Scholar]
- 29.O’Donnell MJ, Yusuf S, Mente A, et al. Urinary sodium and potassium excretion and risk of cardiovascular events. Jama. 2011;306(20):2229–2238. [DOI] [PubMed] [Google Scholar]
- 30.Institutes of Medicine. Strategies to Reduce Sodium Intake in the United States. In. The National Academies Press; 2013. [PubMed] [Google Scholar]
- 31.US Department of Health and Human Services Scientific Report of the 2015 Dietary Guidelines Advisory Committee. In. Washington, D.C.: U.S Government Printing Office; 2015. [Google Scholar]
- 32.Cogswell ME, Loria CM, Terry AL, et al. Estimated 24-Hour Urinary Sodium and Potassium Excretion in US Adults. Jama. 2018;319(12):1209–1220. [DOI] [PMC free article] [PubMed] [Google Scholar]
- 33.Humalda JK, Navis G. Dietary sodium restriction: a neglected therapeutic opportunity in chronic kidney disease. Current opinion in nephrology and hypertension. 2014;23(6):533–540. [DOI] [PMC free article] [PubMed] [Google Scholar]
- 34.Levey AS, Atkins R, Coresh J, et al. Chronic kidney disease as a global public health problem: approaches and initiatives - a position statement from Kidney Disease Improving Global Outcomes. Kidney Int. 2007;72(3):247–259. [DOI] [PubMed] [Google Scholar]
- 35.Lambers Heerspink HJ, Navis G, Ritz E. Salt intake in kidney disease--a missed therapeutic opportunity? Nephrology, dialysis, transplantation : official publication of the European Dialysis and Transplant Association - European Renal Association. 2012;27(9):3435–3442. [DOI] [PubMed] [Google Scholar]
- 36.Krikken JA, Lely AT, Bakker SJ, Navis G. The effect of a shift in sodium intake on renal hemodynamics is determined by body mass index in healthy young men. Kidney Int. 2007;71(3):260–265. [DOI] [PubMed] [Google Scholar]
- 37.Sharma S, McFann K, Chonchol M, de Boer IH, Kendrick J. Association between dietary sodium and potassium intake with chronic kidney disease in US adults: a cross-sectional study. American journal of nephrology. 2013;37(6):526–533. [DOI] [PMC free article] [PubMed] [Google Scholar]
- 38.Castro H, Raij L. Potassium in hypertension and cardiovascular disease. Seminars in nephrology. 2013;33(3):277–289. [DOI] [PubMed] [Google Scholar]
- 39.Lin HB, Young DB, Smith MJ Jr. Stimulation of renin release by hyperkalemia in the nonfiltering kidney. The American journal ofphysiology. 1991; 260(2 Pt 2):F170–176. [DOI] [PubMed] [Google Scholar]
- 40.Vaaraniemi K, Koskela J, Tahvanainen A, et al. Lower glomerular filtration rate is associated with higher systemic vascular resistance in patients without prevalent kidney disease. Journal of clinical hypertension (Greenwich, Conn). 2014;16(10):722–728. [DOI] [PMC free article] [PubMed] [Google Scholar]
- 41.Jin L, Chao L, Chao J. Potassium supplement upregulates the expression of renal kallikrein and bradykinin B2 receptor in SHR. The American journal of physiology. 1999;276(3 Pt 2):F476–484. [DOI] [PubMed] [Google Scholar]
- 42.Loftfield E, Yi S, Curtis CJ, Bartley K, Kansagra SM. Potassium and fruit and vegetable intakes in relation to social determinants and access to produce in New York City. The American journal of clinical nutrition. 2013;98(5):1282–1288. [DOI] [PubMed] [Google Scholar]
- 43.Loftfield E, Yi S, Immerwahr S, Eisenhower D. Construct validity of a single-item, self-rated question of diet quality. Journal of nutrition education and behavior. 2015;47(2):181–187. [DOI] [PubMed] [Google Scholar]
- 44.Campbell KL, Carrero JJ. Diet for the Management of Patients With Chronic Kidney Disease; It Is Not the Quantity, but the Quality That Matters. Journal of renal nutrition : the official journal of the Council on Renal Nutrition of the National Kidney Foundation. 2016;26(5):279–281. [DOI] [PubMed] [Google Scholar]
- 45.Small DM, Coombes JS, Bennett N, Johnson DW, Gobe GC. Oxidative stress, anti-oxidant therapies and chronic kidney disease. Nephrology (Carlton, Vic). 2012;17(4):311–321. [DOI] [PubMed] [Google Scholar]
- 46.Curtis CJ, Clapp J, Niederman SA, Ng SW, Angell SY. US Food Industry Progress During the National Salt Reduction Initiative: 2009–2014. Am JPublic Health. 2016;106(10):1815–1819. [DOI] [PMC free article] [PubMed] [Google Scholar]
- 47.Friedman GD, Cutter GR, Donahue RP, et al. CARDIA: study design, recruitment, and some characteristics of the examined subjects. Journal of clinical epidemiology. 1988;41(n):1105–1116. [DOI] [PubMed] [Google Scholar]
- 48.Angell S, Yi S, Eisenhower D, Kerker BD, Curtis CJ, Bartley K, Silver LD, Farley TA. Sodium Intake in a Cross-Sectional, Representative Sample of New York City Adults. AJPH. 2014; 14(2):2409–2416. [DOI] [PMC free article] [PubMed] [Google Scholar]
- 49.Levey AS, Stevens LA, Schmid CH, et al. A new equation to estimate glomerular filtration rate. Ann Intern Med. 2009;150(9):604–612. [DOI] [PMC free article] [PubMed] [Google Scholar]
- 50.Inker LA, Astor BC, Fox CH, et al. KDOQI US commentary on the 2012 KDIGO clinical practice guideline for the evaluation and management of CKD. American journal of kidney diseases : the official journal of the National Kidney Foundation. 2014;63(5):713–735. [DOI] [PubMed] [Google Scholar]
- 51.Stevens LA, Coresh J, Schmid CH, et al. Estimating GFR using serum cystatin C alone and in combination with serum creatinine: a pooled analysis of 3,418 individuals with CKD. American journal of kidney diseases : the official journal of the National Kidney Foundation. 2008;51(3):395–406. [DOI] [PMC free article] [PubMed] [Google Scholar]
- 52.Peralta CA, Vittinghoff E, Bansal N, et al. Trajectories of Kidney Function Decline in Young Black and White Adults With Preserved GFR: Results From the Coronary Artery Risk Development in Young Adults (CARDIA) Study. American journal of kidney diseases : the official journal of the National Kidney Foundation. 2013;62(2):261–266. [DOI] [PMC free article] [PubMed] [Google Scholar]
- 53.Marshall SW. Power for tests of interaction: effect of raising the Type 1 Error rate. Epidemiol Perspect Innov. 2007;4:4:1–7. [DOI] [PMC free article] [PubMed] [Google Scholar]