

Abstract
The binding pockets of aminergic G protein‐coupled receptors are often targeted by drugs and virtual screening campaigns. In order to find ligands with unprecedented scaffolds for one of the best‐investigated receptors of this subfamily, the β2‐adrenergic receptor, we conducted a docking‐based screen insisting that molecules would address previously untargeted residues in extracellular loop 2. We here report the discovery of ligands with a previously undescribed coumaran‐based scaffold. Furthermore, we provide an analysis of the added value that X‐ray structures in different conformations deliver for such docking screens.
Keywords: beta2-adrenergic receptor ligands, drug design, G protein-coupled receptors, ligand scaffolds, virtual screening
Picking pocket parts: Exploring interactions with a different part of the binding pocket of the β2‐adrenergic receptor than usually targeted yielded antagonists with a novel scaffold. This also showed that new structures and docking studies can yield novel ligands even for well‐described receptors.
Introduction
G protein‐coupled receptors (GPCRs) are involved in a plethora of physiological and pathophysiological processes in the human body and are targeted by approximately one third of currently marketed drugs.1, 2 One of the best‐studied members of this large protein family is the β2‐adrenergic receptor (B2AR), a class A aminergic receptor that regulates smooth muscle relaxation and cardiovascular events, amongst others. Several agonists of this receptor are in clinical use as asthma medication. Antagonists of the B2AR (=beta‐blockers) have widely been used in the treatment of cardiovascular diseases (for a review see3). Recently, the beta‐blocker propranolol has been reported to be effective in the treatment of infantile hemangioma.4 However, concerns about the effects of propranolol on the central nervous system (CNS) in infantile hemangioma patients have been raised.5 Hence the quest for safer drug candidates acting at the B2AR is ongoing, despite its history of more than seven decades as a drug target. Here, we set out to identify novel chemical entities (NCEs) using computational docking and focusing on ligand‐receptor interactions that have so far not been exploited by many ligands. The activity of all compounds was verified in vitro. As we were docking to a structure of the B2AR in an inactive conformation (PDB ID: 3NY9), the expectation was that we would predominantly find antagonists and inverse agonists, that is, beta‐blockers.6, 7
In the wake of the first X‐ray structure of the B2AR,8, 9 several computational docking studies had reported NCEs for this receptor.6, 10, 11, 12 One of the ligands emerging from this screen targeting PDB ID 2RH1 was compound 1,6 which was later crystallized in complex with the B2AR. The corresponding crystal structure (PDB ID: 3NY913) with this novel nanomolar‐affinity inverse agonist showed the accuracy of the docking prediction, demonstrated by a root‐mean‐square deviation (RMSD) of only 0.9 Å.13
The classical pharmacophore for the B2AR, as exemplified by adrenaline, consists of a protonatable amine that interacts with Asp1133.32, a hydroxyl group in β‐position, and an aromatic moiety in 4–5 Å distance from the nitrogen. At the aromatic end, ligands can interact with the serines in helix 5, but this is neither a requirement for affinity nor agonistic efficacy.14 At the same time, ligands interacting with other amino acids in and around the orthosteric binding pocket might stabilize unusual receptor conformations and feature chemical compositions that have not yet been described for B2AR ligands. For instance, interaction with extracellular loop 2 (ECL2), which is in proximity to the orthosteric binding pocket, might lead to such rarely targeted receptor conformations.15
Here, we describe novel ligands with previously unreported structural scaffolds for the B2AR resulting from the docking calculations. These calculations were performed on two conformations of the receptor representing inactive states in complex with two different inverse agonists, that is, in complex with carazolol (PDB ID: 2RH18) and in complex with compound 1,6 respectively. The selection of these structures was based on the hypothesis that antagonists for the B2AR should be enriched in docking calculations to an inactive receptor conformation. A direct comparison of the docking using the 3NY9 structure with our previous docking study using B2AR structure 2RH16 allowed us to evaluate whether such repeated docking screens against only subtly different conformations of the same receptor would reveal different ligand sets, as has previously been shown for fragment screens on other GPCRs.16
The lead‐like subset of ZINC was docked to both crystal structures, 2RH1 and 3NY9, and molecules with novel structural scaffolds were selected after visual inspection of their docking poses, with an eye towards molecules that would interact with ECL2. The selected molecules were then tested in vitro to determine their binding affinities towards the B2AR in human embryonic kidney cells overexpressing a SNAP‐tagged version of the B2AR (=SNAP‐B2AR HEK). Although the overall hit rate was low, we were indeed able to identify 1 (MS008) as a ligand with an unprecedented structural scaffold. This novel scaffold then served as a template for a subsequent similarity search. Five additional hits with comparable affinities (with pK i values ranging from 6.0 to 6.9) as well as six hits with lower affinities were thus identified.
Results
The top‐ranked molecule poses resulting from the docking of the ZINC12 lead‐like subset to the two crystal structures in an inactive conformation (PDB IDs: 3NY9 and 2RH1) were evaluated visually. Only those molecules were selected that contained satisfied polar interactions but no features that remain unpunished due to the known deficiencies in present‐day scoring functions.17 During the selection process, a special focus was directed toward interactions with the ECL2. Based on the interactions that were most frequently observed, the selected molecules were grouped into three categories “no ECL2 interaction”, “interaction with T195 in ECL2”, and “interaction with one of C19145.50‐F19345.52 in ECL2” (numbers in superscript according to the Ballesteros‐Weinstein enumeration scheme18). During selection, a particular focus was put on novel structural scaffolds of the potential ligands, different from the well‐known β‐hydroxyamine. While a variety of possible scaffolds was explored, all of them showed interaction with D1133.32 by either an amine or an amide in their docking pose. Following these criteria, 27 compounds were identified, purchased from their respective vendors, and subjected to in vitro binding assays (Table S5 in the Supporting Information).
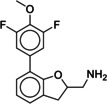
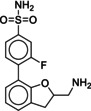
Heterologous competition binding assays were performed on SNAP‐B2AR HEK membranes using the fluorescent ligand Pindolol‐RED (data not shown). Out of the 27 compounds, only one ligand, 1 (MS008), bound with measurable affinity to the B2AR (pK i=7.0±0.1 (mean±SD, n=5)), but featured a previously undescribed coumaran‐based scaffold (2,3‐dihydro‐1‐benzofuran‐2‐ylmethanamine). Such an affinity is within the range of the clinically used ligand isoproterenol, which binds with a pK i of 6.4.19, 20, 21 The molecule pose from the docking calculations suggests that 1 (MS008) interacts with the B2AR at the essential residues D1133.32 and N3127.39 through ionic interactions with its primary amine. The coumaran structure is located in the orthosteric binding pocket and stabilized by hydrophobic interactions with V1143.33. This pose orients the aromatic ring attached to the coumaran towards the extracellular side of the receptor, allowing for a hydrogen bond between T195 in ECL2 and the methoxy group of the ligand (Figure 1). Thus, the pose falls into the “T195 interaction” group.
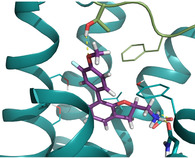
Figure 1.
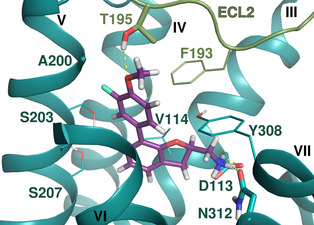
Docked pose of 1 (MS008) in the orthosteric binding pocket of the B2AR as predicted by the docking calculation to the inactive conformation structure 3NY9. The molecule forms hydrogen bonds with residues D1133.32, N3127.39, and T195 in ECL2.
Due to the novelty of 1 (MS008)’s scaffold and a chemical structure that is amenable to synthetic modifications at several positions, we decided to continue with an “analogue by catalogue” search. Compound 1 (MS008) was used as a template to explore a possible structure activity relationship (SAR) between similar NCEs at the B2AR. The set of analogues consisted of 84 molecules and was docked to the inactive conformation structure 3NY9 as 1 (MS008) was originally picked from the docking screen to that structure. Eleven molecules were selected from the resulting docking poses and characterized pharmacologically (Table 1). Each of the selected molecules contained a coumaran scaffold (as 1 (MS008)) connected to a primary amine and an aromatic moiety. Eight of the selected eleven compounds entertained the interaction with T195 in ECL2 in their docking pose.
Table 1.
Assay results of 1 (MS008) and its tested analogues in heterologous competition HTRF binding assays to the B2AR. pK i values were determined in an equilibrium competition binding assay with 50 nM Propranolol‐green. pK i is defined as ‐logK i and values are shown as mean±SD of at least three independent experiments carried out in duplicate. Isoproterenol was used as a literature‐known reference compound.
|
Compound |
Structure |
pKi |
n |
|---|---|---|---|
|
1 (MS008) [a] |
|
7.0±0.1 |
5 |
|
2 [b] |
|
6.9±0.1 |
3 |
|
3 [c] |
|
4.9±0.2 |
3 |
|
4 |
|
6.2±0.2 |
3 |
|
5 |
|
5.6±0.1 |
3 |
|
6 |
|
6.0±0.1 |
3 |
|
7 |
|
5.9±0.2 |
3 |
|
8 |
|
6.8±0.1 |
3 |
|
9 [c] |
|
5.8±0.2 |
3 |
|
10 [c] |
|
5.0±0.3 |
3 |
|
11 |
|
6.1±0.1 |
3 |
|
12 |
|
4.6±0.1 |
3 |
|
Isoproterenol |
|
6.6±0.1 |
4 |


[a] Compound from primary screen that was used for analogue search. [b] Compound showed weak autofluorescence, but was not tested in radioligand binding assay due to its similarity to 1 (MS008) and 8. [c] Compounds showed weak autofluorescence but were not tested in radioligand binding assay due to their low affinities.
The novelty of the coumaran‐based scaffold of compound 1 (MS008) was confirmed by comparing the ligands identified in this study against the B2AR ligands described in ChEMBL.22 For each of the twelve ligands, that is, 1 (MS008) as well as the molecules derived from it, the most similar compounds were determined in the ChEMBL molecule set containing all molecules that were active against the B2AR. The closest match that was found was for 7 and CHEMBL1383731 with an ECFP4 Tanimoto value of 0.35 (Table S3). To cast an even wider net, we evaluated the similarity of 1 (MS008) and its derivatives against the set of all molecules that showed activity against any of the adrenergic receptor subtypes in Homo sapiens. In this search, compound 4 and CHEMBL222798 showed the highest similarity with an ECFP4 Tanimoto value of 0.40 (Table S4). However, neither CHEMBL1383731 nor CHEMBL222798 feature a coumaran scaffold.
Additionally, we conducted a substructure search on the set of active molecules of any adrenergic receptor with three substructures of different sizes, a) coumaran, b) the coumaran‐based scaffold (2,3‐dihydro‐1‐benzofuran‐2‐ylmethanamine) identified in this work and c) the substructure of case (b) with a benzyl attached to the coumaran moiety. Search (a) resulted in nine molecules, two of which are actives for the B2AR, however, with a calculated Tanimoto similarity of 0.14–0.24 to compounds 1–12. Search (b) resulted in the known α2‐adrenergic receptor ligand Efaroxan, which has a Tanimoto similarity of only 0.16–0.19 to compounds 1–12. Search (c) did not yield any molecules.
Pharmacological characterization of 1 (MS008) and its derivatives
To characterize the binding properties of the fluorescent ligand Propranolol‐green, we performed a saturation binding experiment with increasing concentrations of Propranolol‐green and 2 μg SNAP‐B2AR HEK membranes. Specific binding (Figure S1, empty circles) was saturable and of high affinity with an equilibrium dissociation constant (K D) of 48.0±7.4 nM (mean±SD, n=1). Heterologous competition binding assays were performed on SNAP‐B2AR HEK membranes using 50 nM fluorescent ligand Propranolol‐green. Isoproterenol was used as a reference molecule and its pK i of 6.6±0.1 (mean±SD, n=4) in this assay was comparable to the values reported in literature.21 The parent compound 1 (MS008) showed the highest affinity for the B2AR with a pK i value of 7.0±0.1 (mean±SD, n=5), followed by 2 with pK i=6.9±0.1 (mean±SD, n=3) and 8 with pK i=6.8±0.1 (mean±SD, n=3; Figure 2A, • black circles and ▴ black triangles). All other ligands showed lower affinity for the B2AR than 1 (Figure 2A, Table 1). Some molecules (5, 6, 7, 8 and 11) displayed high autofluorescence (data not shown), thereby possibly interfering with the excitation or emission spectra of the fluorescent ligand Propranolol‐green. Hence, we repeated the heterologous binding competition assay using the B2AR antagonist radioligand [3H]DHA to validate the results obtained in the fluorescence binding assay. First, we characterized the binding properties of the radioligand [3H]DHA in a saturation binding experiment with increasing concentrations of [3H]DHA and 5 μg SNAP‐B2AR HEK membranes. The specific binding curve (Figure S1) is saturable and with high affinity with an equilibrium dissociation constant (K D) of 0.3±0.1 nM (mean±SD, n=3). In the heterologous binding competition assay compound 1 (MS008) and isoproterenol were used as reference molecules and the determined pK i values of 7.1±0.1 for 1 (MS008) and 7.0±0.1 for isoproterenol were consistent with the values obtained in the fluorescent ligand binding assay (pK i of 7.0±0.1 for 1 (MS008) and 6.6±0.1 for isoproterenol). As can be seen in Figure 2B and Table 2, the pK i values obtained in the radioligand binding assay for compounds 5, 6, 7, 8 and 11 were comparable to the values determined in the fluorescent ligand binding assay.
Figure 2.
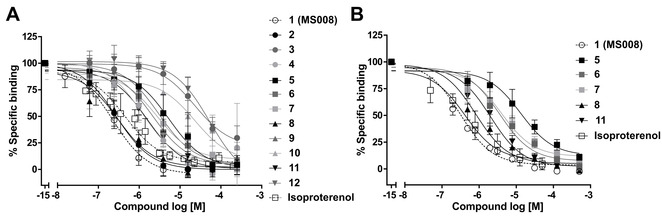
A) Heterologous HTRF competition binding experiments with Propranolol‐green on SNAP‐B2AR HEK membranes. Heterologous competition binding experiments were performed on SNAP‐B2AR HEK membranes in the presence of 50 nM Propranolol‐green and NCEs at the concentrations indicated. Nonspecific binding was determined in the presence of 10 μM ICI 118551. Specific binding in the absence of NCEs was set to 100 %. Isoproterenol was used as reference compound. Data represent the mean±SD from three to five independent experiments carried out in duplicate. B) Heterologous radioligand competition binding experiments with [3H]DHA on SNAP‐B2AR HEK membranes. The binding reaction was carried out in 200 μL containing membranes (5 μg of protein), WGA PVT SPA beads (500 μg), [3H]DHA (final concentration 1 nM), and increasing concentrations of NCEs for 120 min. Nonspecific binding was determined in the presence of 1 μM ICI 118551. Specific binding in the absence of NCEs was set to 100 %. Data represent the mean±SD from three independent experiments carried out in duplicate.
Table 2.
Heterologous competition radioligand binding assay of selected compounds from the analogue search to the B2AR (with [3H]DHA). pK i values were determined in an equilibrium competition binding assay with 1 nM [3H]DHA. pK i is defined as ‐logKi and values are shown as mean±SD of at least three independent experiments carried out in duplicate. 1 (MS008) was used as reference compound.
|
Compound |
pKi |
n |
|---|---|---|
|
1 (MS008) |
7.1±0.1 |
3 |
|
5 |
5.5±0.1 |
4 |
|
6 |
6.1±0.1 |
3 |
|
7 |
6.0±0.1 |
3 |
|
8 |
6.7±0.1 |
3 |
|
11 |
6.3±0.1 |
3 |
|
Isoproterenol |
7.0±0.1 |
3 |
As the next step, a cAMP inhibition assay was performed in order to test for the antagonistic properties of the 12 NCEs identified here on the B2AR. The decrease of cAMP concentration upon addition of 1 (MS008) confirms that it acts as an antagonist (Figure 3A). To determine a pIC50 value of the novel B2AR antagonist 1 (MS008), the concentration‐response curve was plotted (Figure 3B) and the data fitted using nonlinear regression. To compare the potencies of the new B2AR antagonists (2–12), the cAMP inhibition assay was performed and pIC50 values were compared (Figure 4). The well‐known B2AR antagonist ICI 188551 served as a reference and displayed a pIC50 of 8.8±0.1 (mean±SD, n=3). The novel compounds are less potent than this molecule (pIC50 values ranging from 4.4 to 5.1, see Figure 4, Table 3). A similar cAMP inhibition assay was repeated with cells overexpressing the B1AR to confirm that the molecules act on this receptor in the same way as on the B2AR (Figure S2 and Table S2).
Figure 3.
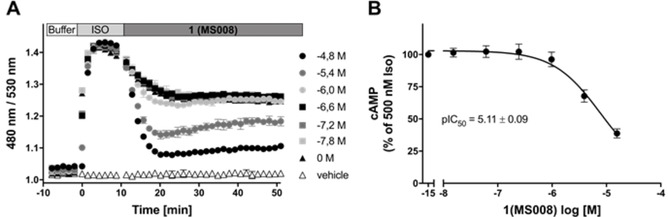
A) Real‐time traces of whole‐cell cAMP inhibition of 1 (MS008) in SNAP‐B2AR‐EPAC HEK cells. SNAP‐B2AR‐EPAC HEK cells were stimulated with 500 nM isoproterenol for 10 min, followed by addition of 1 (MS008) at the concentrations indicated for an additional 40 min. The EPAC FRET ratio (mCerulean/mCitrine) was plotted as a function of time. Data represent mean±SD of one representative out of five individual experiments carried out in duplicate. B) Concentration‐response curve of compound 1’s (MS008) cAMP inhibition in SNAP‐B2AR‐EPAC HEK cells. The EPAC FRET ratio (mCerulean/mCitrine) was normalized to 500 nM isoproterenol without inhibition (=100 %), and the area under the curve (AUC) was plotted as a function of the concentrations of 1 (MS008). Data represent the mean±SD of one representative out of five individual experiments carried out in duplicate.
Figure 4.
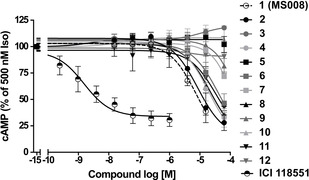
Inhibition of whole‐cell cAMP in SNAP‐B2AR‐EPAC HEK cells by NCEs. SNAP‐B2AR‐EPAC HEK cells were stimulated with 500 nM isoproterenol for 10 min, followed by the addition of NCEs at the concentrations indicated for an additional 40 min. The EPAC FRET ratio (mCerulean/mCitrine) was normalized to 500 nM isoproterenol without inhibition (=100 %), and the area under the curve (AUC) was plotted as a function of NCE concentrations. Data represent the mean±SD for three to five independent experiments carried out in duplicate.
Table 3.
cAMP B2AR inhibition assay. pIC50 values of cAMP inhibition assay performed with the 12 novel B2AR ligands and ICI 118551 as a reference. pIC50 is defined as ‐logIC50, and data represent mean±SD for three to five independent experiments carried out in duplicate.
|
Compound ID |
pIC50 |
n |
|---|---|---|
|
1 (MS008) |
5.1±0.1 |
5 |
|
2 |
5.1±0.1 |
3 |
|
3 |
N.D. |
2 |
|
4 |
4.7±0.1 |
3 |
|
5 |
N.D. |
2 |
|
6 |
4.4±0.1 |
4 |
|
7 |
N.D. |
2 |
|
8 |
4.6±0.1 |
3 |
|
9 |
N.D. |
2 |
|
10 |
N.D. |
2 |
|
11 |
4.5±0.2 |
5 |
|
12 |
N.D. |
2 |
|
ICI 118551 |
8.8±0.1 |
3 |
Overall hit rate
In the primary screen only 1 of 27 molecules showed an unambiguously determinable affinity for the B2AR (hit rate 3.7 %). This low hit rate might be caused by the focus on novel ligand scaffolds which is also manifest when comparing the compounds tested in 20096 as well as the compounds tested here against their respective ChEMBL datasets (see the Supporting Information). All 11 molecules from the similarity search based on 1 (MS008) displayed a measurable affinity at the B2AR (hit rate 100 %). In summary, this results in an overall hit rate of 12 ligands out of 38 tested molecules (32 %).
Comparison with our previous docking to the carazolol‐bound B2AR structure
It is a constant question whether the information inherent in novel X‐ray structures of the same receptor would call for the repetition of a screening campaign, even in cases where the observed structural differences are small. The present study allows us to assess the effects of potentially subtle changes by comparing our findings to the results of an earlier virtual screen we had conducted using the structure of the complex of the B2AR with carazolol (2RH1).6 Comparison of the two crystal structures 3NY9 (used in the present study) and 2RH1 (used in6) based on the RMSD shows that the differences are fairly small with a backbone RMSD of only 0.388, an all‐heavy‐atom RMSD of 0.650 and a binding pocket (residues within 5 Å of carazolol) RMSD of 0.357.
First, we evaluated whether the molecules chosen from the current version of the ZINC database could have been discovered from the database version used in the 2RH1 study. We found that the ZINC7 database contained only two out of the 27 molecules selected in the present study, at ranks 4611, and 40882.
Conversely, would the six ligands identified in ref.6 have been found in the present docking calculation, that is, would they have been ranked sufficiently well? The six molecules were docked to crystal structure 3NY9 to answer this question, using the same parameters as for the screen of the entire ZINC library.
The six compounds would have come in at ranks 345, 19519, 20332, 16928, 426387, 3048263, respectively (Table 4). This means that only the highly potent compound 16 would have been discovered in the present screen.
Table 4.
Comparison of docking results with [6]. The ranks for the six hits and their enantiomers from the docking screen against the carazolol‐bound structure6 were compared with their ranks in the docking setup as used in this study. “Rank 2009” denotes the ranks of the respective molecules in ref. [6], “Rank 2RH1” and “Rank 3NY9” are the ranks that these molecules obtained within the database docked in the present study.
|
No. |
ZINC ID |
Rank 2009 |
Rank 2RH1 |
Rank 3NY9 |
|---|---|---|---|---|
|
1 |
C04008295 |
15 |
182 |
345 |
|
|
C04008294 |
19 |
1948 |
1804 |
|
2 |
C03003177 |
150 |
9560 |
19519 |
|
3 |
C02880812 |
163 |
9881 |
88007 |
|
|
C02880813 |
273 |
1456 |
20332 |
|
4 |
C06703239 |
409 |
16166 |
16928 |
|
5 |
C04123268 |
182 |
12790 |
426387 |
|
6 |
C20589273 |
– |
1443595 |
3048263 |
Discussion
SAR results
The structural similarity of the eleven molecules from the similarity search to 1 (MS008) and the parent molecule allowed us to evaluate the respective impact of these moieties on their binding affinity to the B2AR (see also Table 1). Two main results emerged, which we will discuss in more detail in the following. First, the core structure of a coumaran with an attached primary amine and an aromatic moiety displays high affinity toward the B2AR. Second, the analysis of the respective pK i values and docking poses of the twelve molecules suggests that an interaction with T195 stabilizes the binding mode, thereby resulting in an increased affinity for the B2AR as explained in more detail below.
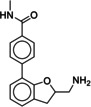
It has to be noted that the molecules from the similarity search mostly differ in the substituents attached to the aromatic moiety attached to the coumaran scaffold. These substituents can be located in ortho, meta or para position relative to the coumaran scaffold. In general, a methoxy or hydroxy group in para position resulted in higher binding affinity to the B2AR for our ligands. According to the docking poses, this might be caused by an interaction of this substituent with residue T195 in ECL2 (1 (MS008), 2, 4, 6, 8; pK i=6.0–7.0). Exchanging the hydroxy group in the para position for an amide group surprisingly does not change the affinity by much (pK i(4)=6.2 vs. pK i(7)=5.9 and pK i(11)=6.1). Based on the docking pose, the carbonyl oxygen interacts via a hydrogen bond with T195 and, therefore, forms the same stabilizing interaction as hydroxy and methoxy groups. It would be interesting to investigate the influence of a further elongation of the amide substituent, maybe even targeting the exosite (at the top of the binding pocket where salmeterol reaches).23 This might constitute a way to introduce selectivity against the B1AR by targeting this more dissimilar region of the two receptors.
In general, the interaction of our NCEs with T195 seems to have an important effect on affinity (e. g., 1 (MS008), 6, 11), since a loss of binding affinity is observed in compounds that lack this interaction (e. g., 5, 3). However, this lack of binding affinity based on a lack of T195 interaction could be partially compensated by, for example, an interaction with N2936.55, resulting in lower binding affinities (with pK i values ranging from 4.6–5.7) for, for example, 5 and 10 than the one observed for the compound interacting with T195 (pK i 7.0 for 1 (MS008)).
Furthermore, a fluorine substituent in meta position seems to have a positive effect on ligand binding affinity (pK i(4)=6.2 vs. pK i(8)=6.8). This positive effect is consistent with an interaction of the slightly negatively polarized fluorine with the slightly positively polarized α‐carbon of A2005.39.24 The addition of a second fluorine in meta position does not affect the binding affinity for the B2AR, however, which suggests that another fluorine substituent in this position cannot interact with a matching residue in the binding pocket (pK i(1 (MS008))=7.0 vs. pK i(2)=6.9).
A fluorine substituent on the coumaran moiety does not seem to have an influence on affinity. Yet, this substituent is pointing towards S2035.42, S2045.43 and S2075.46 in helix V and might be exchanged against, for example, a hydroxy group. As these residues are deeply involved in receptor activation, an interaction with one of them could potentially not only increase binding affinity but also result in agonistic effects elicited by such a compound (6).
Compound 12 shows the lowest affinity for the B2AR (pK i(12)=4.6) which is probably caused by the bulkier substituents attached to the aromatic moiety as well as less favorable interactions of the hydroxy groups with the protein due to unfavorable angles caused by the longer substituent chain.
Comparison with the previous docking to the carazolol‐bound B2AR structure
A comparison of the current docking study to the docking performed with the carazolol‐bound structure in 20096 leads us to two observations. First, and entirely not surprising, commercial libraries are growing and might feature new ligands even for well‐investigated targets. Our study emphasized that there are still novel ligands for the B2AR to be discovered, despite many years of drug research and design with this receptor. Second, with one exception, the ligands of each of the two screens would not have been discovered from the respective other screen. This strongly suggests that new receptor crystal structures add diversity to the docking process, even if the novel structures differ only slightly from previous structures. Hence, exhausting the available structural information, repeating calculations upon the availability of new information, and/or deliberately generating slightly different conformations of a receptor through homology modelling17 presents itself as a powerful strategy to maximize ligand yields.
Conclusion
The goal of this study was to identify novel antagonists for the B2AR based on docking calculations to two crystal structures of the B2AR in an inactive conformation (PDB IDs: 3NY9 and 2RH1). A special focus was directed towards the discovery of unprecedented ligand scaffolds for the B2AR.
Given the additional constraint imposed by the goal of finding novel ligand scaffolds, we anticipated a rather low hit rate, even for such a well‐described target as the B2AR. Indeed, the hit rate of 3.7 % of the fluorescence‐based first screen was consistent with these expectations. However, the discovery of the novel coumaran‐based scaffold (2,3‐dihydro‐1‐benzofuran‐2‐ylmethanamine) shows that it is still possible to find ligands with scaffolds unprecedented for the B2AR. Based on this novel scaffold, we searched for analogues by a combination of similarity‐ and structure‐based methods and tested all of them in a binding assay. This analogue search was very successful with the entire set of eleven molecules showing affinity for the B2AR. This not only shows that the coumaran‐based scaffold itself represents a highly adaptable basis for novel B2AR ligands, but also demonstrates that docking effectively discriminated ligands from non‐binders.
Because all docking calculations were based on crystal structures of the B2AR in an inactive conformation, it was expected that the novel ligands would all act as antagonists, an assumption that was confirmed by functional assays (Figure 4).
Furthermore, the results were compared with the ones of a previous docking study.6 This showed that, firstly, the ever‐growing libraries of small molecules available from various vendors still contain ligands with novel scaffolds even in well‐explored regions of chemical space, and secondly, that new receptor crystal structures add information to conformational space, even if differences to previous structures seem to be small.
Experimental Section
Docking. Two crystal structures in an inactive conformation (PDB IDs 3NY9 and 2RH1) were prepared for docking by addition of missing residues, protonation and minimization with CHARMm and the CHARMm22 force field.25 The ZINC1226 lead‐like subset containing 3,687,621 molecules was then docked to both structures using DOCK3.6.27, 28, 29, 30, 31 Molecules were chosen based on the resulting ranking lists by visual inspection of the molecule poses of the top 500 ranked molecules. Further diversity within the picked molecules was achieved by a dual reranking of the dockings based on a comparison of the ranking lists according to Equation 1 of ref. [32]. This way, compounds ranking favorably in both conformations were prioritized. Furthermore, distance filters to several residues in the ECL2 (within 2.6 Å of F19345.52 (backbone), D19245.51 (sidechain), C19145.50 (backbone) and T195 (sidechain); individually and in combination) were used for a specific search of molecules interacting with ECL2 residues in their docking pose. The selected molecules were grouped into “no ECL2 interaction”, “interaction with T195” and “interaction with one of C19145.50‐F19345.52”, to allow further evaluations based on interactions with ECL2. Furthermore, a variety of scaffolds was explored to allow the discovery of new structural scaffolds binding to the B2AR aside from β‐hydroxyamines. The interaction of the molecules with D1133.32 either by an amine or an amide was essential for the selected molecules. Using these criteria, a total of 27 molecules was selected to be purchased (Table S5).
Analogue search by catalogue. To explore the SAR of 1 (MS008) further, a Tanimoto search was performed on the ZINC1533 lead‐like subset containing 5,626,190 molecules. The search was based on ECFP4 fingerprints and a Tanimoto similarity cutoff of 0.5. To avoid compatibility problems between ZINC15 and DOCK3.6, the molecules were retrieved from ZINC12. The resulting set of molecules was docked to the structure 3NY9 using DOCK3.6 and molecule poses were visually inspected (see Table S1 for SMILES of selected compounds).
Calculation of RMSDs between crystal structures. In order to quantify the structural similarity between the two crystal structures used in the docking calculations, 2RH1 and 3NY9, RMSDs were calculated. The structures were used as prepared for the docking calculations (without hydrogen atoms) and adapted to have the same number of residues. They were then aligned in witnotp (Novartis Pharma AG, unpublished) and RMSDs calculated with this program. RMSDs were calculated for all backbone heavy atoms (1112 atoms) and for all heavy atoms including the side chains (2239 atoms). Furthermore, the RMSD value for all heavy atoms of the residues in 5 Å proximity to the crystallized ligand in 2RH1 was calculated.
Cell lines. A HEK293 cell line stably expressing the SNAP‐β2‐adrenergic receptor (referred to as SNAP‐B2AR) was purchased from Cisbio (Codolet, France). The SNAP‐B2AR cell line in a HEK293 background stably expressing the EPAC‐cAMP sensor with mCerulean and mCitrine as FRET pair, further referred to as SNAP‐B2AR‐EPAC, was generated by transfecting a SNAP‐B2AR plasmid into a cell line stably expressing the EPAC‐cAMP sensor34 using Lipofectamine 2000. SNAP‐B2AR‐EPAC clones were selected by cultivating the cells in DMEM containing 10 % FCS, 2 mg/ml G418 and 0.06 mg/ml zeocin in a humidified 5 % CO2 air incubator at 37 °C.
Membrane preparation. For the HTRF binding assay, SNAP‐B2AR cells were labeled with 100 nM SNAP‐Lumi4®‐Tb in HBSS buffer (supplemented with 20 mM HEPES, pH 7.4) for 1 h at 37 °C, 5 % CO2. For the radioligand binding assay, unlabeled SNAP‐B2AR cells were used for the membrane preparation. SNAP‐B2AR cells were grown to confluency in T175 culture flasks, washed once with ice‐cold phosphate‐buffered saline (PBS) and scraped off the tissue culture plate in ice‐cold PBS. After centrifugation at 1200 g for 7.5 min (4 °C), the cell pellet was resuspended in ice‐cold HME buffer (20 mM HEPES, 2 mM MgCl2, 1 mM EDTA, pH 7.4) and subjected to one freeze/thaw cycle with liquid nitrogen. The thawed samples were then further homogenized by sonication using a Branson Sonifier Cell Disruptor B15 (output control=3; duty cycle=30 %; pulsed mode) with 10×5 pulses and membranes were sedimented by centrifugation for 30 min at 20 000 g (4 °C). The supernatant was discarded and cell pellets were resuspended in ice‐cold HME buffer. Membrane emulsions were further homogenized by passing the emulsions several times through a syringe with a diameter of approx. 0.6 μm. The total protein concentration of the membrane preparations was determined with a Pierce BCA Protein Assay Kit (ThermoFisher Scientific) according to the manufacturer's protocol. Membrane samples of 5–10 g/ml were aliquoted, frozen in liquid nitrogen and stored at −80 °C.
Heterologous competition HTRF binding assay. Equilibrium binding with NCEs was carried out in a final volume of 30 μL containing 2 μg membrane proteins, 50 nM Propranolol‐green and the unlabeled NCEs at the concentrations indicated in binding buffer (HBSS buffer supplemented with 20 mM HEPES) in 96‐well PCR plates. Nonspecific binding of 50 nM Propranolol‐green was measured in the presence of 10 μM ICI 118551. The binding reaction was carried out for 120 min at RT under gentle agitation. 25 μL of the incubated reaction mixtures were transferred to white, opaque 384‐well plates for measuring. The FRET signal between SNAP‐Lumi4®‐Tb (620 nm; donor) and Propranolol‐green (520 nm; acceptor) was measured using a PHERAstar FSX from BMG Labtech (Ortenberg, Germany) and a dual emission optic module (337/620/520) for time resolved fluorescence. Samples were excited at 337 nm using 30 laser flashes per well and emission was detected at 520 nm and 620 nm respectively. Signal integration for both emission wavelengths was delayed by 60 μs and lasted for 400 μs. For the competition binding curves of the unlabeled NCEs, the nonspecific binding was subtracted from the total binding to obtain specific binding values. Binding curves were normalized to the maximal response of specific binding. To calculate the K i values the data was fitted by using nonlinear regression in GraphPad Prism 8.
Heterologous competition radioligand binding assay. Equilibrium binding with NCEs was carried out in a final volume of 200 μL containing 5 μg membrane proteins, 500 μg WGA PVT SPA beads, 1 nM [3H]DHA and the unlabeled NCEs at the concentrations indicated in binding buffer (HBSS supplemented with 2 mM HEPES, 0.1 % (w/v) BSA)). Nonspecific binding of 1 nM [3H]DHA was measured in the presence of 1 μM ICI 118551. The binding reaction was carried out for 120 min at RT under gentle agitation and terminated by 10 min centrifugation at 453 g at RT for 10 min. Radioactivity was quantified using single photon counting on a TopCount NXT microplate scintillation and luminescence counter (Packard). In all experiments, total binding did not exceed 10 % of 1 nM [3H]DHA and we assume that the free concentration of [3H]DHA is approximately equal to the added concentration at every time point. For competition binding curves of the unlabeled NCEs, the nonspecific binding was subtracted from the total binding to obtain specific binding values. Binding curves were normalized to the maximal response of specific binding. To calculate the K i values the data was fitted using nonlinear regression in GraphPad Prism.
Real‐time cAMP inhibition assays. To be able to measure the accumulation and degradation of cAMP upon stimulation or inhibition of the B2AR, a cAMP assay was performed as previously described.35, 36 SNAP‐B2AR‐EPAC cells were seeded at a density of 50’000 cells/well in sterile, black 96‐well microplates coated with poly‐l‐lysine and cultured overnight. Cells were incubated in 80 μL HBSS (supplemented with 20 mM HEPES, pH 7.4) in darkness for 15 min prior to stimulation with ligands at the concentrations indicated at RT. Increases in the mCerulean/mCitrine ratio reflecting increasing cAMP levels were measured using a PHERAstar FSX from BMG Labtech (Ortenberg, Germany) upon excitation with 10 flashes (flash lamp) per well at 430 nm. Excitation of the EPAC donor (mCerulean) and emission of EPAC donor and the EPAC acceptor (mCitrine) was performed with a dual emission fluorescence optical module (FI 430 530 480). mCerulean/mCitrine ratios were plotted as a function of time for 40 min post stimulation. IC50 values were calculated from concentration‐response curves with area under the curve (AUC) vs. ligand concentrations plotted in GraphPad Prism 8.
Data analysis. For the competition binding experiments the specific binding values were fitted using the nonlinear regression “One site – Fit Ki” in GraphPad Prism 8 to calculate the K i. For the saturation binding curves the total and nonspecific as well as specific binding were fitted with the “one site total and nonspecific binding” and “one site specific binding” fitting model, respectively, in GraphPad Prism. The K D of the labeled ligands (Propranolol‐green or [3H]DHA) was obtained from the fit of the specific binding curve. For the cAMP inhibition assay the concentration‐response curves with area under the curve (AUC) vs. ligand concentrations were fitted using the nonlinear regression “log(inhibitor) vs. response (three parameters)” in GraphPad Prism to calculate the IC50 values.
Conflict of interest
M.W., F.W., M.Z. and R.S were employees of InterAx Biotech for the duration of this study.
Supporting information
As a service to our authors and readers, this journal provides supporting information supplied by the authors. Such materials are peer reviewed and may be re‐organized for online delivery, but are not copy‐edited or typeset. Technical support issues arising from supporting information (other than missing files) should be addressed to the authors.
Supplementary
Acknowledgements
We wish to thank Jesper Mosolff Mathiesen (University of Copenhagen, Denmark) for providing the EPAC‐HEK293 cell lines and Nadine Dobberstein for excellent technical assistance. P.K. thanks the German Research Foundation DFG for Heisenberg Professorship KO4095/4‐1.
M. M. Scharf, M. Zimmermann, F. Wilhelm, R. Stroe, M. Waldhoer, P. Kolb, ChemMedChem 2020, 15, 882.
Contributor Information
Dr. Maria Waldhoer, Email: waldhoer@interaxbiotech.com.
Prof. Dr. Peter Kolb, Email: peter.kolb@uni-marburg.de.
References
- 1. Hauser A. S., Attwood M. M., Rask-Andersen M., Schiöth H. B., Gloriam D. E., Nat. Rev. Drug Discovery 2017, 16, 829–842. [DOI] [PMC free article] [PubMed] [Google Scholar]
- 2. Salon J. A., Lodowski D. T., Palczewski K., Pharmacol. Rev. 2011, 63, 901–937. [DOI] [PMC free article] [PubMed] [Google Scholar]
- 3. do Vale G. T., Ceron C. S., Gonzaga N. A., Simplicio J. A., Padovan J. C., Curr. Hypertens. Rev. 2019, 15, 22–31. [DOI] [PubMed] [Google Scholar]
- 4. Tsai M.-C., Liu H.-C., Yeung C.-Y., Medicine 2019, 98, e14078. [DOI] [PMC free article] [PubMed] [Google Scholar]
- 5. Thai T., Wang C.-Y., Chang C.-Y., Brown J. D., J. Clin. Med. 2019, 8, 268. [Google Scholar]
- 6. Kolb P., Rosenbaum D. M., Irwin J. J., Fung J. J., Kobilka B. K., Shoichet B. K., Proc. Mont. Acad. Sci. 2009, 106, 6843–6848. [DOI] [PMC free article] [PubMed] [Google Scholar]
- 7. Scharf M. M., Bünemann M., Baker J. G., Kolb P., Mol. Pharmacol. 2019, 96, 851–861. [DOI] [PubMed] [Google Scholar]
- 8. Cherezov V., Rosenbaum D. M., Hanson M. A., Rasmussen S. G. F., Thian F. S., Kobilka T. S., Choi H.-J., Kuhn P., Weis W. I., Kobilka B. K., Stevens R. C., Science 2007, 318, 1258–1265. [DOI] [PMC free article] [PubMed] [Google Scholar]
- 9. Rosenbaum D. M., Cherezov V., Hanson M. A., Rasmussen S. G. F., Thian F. S., Kobilka T. S., Choi H.-J., Yao X.-J., Weis W. I., Stevens R. C., Kobilka B. K., Science 2007, 318, 1266–1273. [DOI] [PubMed] [Google Scholar]
- 10. Sabio M., Jones K., Topiol S., Bioorg. Med. Chem. Lett. 2008, 18, 5391–5395. [DOI] [PubMed] [Google Scholar]
- 11. Kooistra A. J., Vischer H. F., McNaught-Flores D., Leurs R., De Esch I. J. P., De Graaf C., Sci. Rep. 2016, 6, 1–21. [DOI] [PMC free article] [PubMed] [Google Scholar]
- 12. Weiss D. R., Ahn S., Sassano M. F., Kleist A., Zhu X., Strachan R., Roth B. L., Lefkowitz R. J., Shoichet B. K., ACS Chem. Biol. 2013, 8, 1018–1026. [DOI] [PMC free article] [PubMed] [Google Scholar]
- 13. Wacker D., Fenalti G., Brown M. A., Katritch V., Abagyan R., Cherezov V., Stevens R. C., J. Am. Chem. Soc. 2010, 132, 11443–11445. [DOI] [PMC free article] [PubMed] [Google Scholar]
- 14. Pardon E., Betti C., Laeremans T., Chevillard F., Guillemyn K., Kolb P., Ballet S., Steyaert J., Angew. Chem. Int. Ed. 2018, 57, 5292–5295. [DOI] [PubMed] [Google Scholar]
- 15. Warne T., Edwards P. C., Leslie A. G. W., Tate C. G., Structure 2012, 20, 841–849. [DOI] [PMC free article] [PubMed] [Google Scholar]
- 16. Vass M., Schmidt É., Horti F., Keseru G. M., Eur. J. Med. Chem. 2014, 77, 38–46. [DOI] [PubMed] [Google Scholar]
- 17. Kolb P., Phan K., Gao Z. G., Marko A. C., Sali A., Jacobson K. A., PLoS One 2012, 7, e49910. [DOI] [PMC free article] [PubMed] [Google Scholar]
- 18. Ballesteros J. A., Weinstein H., in Recept. Mol. Biol. (Ed.: S. C. Sealfon), Academic Press, San Diego, 1995, pp. 366–428. [Google Scholar]
- 19. Baker J. G., Br. J. Pharmacol. 2005, 144, 317–322. [DOI] [PMC free article] [PubMed] [Google Scholar]
- 20. Martikkala E., Lehmusto M., Lilja M., Rozwandowicz-Jansen A., Lunden J., Tomohiro T., Hänninen P., Petäjä-Repo U., Härmä H., Anal. Biochem. 2009, 392, 103–109. [DOI] [PubMed] [Google Scholar]
- 21. Sato Y., Kurose H., Isogaya M., Nagao T., Eur. J. Pharmacol. 1996, 315, 363–367. [DOI] [PubMed] [Google Scholar]
- 22. Gaulton A., Bellis L. J., Bento A. P., Chambers J., Davies M., Hersey A., Light Y., McGlinchey S., Michalovich D., Al-Lazikani B., Overington J. P., Nucleic Acids Res. 2012, 40, D1100–D1107. [DOI] [PMC free article] [PubMed] [Google Scholar]
- 23. Masureel M., Zou Y., Picard L.-P., van der Westhuizen E., Mahoney J. P., Rodrigues J. P. G. L. M., Mildorf T. J., Dror R. O., Shaw D. E., Bouvier M., Pardon E., Steyaert J., Sunahara R. K., Weis W. I., Zhang C., Kobilka B. K., Nat. Chem. Biol. 2018, 14, 1059–1066. [DOI] [PMC free article] [PubMed] [Google Scholar]
- 24. Kuhn B., Gilberg E., Taylor R., Cole J., Korb O., J. Med. Chem. 2019, 62, 10441–10455. [DOI] [PubMed] [Google Scholar]
- 25. Momany F. A., Rone R., J. Comput. Chem. 1992, 13, 888–900. [Google Scholar]
- 26. Irwin J. J., Sterling T., Mysinger M. M., Bolstad E. S., Coleman R. G., J. Chem. Inf. Model. 2012, 52, 1757–1768. [DOI] [PMC free article] [PubMed] [Google Scholar]
- 27. Kuntz I. D., Meng E. C., Oatley S. J., Langridge R., Ferrin T. E., J. Mol. Biol. 1982, 161, 269–288. [DOI] [PubMed] [Google Scholar]
- 28. Meng E. C., Shoichet B. K., Kuntz I. D., J. Comput. Chem. 1992, 13, 505–524. [Google Scholar]
- 29. Mysinger M. M., Shoichet B. K., J. Chem. Inf. Model. 2010, 50, 1561–1573. [DOI] [PubMed] [Google Scholar]
- 30. Shoichet B. K., Kuntz I. D., Protein Eng. Des. Sel. 1993, 6, 723–732. [DOI] [PubMed] [Google Scholar]
- 31. Shoichet B. K., Leach A. R., Kuntz I. D., Proteins Struct. Funct. Genet. 1999, 34, 4–16. [DOI] [PubMed] [Google Scholar]
- 32. Schmidt D., Bernat V., Brox R., Tschammer N., Kolb P., ACS Chem. Biol. 2015, 10, 715–724. [DOI] [PubMed] [Google Scholar]
- 33. Sterling T., Irwin J. J., J. Chem. Inf. Model. 2015, 55, 2324–2337. [DOI] [PMC free article] [PubMed] [Google Scholar]
- 34. Mathiesen J. M., Vedel L., Bräuner-Osborne H., Methods Enzymol. 2013, 522, 191–207. [DOI] [PubMed] [Google Scholar]
- 35. Roed S. N., Wismann P., Underwood C. R., Kulahin N., Iversen H., Cappelen K. A., Schäffer L., Lehtonen J., Hecksher-Soerensen J., Secher A., Mathiesen J. M., Bräuner-Osborne H., Whistler J. L., Knudsen S. M., Waldhoer M., Mol. Cell. Endocrinol. 2014, 382, 938–949. [DOI] [PubMed] [Google Scholar]
- 36. Vedel L., Bräuner-Osborne H., Mathiesen J. M., J. Biomol. Screen. 2015, 20, 849–857. [DOI] [PubMed] [Google Scholar]
Associated Data
This section collects any data citations, data availability statements, or supplementary materials included in this article.
Supplementary Materials
As a service to our authors and readers, this journal provides supporting information supplied by the authors. Such materials are peer reviewed and may be re‐organized for online delivery, but are not copy‐edited or typeset. Technical support issues arising from supporting information (other than missing files) should be addressed to the authors.
Supplementary