

Abstract
Aim
To assess the efficacy and tolerability of tirzepatide treatment using three different dose‐escalation regimens in patients with type 2 diabetes.
Materials and Methods
In this double‐blind, placebo‐controlled study, patients were randomized (1:1:1:1) to receive either once‐weekly subcutaneous tirzepatide or placebo. The tirzepatide dose groups and dose‐escalation regimens were: 12 mg (4 mg weeks 0–3; 8 mg weeks 4–7; 12 mg weeks 8–11), 15 mg‐1 (2.5 mg weeks 0–1; 5 mg weeks 2–3; 10 mg weeks 4–7; 15 mg weeks 8–11) and 15 mg‐2 (2.5 mg weeks 0–3; 7.5 mg weeks 4–7; 15 mg weeks 8–11). The primary objective was to compare tirzepatide with placebo in HbA1c change from baseline at 12 weeks.
Results
Overall, 111 patients were randomized: placebo, 26; tirzepatide 12 mg, 29; tirzepatide 15 mg‐1, 28; tirzepatide 15 mg‐2, 28. The mean age was 57.4 years, HbA1c 8.4% and body mass index 31.9 kg/m2. At week 12, absolute HbA1c change from baseline (SE) was greater in the tirzepatide treatment groups compared with placebo (placebo, +0.2% [0.21]; 12 mg, −1.7% [0.19]; 15 mg‐1, −2.0% [0.20]; 15 mg‐2, −1.8% [0.19]). The incidence of nausea was: placebo, 7.7%; 12 mg group, 24.1%; 15 mg‐1 group, 39.3%; 15 mg‐2 group, 35.7%. Three patients discontinued the treatment because of adverse events, one from each of the placebo, 12 mg and 15 mg‐1 groups.
Conclusions
Tirzepatide treatment for 12 weeks resulted in clinically significant reductions in HbA1c. This suggests that lower starting doses and smaller dose increments are associated with a more favourable side effect profile.
Keywords: antidiabetic drug, glucagon‐like peptide‐1 analogue, glucose‐dependent insulinotropic peptide, incretin therapy, randomized trial, type 2 diabetes
1. INTRODUCTION
Treatment with glucagon‐like peptide‐1 (GLP‐1) receptor agonists (GLP‐1RAs) addresses multiple pathophysiological abnormalities of type 2 diabetes, providing an important therapeutic option for patients with this disease. GLP‐1 RAs improve glucose‐dependent insulin secretion, reduce glucagon secretion, and decrease the rate of gastric emptying.1, 2, 3 They are also associated with a reduction in appetite with consequent weight loss.1, 2, 3 These agents are associated with dose‐limiting side effects of nausea, vomiting and diarrhoea,4, 5 and efforts have been made to improve efficacy and tolerability by investigating dose‐escalation regimens that allow attainment of higher doses, which are associated with greater efficacy, while limiting side effects. It has been reported that a slow escalation in dose can limit side effects while increasing the therapeutic utility of GLP‐1 RAs.6, 7, 8, 9 In addition to the need to improve the tolerability of GLP‐1RAs, further improvement in their efficacy is of importance because not all patients treated with GLP‐1 RAs reach their glycaemic target and/or body weight reduction goals with currently available agents.10
One emerging approach to improve the efficacy of GLP‐1 RAs is a pharmacological strategy targeting additional pathways implicated in nutrient and energy metabolism, such as glucose‐dependent insulinotropic peptide (GIP).11 GIP is responsible for majority of the postprandial insulinotropic incretin effect in normal individuals12 and has important additional functions that are distinct from GLP‐1. GIP plays an important role in adipose tissue carbohydrate and lipid metabolism by its actions to regulate glucose uptake,13 lipolysis,13, 14 and lipoprotein lipase activity.14 In the brain, GIP appears to activate neurons distinct from GLP‐1, and intracerebroventricular administration of GIP in mice can inhibit food intake in a manner that is additive to GLP‐1.15 GIP agonism, at least in short infusion studies, has not shown gastrointestinal (GI) side effects in humans.16 In fact, GIP receptor activation may have antiemetic effects, as described in a recent patent application.17 Thus, GIP could contribute to the efficacy of GLP‐1 RAs by a complementary metabolic mechanism without worsening GI tolerability, resulting in an improved therapeutic window of the dual agonism compared with selective GLP‐1R agonism. In participants with type 2 diabetes, a multiple‐dose, dose‐escalation study with a pegylated peptide having balanced co‐agonism at both GIP and GLP‐1 receptors showed clinically relevant glucose reduction, with low incidence of GI side effects, supporting that the therapeutic window might be broader than that of a selective GLP‐1 RA.18
Tirzepatide is a dual GIP and GLP‐1RA. Its structure is based on the GIP amino acid sequence and includes a C20 fatty di‐acid moiety, allowing once‐weekly (QW) subcutaneous administration.19 In a previously reported 26‐week phase 2b study in patients with type 2 diabetes that compared tirzepatide with either placebo or the selective GLP‐1RA, dulaglutide, tirzepatide treatment resulted in a dose‐dependent reduction in HbA1c of up to 2.4% and a weight loss of up to 11.3 kg; HbA1c and body weight reductions by tirzepatide treatment (5 through 15 mg) were superior to those of dulaglutide.20 Treatment with 5 and 10 mg of tirzepatide resulted in clinically meaningful improvements in efficacy without increasing GI adverse events (AEs) compared with dulaglutide. Tirzepatide 10 mg dose was attained by starting at a 5 mg dose QW for a 2‐week escalation period and then a 10 mg QW dose for the remaining duration of the study. The 15 mg dose was attained following a 6‐week escalation period, starting at a 5 mg QW for 2 weeks followed by a 10 mg QW dose for 4 weeks. The 15 mg group experienced a higher incidence of GI AEs and a higher rate of treatment discontinuation compared with both the 5 and 10 mg tirzepatide dose groups and dulaglutide ([20] and Figure S1). Because the 15 mg dose has been shown to be more efficacious than lower doses with respect to both glucose and body weight‐lowering, improving its tolerability profile for the treatment of type 2 diabetes may be of considerable clinical value.21 To achieve this goal, an improved dose‐escalation regimen different to the primary phase 2b study20 may improve GI tolerability, adherence, and increase patient acceptance of tirzepatide treatment at higher doses.
This 12‐week, double‐blind, placebo‐controlled, phase 2 study was designed to assess the efficacy and tolerability of higher doses of tirzepatide (12 and 15 mg [two groups]) using three different dose‐escalation regimens. The dose‐escalation regimens evaluated different starting doses and magnitudes of each dose escalation. Tirzepatide treatment doses were escalated over an 8‐week period to a final dose of 12 or 15 mg, which was administered during the remaining 4 weeks of the treatment period. Although the primary objective of the study was to evaluate the effect of tirzepatide on changes in HbA1c at 12 weeks, a key secondary objective was to evaluate the tolerability of tirzepatide within each of the dose‐escalation regimens.
2. MATERIALS AND METHODS
2.1. Study design and participants
This 12‐week, phase 2, randomized, double‐blind, placebo‐controlled study was conducted from 2 November 2017 through April 24, 2018 at 13 sites in the United States. Eligible patients had type 2 diabetes for at least 6 months (HbA1c 7.0%–10.5% [53.0–91.3 mmol/mol] inclusive), inadequately controlled with diet and exercise alone or with stable metformin therapy, and also had a body mass index (BMI) of between 23 and 45 kg/m2. The full inclusion and exclusion criteria are provided in the Supplementary Appendix (see the supporting information).
The study protocol was approved by local ethics committees and was conducted in accordance with the principles of Declaration of Helsinki, Council of International Organizations of Medical Sciences International Ethical Guidelines, and Good Clinical Practice guidelines. All patients provided written informed consent before participation in the study. The study is registered with ClinicalTrials.gov (NCT03311724).
2.2. Randomization
Eligible patients were randomized (1:1:1:1) either to placebo or to one of the three dose‐escalation regimens of tirzepatide.
2.3. Procedures
During the 12‐week treatment period, the dose of tirzepatide was escalated within each group according to one of three dose‐escalation schedules (Figure 1A). The dose‐escalation regimen for the 12 mg group was 4 mg for 4 weeks, followed by 8 mg for 4 weeks, and then 12 mg for the final 4 weeks. The dose‐escalation regimen for the 15 mg‐1 group was 2.5 mg for 2 weeks, followed by 5 mg for 2 weeks, 10 mg for 4 weeks, and then 15 mg for the final 4 weeks. The dose‐escalation regimen for the 15 mg‐2 group was 2.5 mg for 4 weeks, followed by 7.5 mg for 4 weeks, and then 15 mg for the final 4 weeks.
Figure 1.
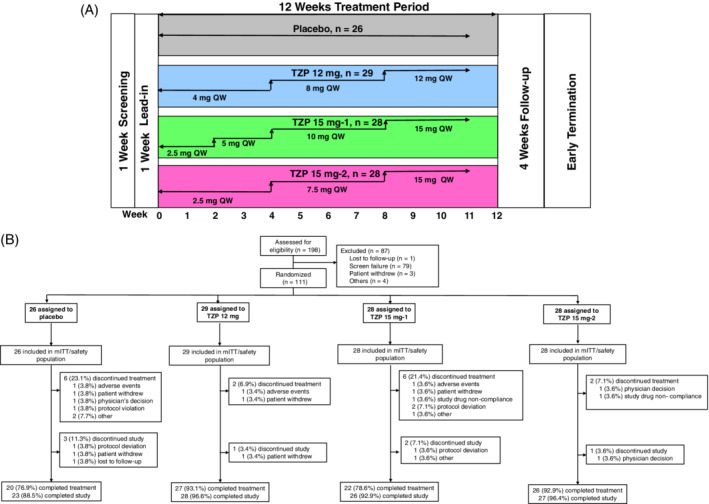
(A) Study design; (B) patient disposition. mITT, modified intent‐to‐treat; QW, once‐weekly; TZP, tirzepatide
2.4. Objectives
The primary objective of the study was to show that at least one tirzepatide treatment group showed superior HbA1c reduction compared with placebo at 12 weeks in patients with type 2 diabetes inadequately controlled with diet and exercise alone or treated with a stable dose of metformin. Secondary efficacy objectives were to compare each dose‐escalation regimen of tirzepatide with placebo for change in mean body weight, fasting blood glucose (FBG) and waist circumference. Secondary safety objectives included treatment‐emergent AEs (TEAEs), serious AEs (SAEs), incidence of nausea, vomiting and diarrhoea, discontinuation of study drug because of AEs, incidence and rate of hypoglycaemia (definitions for all of the above are provided in the Supplementary Appendix). Although AEs were not solicited from the patients, patients were strongly encouraged to record any AEs in their diaries so that differences in tolerability between dose groups could be discerned. In the absence of a site visit during the week after dose escalation, a telephone visit was conducted to remind the patient to record any AEs in their diaries.
2.5. Statistical analysis
All efficacy and safety analyses were performed on the modified intent‐to‐treat (mITT) population, which included all patients who took at least one dose of study medication. The primary analysis for change from baseline in HbA1c was performed using a mixed model for repeated measures. The continuous secondary efficacy variables, including change from baseline in body weight, FBG and waist circumference at 12 weeks treatment, were all analysed using a mixed effect model repeat measurement (MMRM)‐based model.
Key continuous safety measures, including vital signs and electrocardiogram variables, were analysed by a similar MMRM model to the one described above. AEs were collected at every visit, regardless of relationship to study drug. These events were captured as actual terms and coded to Medical Dictionary for Regulatory Activities terms by blinded Lilly clinical personnel. Summaries for both efficacy and safety variables included descriptive statistics for continuous measures (sample size, mean and standard deviation [SD]) and for categorical measures (sample size, frequency and percentages).
3. RESULTS
3.1. Demographics and patient disposition
A total of 198 patients were assessed for eligibility, of whom 111 (mITT dataset) were randomly assigned to one of the four treatment groups: placebo, 26; tirzepatide 12 mg, 29; tirzepatide 15 mg‐1, 28; and tirzepatide 15 mg‐2, 28. Sixteen patients (14.4%) discontinued study drug treatment (Figure 1B), consisting of discontinuations from the placebo group (n = 6, 23.1%) and the tirzepatide treatment groups (12 mg, n = 2, 6.9%; 15 mg‐1, n = 6, 21.4%; and 15 mg‐2, n = 2, 7.1%). Three patients discontinued the study because of AEs (placebo, n = 1; tirzepatide 12 mg, n = 1; tirzepatide 15 mg‐1, n = 1). Baseline demographics and clinical characteristics were similar across all the treatment groups, except for gender distribution in the tirzepatide 15 mg‐2 group (Table 1). The average age, HbA1c, BMI and duration of diagnosed type 2 diabetes were 57.4 years, 8.4% (67.8 mmol/mol), 31.9 kg/m2 and 9.1 years, respectively; 59.5% of patients were males and 86.5% of patients were on metformin.
Table 1.
Baseline characteristics
| Variable | Placebo (N = 26) | TZP 12 mg (N = 29) | TZP 15 mg‐1 (N = 28) | TZP 15 mg‐2 (N = 28) |
|---|---|---|---|---|
| Age (years) | 56.0 ± 10.13 | 61.2 ± 7.56 | 55.5 ± 8.54 | 56.6 ± 9.21 |
| Male, n (%) | 12 (46.2) | 15 (51.7) | 16 (57.1) | 23 (82.1) |
| Diabetes duration (years) | 8.8 ± 6.43 | 10.5 ± 7.90 | 8.2 ± 4.87 | 8.9 ± 6.35 |
| HbA1c (%) | 8.2 ± 1.22 | 8.4 ± 0.90 | 8.5 ± 1.17 | 8.4 ± 1.12 |
| HbA1c (mmol/mol) | 66.4 ± 13.36 | 67.8 ± 9.81 | 69.2 ± 12.80 | 67.8 ± 12.25 |
| FSG (mg/dL) | 168.5 ± 62.06 | 177.9 ± 54.68 | 187.4 ± 72.86 | 194.5 ± 75.96 |
| FSG (mmol/L) | 9.7 ± 3.45 | 9.8 ± 3.04 | 10.4 ± 4.05 | 10.7 ± 4.22 |
| Weight (kg) | 89.6 ± 23.70 | 88.0 ± 17.35 | 88.7 ± 18.21 | 89.6 ± 16.91 |
| BMI (kg/m2) | 32.5 ± 5.70 | 32.0 ± 5.19 | 32.0 ± 5.56 | 31.1 ± 4.21 |
| Waist circumference (cm) | 109.1 ± 15.38 | 107.7 ± 12.23 | 107.0 ± 12.65 | 105.1 ± 12.19 |
|
Metformin use Yes, n (%) |
23 (88.5) | 25 (86.2) | 25 (89.3) | 23 (82.1) |
Abbreviations: BMI, body mass index; FSG, fasting serum glucose; N, total number of patients in that category; n, number of patients; TZP, tirzepatide.All values are presented as mean ± SD unless otherwise noted.
3.2. Efficacy
After 12 weeks of treatment, HbA1c significantly decreased from baseline in the three tirzepatide treatment groups compared with placebo (Figure 2A). The least squares (LS) mean change (95% confidence interval [CI]) versus placebo was −1.9% (−2.5, −1.4), P < 0.001 for the 12 mg group, −2.2% (−2.8, −1.7), P < 0.001 for the 15 mg‐1 group, and − 2.0% (−2.5, −1.4), P < 0.001 for the 15 mg‐2 group. Tirzepatide treatment also reduced the concentration of FBG from baseline to week 12 in all three treatment groups. The FBG change from baseline to week 12 ranged from −12.3 mg/dL (−0.7 mmol/L) for the placebo group to −74.2 mg/dL (−4.1 mmol/L) for the tirzepatide 15 mg‐2 treatment group (Figure 2B). This change was statistically significantly different to baseline values and to the placebo group. The LS mean change (95% CI) versus placebo was −48.5 mg/dL (−70.6, −26.3), P < 0.001 for the 12 mg group, −58.0 mg/dL (−80.7, −35.2), P < 0.001 for the 15 mg‐1 group, and − 61.9 mg/dL (−84.6, −39.2), P < 0.001 for the 15 mg‐2 group.
Figure 2.
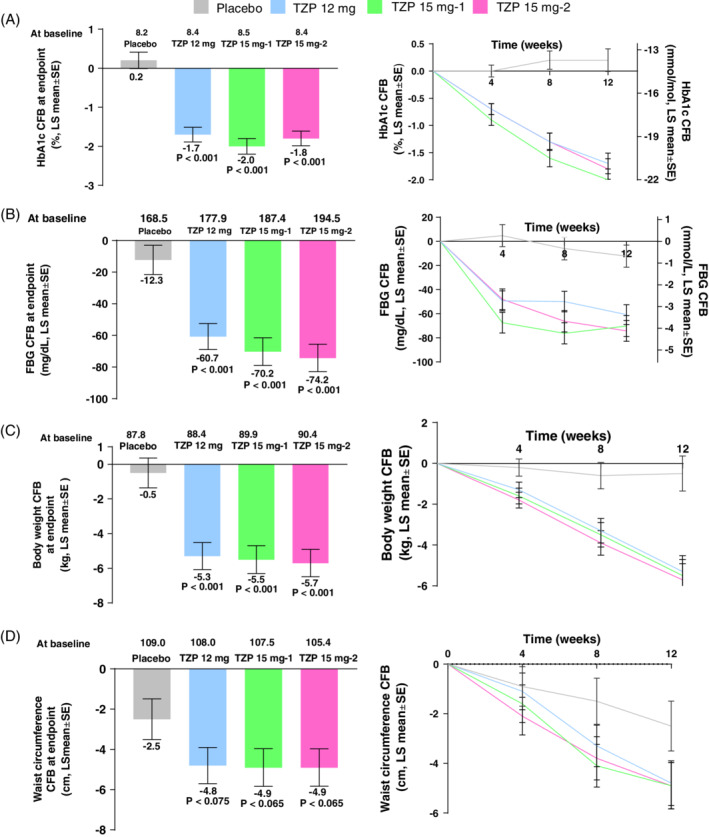
Efficacy outcomes of treatment with tirzepatide at 12 weeks treatment: (A) HbA1c (%); (B) fasting blood glucose (FBG); (C) body weight; (D) waist circumference. CFB, change from baseline; LS, least squares; mITT, modified intent‐to‐treat; MMRM, mixed effect model repeat measurement; SE, standard error; TZP, tirzepatide; mITT population, MMRM on treatment analysis; P‐values versus placebo
At week 12, body weight decreased in each tirzepatide treatment group from baseline (Figure 2C). The reductions ranged from −0.5 kg in the placebo group to −5.7 kg in the tirzepatide 15 mg‐2 treatment group. These reductions were statistically significant, and superior compared with placebo. The LS mean change (95% CI) versus placebo was −4.8 kg (−7.1, −2.6), P < 0.001 for the 12 mg group, −5.0 kg (−7.2, −2.7), P < 0.001 for the 15 mg‐1 group, and − 5.2 kg (−7.5, −2.9), P < 0.001 for the 15 mg‐2 group. Furthermore, tirzepatide treatment decreased waist circumference from baseline to week 12. The reductions ranged from −2.5 cm in the placebo group to −4.9 cm in the 15 mg‐1 and 15 mg‐2 groups (Figure 2D). The LS mean change (95% CI) versus placebo was −2.2 cm (−4.7, 0.2), P = 0.075 for the 12 mg group, −2.4 cm (−4.9, 0.1), P = 0.065 for the 15 mg‐1 group, and − 2.4 cm (−4.9, −0.2), P = 0.065 for the 15 mg‐2 group.
3.3. Safety and tolerability
No deaths occurred during the study. One patient from the tirzepatide 12 mg treatment group reported two SAEs: diarrhoea and high white blood cell count. No patient discontinued the study because of GI AEs. There were two patients from the tirzepatide treatment groups (12 mg and 15 mg‐1) who discontinued the study drug because of a GI‐related AE of diarrhoea.
There was a higher incidence of TEAEs in the tirzepatide treatment groups compared with placebo, mainly because of a higher incidence of GI AEs in the tirzepatide treatment groups. The most frequently reported TEAEs overall (Table 2) were diarrhoea (27.0%), nausea (27.0%), decreased appetite (16.2%), vomiting (14.4%) and headache (13.5%). The incidence of events was similar in each of the tirzepatide treatment groups with the exception of lower rates of nausea in the tirzepatide 12 mg group. The percentages of patients who reported nausea were: placebo, 7.7%; 12 mg group, 24.1%; 15 mg‐1 group, 39.3%; and 15 mg‐2 group, 35.7%. Graphs showing the prevalence and severity of nausea over time for each treatment group are provided in the supporting material (Figure S2).
Table 2.
Summary of treatment‐emergent adverse events (AEs)
| Preferred term | Placebo (N = 26) n (%) | TZP 12 mg (N = 29) n (%) | TZP 15 mg‐1 (N = 28) n (%) | TZP 15 mg‐2 (N = 28) n (%) |
|---|---|---|---|---|
| Deaths | 0 | 0 | 0 | 0 |
| Serious AEs | 0 | 1 (3.4) | 0 | 0 |
| Treatment‐emergent AEs | 13 (50.0) | 23 (79.3) | 19 (67.9) | 24 (85.7) |
| Discontinuations from study because of AEs | 0 | 0 | 0 | 0 |
| Discontinuation of study treatment drug because of AEs | 1 (3.8) | 1 (3.4) | 1 (3.6) | 0 |
| Patients with ≥1 treatment‐emergent AEs | ||||
| Mild | 8 (30.8) | 17 (58.6) | 12 (42.9) | 14 (50.0) |
| Moderate | 5 (19.2) | 6 (20.7) | 7 (25.0) | 9 (32.1) |
| Severe | 0 | 0 | 0 | 1 (3.6) |
| Treatment‐emergent AEs occurring in at least 5% of patients | ||||
| Nausea | 2 (7.7) | 7 (24.1) | 11 (39.3) | 10 (35.7) |
| Diarrhoea | 2 (7.7) | 9 (31.0) | 10 (35.7) | 9 (32.1) |
| Decreased appetite | 0 | 4 (13.8) | 6 (21.4) | 8 (28.6) |
| Vomiting | 1 (3.8) | 5 (17.2) | 5 (17.9) | 5 (17.9) |
| Headache | 2 (7.7) | 2 (6.9) | 6 (21.4) | 5 (17.9) |
| Dyspepsia | 0 | 5 (17.2) | 3 (10.7) | 3 (10.7) |
| Constipation | 0 | 1 (3.4) | 3 (10.7) | 5 (17.9) |
| Abdominal pain | 1 (3.8) | 1 (3.4) | 5 (17.9) | 1 (3.6) |
| Dizziness | 2 (7.7) | 0 | 1 (3.6) | 3 (10.7) |
| Other treatment‐emergent AEs | ||||
| Hypoglycaemia (plasma glucose ≤70 mg/dL) | 0 | 2 (6.9) | 5 (17.9) | 5 (17.9) |
| Hypoglycaemia (plasma glucose ≤54 mg/dL) | 0 | 0 | 0 | 0* |
| Severe hypoglycaemia | 0 | 0 | 0 | 0 |
| Cholecystitis | 0 | 0 | 0 | 0 |
| Acute pancreatitis | 0 | 0 | 0 | 0 |
| Injection site reaction | 0 | 2 (6.9) | 2 (7.1) | 0 |
| Hypersensitivity | 1 (3.8) | 0 | 0 | 0 |
Abbreviations: N, number of subjects in the analysis population; n, number of subjects with AEs; TZP, tirzepatide.
It cannot be ruled out that one patient had a hypoglycaemia event of plasma glucose ≤54 mg/dL because this patient reported hypoglycaemia but did not record a plasma glucose value.
The number of patients with the combined AEs of nausea, vomiting and/or diarrhoea was numerically greater in the tirzepatide 15 mg‐1 treatment group (57.1%) compared with the 12 mg group (48.3%) and the 15 mg‐2 group (46.4%); all of the tirzepatide treatment groups reported more nausea, vomiting and/or diarrhoea than placebo (11.5%). The severity of the nausea, vomiting and/or diarrhoea events was mild to moderate in intensity. None of the nausea, vomiting and/or diarrhoea events were severe.
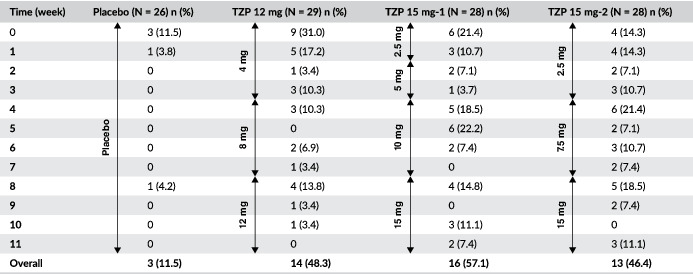
Further evaluation of GI AEs incidence from the first onset data showed that the AEs most probably to occurred following the first dose (4 or 2.5 mg), and the incidence and prevalence may have been reduced with lower starting doses when comparing the incidence of nausea, vomiting and/or diarrhoea in the tirzepatide 4 mg dose (12 mg group) with the 2.5 mg doses (15 mg‐1 and 15 mg‐2 groups) (Table 3). Also, smaller subsequent dose escalations were more probably associated with a lower incidence of the combined nausea, vomiting and/or diarrhoea AEs, as noted when comparing 2.5 mg (15 mg‐1 group) and 4 mg increments (12 mg group) with 5 mg (15 mg‐1 and 15 mg‐2 groups) or 7.5 mg (15 mg‐2 group) increments.
Table 3.
By‐week combined incidence of nausea, vomiting and diarrhoea
|
Abbreviations: N, number of subjects in the analysis population; n, number of patients; TZP, tirzepatide.
The incidence of hypoglycaemic episodes (documented, symptomatic, probable and asymptomatic events) was low across all the tirzepatide treatment groups during the study. There were 12 patients who experienced at least one hypoglycaemic episode (plasma glucose ≤70 mg/dL [3.9 mmol/L]). It cannot be ruled out that one patient in the 15 mg‐2 group had a plasma glucose of <54 mg/dL (3.0 mmol/L) because that patient reported a hypoglycaemia episode but did not report a plasma glucose value (Table 2). There were no reports of severe hypoglycaemia. There were no cases of investigator‐suspected pancreatitis or cholecystitis. No cardiovascular events that required adjudication occurred during the trial. There were no reports of thyroid tumours, neoplasms or C‐cell hyperplasia events. Pulse rate increased for the tirzepatide treatment groups (0.9 to 5.7 beats/min) and decreased in the placebo group (−2.3 beats/min) during the treatment period of the study.
Approximately 26% of patients treated with tirzepatide developed treatment‐emergent antidrug antibodies (TE‐ADAs). Overall titres were low and there were no effects because of the presence of TE‐ADAs on reduction of HbA1c, body weight or drug clearance. There were no hypersensitivity reactions or any other relevant AEs associated with the presence of TE‐ADAs.
4. DISCUSSION
This was a 12‐week phase 2 study designed to evaluate the efficacy, safety and tolerability of three different 8‐week dose‐escalation regimens followed by 4‐week dosing of 12 or 15 mg of the dual GIP and GLP‐1 RA, tirzepatide. The escalation regimens investigated in this study, along with results from the previously published primary phase 2b study,20 which used a shorter dose‐escalation regimen, were designed to support collection of data for selection of therapeutic doses and dose‐escalation steps for investigation within the phase 3 studies of tirzepatide. The escalation regimens were designed to evaluate the differences in efficacy and tolerability between the doses used at the initiation of therapy (2.5 or 4 mg), the differences across different escalation steps (2.5, 4, 5 or 7.5 mg), and the differences between the groups during the entire 12‐week treatment period.
This study, as well as the previously published phase 2b study,20 support that dual agonism may have the potential to significantly affect the type 2 diabetes and obesity pandemic.22 The efficacy data in this study showed efficacy consistent with the primary phase 2b study with comparable reductions in HbA1c and weight loss at the 12‐week time point (Figure S1A,B). This consistency of the data is reassuring and increases the probability that similar results may be observed in the phase 3 studies.
Key to the phase 3 development plan was to determine the optimal dose to balance benefit against potential GI side effects by choosing a dose‐escalation regimen that minimizes side effects and maximizes efficacy. Although the 5 and 10 mg doses of tirzepatide previously showed a comparable GI side effect profile with dulaglutide in the phase 2b study despite no or a short 2‐week dose escalation, there were high rates of treatment discontinuation because of AEs in the 15 mg dose group, and more patients in this group reported GI AEs compared with the other groups (Figure S1C).20 This dose‐escalation study showed that a numerical reduction of GI side effects compared with the 15 mg group of the phase 2b study20 could be achieved in all dose‐escalation regimens by starting at a lower dose and by prolonging the dose‐escalation period to 8 weeks, resulting in treatment discontinuation rates in all tirzepatide treatment groups that were similar or better than placebo. The rate of discontinuations because of AEs was very low and only a few moderate and no severe GI AEs were reported. However, the data suggest that the GI tolerability profile could be further improved. The GI AE data were assessed by numerical comparisons of incidences of nausea, vomiting and diarrhoea using the following approaches: (1) differences between the doses used at the initiation of therapy (2.5 or 4 mg); (2) differences across different escalation steps (2.5, 4, 5 or 7.5 mg); and (3) differences between the two 15 mg groups during the entire 12‐week treatment period (or overall) to support the dose‐escalation regimen being used in the phase 3 tirzepatide programme (SURPASS). The assessment of the by‐week incidence and prevalence of these GI events showed that initiation of tirzepatide treatment with lower doses and using smaller dose‐escalation increments resulted in a lower incidence of nausea, diarrhoea and vomiting.
There were no unexpected safety findings in this study and there were no reports of severe hypoglycaemia. Patients who developed tirzepatide antidrug antibodies had low titres; there was no effect of TE‐ADAs on reduction of HbA1c and body weight or on the incidence of hypersensitivity events. These findings were consistent with the phase 2b study.20
This study has some important limitations. Although the main focus of this trial was to evaluate the tolerability of different tirzepatide dose‐escalation regimens, the study was designed with change in HbA1c as the primary objective. The reason for this was to compare efficacy with the phase 2b study and to avoid reporting bias towards GI side effects. The dose‐escalation period was limited to 8 weeks and up to four dose steps; more gradual dose increases, and a longer dose‐escalation duration, may have resulted in further improvements in the incidence of nausea, vomiting and diarrhoea. Furthermore, the study was not powered to compare small differences in GI frequencies within weeks or at endpoint, so conclusions were made only upon numerical comparisons. Another limitation of the study was that there was a difference in the gender distribution in the 15 mg‐2 group, although there was no indication in this study or in the 26‐week phase 2b study that there was a gender difference in reporting AEs.
In conclusion, 12 weeks of tirzepatide treatment with 12 and 15 mg doses resulted in statistically and clinically significant reductions in HbA1c and body weight that were comparable with those observed in the larger primary phase 2b study in a similar patient population with type 2 diabetes. A gradual dose‐escalation regimen, with smaller dose increments, appeared to result in a more favourable GI side effect profile. These findings have informed the dose‐escalation regimen being used in the tirzepatide phase 3 clinical programme.
CONFLICT OF INTEREST
J.P.F. declares grants from Eli Lilly during the conduct of the study; grants from AbbVie, Akcea, Allergan, AstraZeneca, Boehringer Ingelheim, BMS, Cirius, CymaBay, Enanta, Genentech, Intercept, Janssen, Johnson and Johnson, Lexicon, Ligand, Madrigal, Merck, Mylan, NGM, Novartis, Novo Nordisk, Pfizer, Sanofi and Theracos; advisory board and consulting from Boehringer Ingelheim, Gilead, Johnson and Johnson, Eli Lilly, Merck, Novo Nordisk and Sanofi; and speaker bureau from Merck, Sanofi. M.A.N. has received compensation for lectures or advisory board membership from AstraZeneca, Berlin‐Chemie/Menarini, Medscape, Merck Sharp & Dohme, Novo Nordisk, Sanofi‐Aventis, Takeda and Sun Pharma; and received grant support from Berlin‐Chemie/Menarini, Eli Lilly and Company, Merck Sharp & Dohme and Novo Nordisk. J.V. declares research support from Aptinyx, AstraZeneca, Boehringer Ingelheim, Eli Lilly and Company, Genentech, Lexicon, Melior, Mylan, Novo Nordisk, Regenesis and Sanofi. R.B., X.C., C.B., S.U., Z.M., D.A.R. and A.H. are employees and shareholders of Eli Lilly and Company.
AUTHOR CONTRIBUTIONS
All the authors contributed to the preparation of this manuscript and approved the final version for submission. All authors take responsibility for the accuracy and completeness of data and data analyses. J.P.F. and J.V. were involved in the data collection and interpretation. M.A.N. was involved in data interpretation. R.B. and X.C. were the study statisticians and were involved in data analysis and interpretation. C.B. and S.U. were involved in the study design, analysis and interpretation. D.A.R. was involved in the design of the study, enrolment of patients, data collection, analysis and interpretation. Z.M. and A.H. were involved in the conception of study design, data analysis and interpretation. A.H. and D.A.R. are the guarantors of this work and, as such, had full access to all the data in the study and take responsibility for the integrity of the data and the accuracy of the data analysis.
DATA SHARING
Lilly provides access to all individual participant data collected during the trial, after anonymization, with the exception of pharmacokinetic or genetic data. Data are available to request 6 months after the indication studied has been approved in the United States and European Union, and after primary publication acceptance, whichever is later. No expiration date of data requests is currently set once data are made available. Access is provided after a proposal has been approved by an independent review committee identified for this purpose and after receipt of a signed data‐sharing agreement. Data and documents, including the study protocol, statistical analysis plan, clinical study report, blank or annotated case report forms, will be provided in a secure data‐sharing environment for up to 2 years per proposal. For details on submitting a request, see the instructions provided at www.clinicalstudydatarequest.com.
FUNDING INFORMATION
The study was sponsored by Eli Lilly and Company, Indianapolis.
Supporting information
Appendix S1: Supporting information
ACKNOWLEDGMENTS
The authors would like to thank Nany Gulati, PhD, a full‐time employee of Eli Lilly Services India Pvt. Ltd, for providing writing and editorial support.
The study was sponsored by Eli Lilly and Company, Indianapolis. The sponsor provided the study drugs, planned and performed the statistical analyses, and provided editorial and writing assistance.
Frias JP, Nauck MA, Van J, et al. Efficacy and tolerability of tirzepatide, a dual glucose‐dependent insulinotropic peptide and glucagon‐like peptide‐1 receptor agonist in patients with type 2 diabetes: A 12‐week, randomized, double‐blind, placebo‐controlled study to evaluate different dose‐escalation regimens. Diabetes Obes Metab. 2020;22:938–946. 10.1111/dom.13979
Peer Review The peer review history for this article is available at https://publons.com/publon/10.1111/dom.13979.
Funding information Eli Lilly and Company
REFERENCES
- 1. Drucker DJ, Nauck MA. The incretin system: Glucagon‐like peptide‐1 receptor agonists and dipeptidyl peptidase‐4 inhibitors in type 2 diabetes. Lancet. 2006;368:1696‐1705. [DOI] [PubMed] [Google Scholar]
- 2. Nauck MA, Meier JJ. The incretin effect in healthy individuals and those with type 2 diabetes: Physiology, pathophysiology, and response to therapeutic interventions. Lancet Diabetes Endocrinol. 2016;4:525‐536. [DOI] [PubMed] [Google Scholar]
- 3. Holst JJ. The physiology of glucagon‐like peptide 1. Physiol Rev. 2007;87:1409‐1439. [DOI] [PubMed] [Google Scholar]
- 4. Bettge K, Kahle M, Abd El Aziz MS, Meier JJ, Nauck MA. Occurrence of nausea, vomiting and diarrhoea reported as adverse events in clinical trials studying glucagon‐like peptide‐1 receptor agonists: A systematic analysis of published clinical trials. Diabetes Obes Metab. 2017;19:336‐347. [DOI] [PubMed] [Google Scholar]
- 5. Filippatos TD, Panagiotopoulou TV, Elisaf MS. Adverse effects of GLP‐1 receptor agonists. Rev Diabet Stud. 2014;11:202‐230. [DOI] [PMC free article] [PubMed] [Google Scholar]
- 6. Le Roux CW, Astrup A, Fujioka K, Greenway F, et al. 3 years of liraglutide versus placebo for type 2 diabetes risk reduction and weight management in individuals with prediabetes: a randomised, double‐blind trial. Lancet. 2017;389:1399‐1409. [DOI] [PubMed] [Google Scholar]
- 7. Pi‐Sunyer X, Astrup A, Fujioka K, Greenway F, et al. A randomized, controlled trial of 3.0 mg of liraglutide in weight management. N Engl J Med. 2015;373:11‐22. [DOI] [PubMed] [Google Scholar]
- 8. Davies MJ, Bergenstal R, Bode B, et al. Efficacy of liraglutide for weight loss among patients with type 2 diabetes: the SCALE Diabetes randomized clinical trial. JAMA. 2015;314:687‐699. [DOI] [PubMed] [Google Scholar]
- 9.O'Neil PM, Birkenfeld AL, McGowan B, et al. Efficacy and safety of semaglutide compared with liraglutide and placebo for weight loss in patients with obesity: a randomised, double‐blind, placebo and active controlled, dose‐ranging, phase 2 trial. Lancet. 2018;392(10148):637‐649. [DOI] [PubMed] [Google Scholar]
- 10. Orme ME, Nguyen H, Lu JY, Thomas SA. Comparative effectiveness of glycemic control in patients with type 2 diabetes treated with GLP‐1 receptor agonists: a network meta‐analysis of placebo‐controlled and active‐comparator trials. Diabetes Metab Syndr Obes. 2017;10:111‐122. [DOI] [PMC free article] [PubMed] [Google Scholar]
- 11. Finan B, Müller TD, Clemmensen C, et al. Reappraisal of GIP pharmacology for metabolic diseases. Trends Mol Med. 2016;22:359‐376. [DOI] [PubMed] [Google Scholar]
- 12. Nauck MA, Meier JJ. Incretin hormones: Their role in health and disease. Diabetes Obes Metab. 2018;20(Suppl 1):5‐21. [DOI] [PubMed] [Google Scholar]
- 13. Getty‐Kaushik L, Song DH, Boylan MO, Corkey BE, Wolfe MM. Glucose‐dependent insulinotropic polypeptide modulates adipocyte lipolysis and reesterification. Obesity (Silver Spring). 2006;14:1124‐1131. [DOI] [PubMed] [Google Scholar]
- 14. Kim SJ, Nian C, McIntosh CH. Activation of lipoprotein lipase by glucose‐dependent insulinotropic polypeptide in adipocytes. A role for a protein kinase B, LKB1, and AMP‐activated protein kinase cascade. J Biol Chem. 2007;282:8557‐8567. [DOI] [PubMed] [Google Scholar]
- 15. NamKoong C, Kim MS, Jang BT, Lee YH, Cho YM, Choi HJ. Central administration of GLP‐1 and GIP decreases feeding in mice. Biochem Biophys Res Commun. 2017;490:247‐252. [DOI] [PubMed] [Google Scholar]
- 16. Bergmann NC, Lund A, Gasbjerg LS, et al. Effects of combined GIP and GLP‐1 infusion on energy intake, appetite and energy expenditure in overweight/obese individuals: a randomised, crossover study. Diabetologia. 2019;62:665‐675. [DOI] [PubMed] [Google Scholar]
- 17. Asami T, Nishizawa N, NII‐DA A, et al. Takeda Pharmaceutical Company Limited. GIP receptor activating peptide. WO 2018/181864 A1, 2018.
- 18. Finan B, Ma T, Ottaway N, et al. Unimolecular dual incretins maximize metabolic benefits in rodents, monkeys, and humans. Sci Transl Med. 2013;5:209ra151. [DOI] [PubMed] [Google Scholar]
- 19. Coskun T, Sloop KW, Loghin C, et al. LY3298176, a novel dual GIP and GLP‐1 receptor agonist for the treatment of type 2 diabetes mellitus: From discovery to clinical proof of concept. Mol Metab. 2018;18:3‐14. [DOI] [PMC free article] [PubMed] [Google Scholar]
- 20. Frias JP, Nauck MA, Van J, et al. Efficacy and safety of LY3298176, a novel dual GIP and GLP‐1 receptor agonist, in patients with type 2 diabetes: a randomised, placebo‐controlled and active comparator‐controlled phase 2 trial. Lancet. 2018;392:2180‐2193. [DOI] [PubMed] [Google Scholar]
- 21. Ahlqvist E, Storm P, Käräjämäki A, et al. Novel subgroups of adult‐onset diabetes and their association with outcomes: a data‐driven cluster analysis of six variables. Lancet Diabetes Endocrinol. 2018;6:361‐369. [DOI] [PubMed] [Google Scholar]
- 22. Stumvoll M, Tschöp M. Twice the benefits with twincretins? Lancet. 2018;392:2142‐2144. [DOI] [PubMed] [Google Scholar]
Associated Data
This section collects any data citations, data availability statements, or supplementary materials included in this article.
Supplementary Materials
Appendix S1: Supporting information