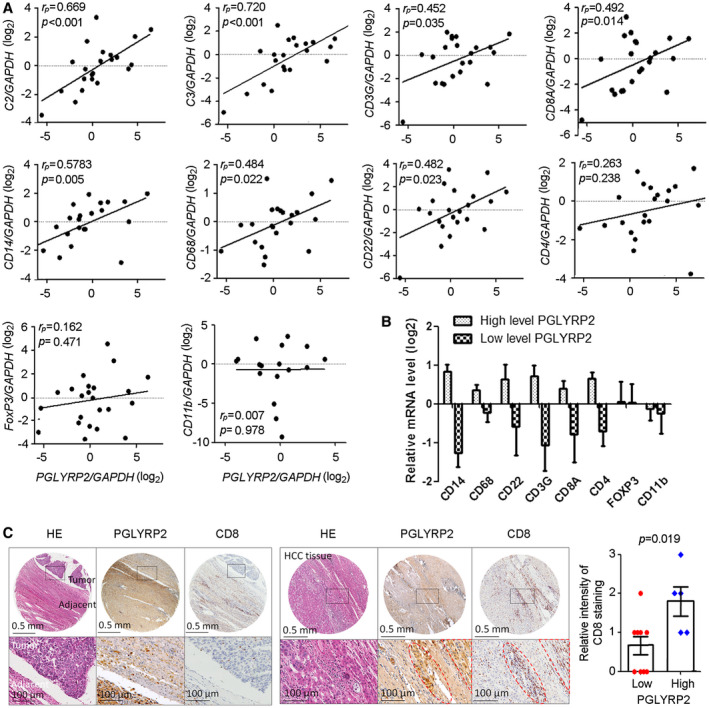
Figure 5.

PGLYRP2 mRNA expression level correlates with activated immune cell infiltration in HCC. (A) PGLYRP2 expression in 22 primary HCC samples was detected using a quantitative RT‐PCR assay. The mRNA levels of several established immune markers were quantified, and their association with PGLYRP2 level was analyzed. The markers included complement components markers C2 and C3, total or cytotoxic T‐cell markers CD3G and CD8A, monocyte/macrophage markers CD14 and CD68, pan‐B‐cell marker CD22, helper T‐cell marker CD4, Treg‐cell marker FoxP3, and MDSC marker CD11b. (B) PGLYRP2 mRNA levels in the real‐time PCR data set were split based on a median value, and the mRNA levels of immune cells were analyzed in the high–PGLYRP2 expression or low–PGLYRP2 expression group. (C) IHC assays showed PGLYRP2 and CD8 protein expression in HCC tissues. Statistical analysis showed the relative intensity of CD8 IHC staining in high–PGLYRP2 expression (++, +++; n = 5) and low–PGLYRP2 expression (−, +; n = 9) HCC tissues. Results are expressed as the mean ± SEM. P > 0.05 indicates that there is no significant difference. Abbreviations: GAPDH, glyceraldehyde phosphate dehydrogenase; HE, hematoxylin and eosin.
