Abstract
Physiological processes rely on initial recognition events between cellular components and other molecules or modalities. Biomolecules can have multiple sites or mode of interaction with other molecular entities, so that a resolution of the individual binding events in terms of spatial localization as well as association and dissociation kinetics is required for a meaningful description. Here we describe a trichromatic fluorescent binding‐ and displacement assay for simultaneous monitoring of three individual binding sites in the important transporter and binding protein human serum albumin. Independent investigations of binding events by X‐ray crystallography and time‐resolved dynamics measurements (switchSENSE technology) confirm the validity of the assay, the localization of binding sites and furthermore reveal conformational changes associated with ligand binding. The described assay system allows for the detailed characterization of albumin‐binding drugs and is therefore well‐suited for prediction of drug‐drug and drug‐food interactions. Moreover, conformational changes, usually associated with binding events, can also be analyzed.
Keywords: multicolor assays, switchSENSE technology, kinetics investigations, drug interactions, albumin binding
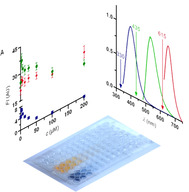
Your true colors: A trichromatic fluorescent binding and displacement assay for simultaneous monitoring and localization of three individual binding sites on HSA was developed using highly specific binding molecules. Whereas localization is confirmed by X‐ray analysis, kinetic data are independently confirmed by switchSENSE technology, revealing important data on conformational changes.
Human serum albumin (HSA) is an abundant plasma protein, which binds and transports hydrophobic endogenous ligands like fatty acids. It also interacts with a wide range of drugs and drug‐like molecules.1 Several X‐ray crystal structures of ligands in complex with HSA revealed seven individual fatty acid (FA) binding sites in this biomolecule.2
Earlier, we addressed the specificity of these HSA binding sites with respect to ligand binding. This led to the identification of a single high affinity fatty acid binding site by introducing and applying the novel molecular probe NDB‐FA.3
Under physiological conditions, an albumin molecule accommodates only 0.1–2 molecules of fatty acids.4 In contrast to standard crystallization conditions using an excess of free fatty acids to stabilize the conformation of the protein, we obtained an X‐ray crystal structure (PDB 6ezq, resolution 2.4 Å) under conditions close to those employed for K D determination for albumin complexes (NBD‐FA : HSA 6 : 1) in our previous study.3
To obtain more insight into the gradual occupancy of binding sites in albumin as well as their relevance to physiology and pharmacokinetics, we then sought to develop a rapid assay system with optical readout. This system should allow the simultaneous monitoring of different albumin binding sites, when interacting with ligands. Therefore, it provides significantly more information for understanding and optimizing these interactions than the current “general albumin binding” assay‐readout.
In addition to the previously reported 7‐nitrobenzo‐2‐oxa‐1,3‐diazole (NBD) labelled fatty acid (NBD‐FA) as molecular probe, more site‐specific fluorescent ligands are then needed as additional probes to selectively label the ibuprofen binding site in the albumin “Sudlow‐site II” and the warfarin binding site (Sudlow‐site I) respectively. These new labels should exhibit only minimal spectral overlap with the existing probe NBD‐FA to allow for selective optical detection and possess a similar binding affinity. Their saturation curve should show a clear plateau region, thus indicating specific binding to the corresponding albumin binding site. Moreover a clear 1 : 1 binding stoichiometry must be revealed by Job‐plots5 (see supplemental).
While such behavior is indicative for specific binding and release, effects like quenching, reorganization or rebinding cannot be ultimately ruled out.
Finally, competition experiments of newly identified molecular probes with known albumin site‐specific binders need to be performed to clearly assign these probes to known albumin binding sites. These new probe molecules should be able to release the known fluorescent ligands in a concentration‐dependent fashion.
Recently, several publications reported syntheses and applications of BODIPY (4,4‐difluoro‐4‐bora‐3a,4a‐diaza‐s‐indacene) dyes exhibiting similar “switch‐on” characteristics upon binding6 as observed for NBD‐FA and other NBD‐labelled ligands.3, 7 BODIPY derivatives cover a wide range of wavelengths of their fluorescence maxima which strongly depend on their chemical substitution patterns. They have been described as polarity‐based fluorescence sensors,6 as sensors for hydrophobic protein surfaces,8 as products of diversity‐oriented library synthesis for unbiased screening9 of hydrophobic protein surfaces or in combination with click‐chemistry.10 Kim et al.11 recently described NIR‐labelling with 8‐amino BODIPY derivatives, further increasing the application range of these dyes.
In several reports,6, 8, 9, 10, 11 the affinity of BODIPY derivatives to bovine serum albumin (BSA) has been described. Er et al.12 have published a mixture of two fluorescent dyes for dual drug site mapping on HSA using a BODIPY derivative selected from a product library as a label for Sudlow‐site II. Competition experiments with ibuprofen proved the identity of the binding site. However, these authors chose dansylamide as the second label which we found to exhibit a 4 : 13 instead of the required 1 : 1 binding stoichiometry, which is also in agreement with results from X‐ray crystallography by Curry13 et al. These studies led us to the design and synthesis12, 14 of a small, directed library of BODIPY derivatives 5 a–c for targeting Sudlow‐site II (Scheme 1, see Supplemental Experimental Procedures).
Scheme 1.
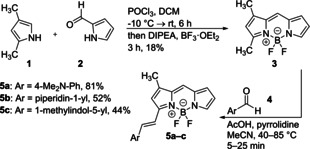
Synthesis of BODIPY derivatives 5 a–c.
First, these compounds were investigated for unbiased HSA binding. Saturation curves were recorded and the respective K D values were determined as described earlier.3
Compounds with suitable fluorescence emission wavelength that showed clear saturation in a 1 : 1 HSA : BODIPY stoichiometry were further investigated in competition experiments with ibuprofen (1). BODIPY derivative 5 a was finally selected as an ibuprofen (1) competitive probe showing the desired 1 : 1 release stoichiometry (Figure 1C).
Figure 1.
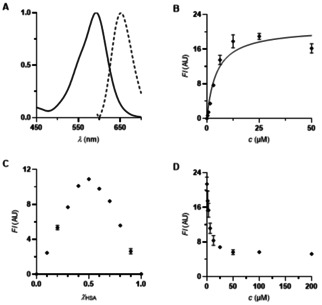
A) Absorption and emission spectra (both normalized) of dimethylamino‐BODIPY 5 a (40 μM ethanol). λ exc=625 nm. B) Titration of dimethylamino‐BODIPY 5 a (0–50 μM) to HSA (12.5 μM) (K D=4.6±0.8 μM. R2=0.9176). λ exc=615 nm. λ em=690 nm. C) Determination of the binding stoichiometry of dimethylamino‐BODIPY 5 a to HSA (12.5 μM, Job plot). λ exc=615 nm. λ em=690 nm. D) Competition experiment of ibuprofen (1) against dimethylamino‐BODIPY 5 a on HSA (12.5 μM each). λ exc=615 nm. λ em=690 nm.
A third fluorescent ligand was required in order to directly label the warfarin binding site (Sudlow‐site I) as well. Again, binding affinity in the same range as for NBD‐FA and 5 a as well as a 1 : 1 binding stoichiometry were the selection criteria for the optimal ligand.
Warfarin (2) itself showed suitable fluorescence intensity but unfortunately shows absorption at the excitation wavelength of dimethylamino‐BODIPY 5 a (Figure S5). Thus, a set of coumarin derivatives 8 a–c was synthesized15 and screened as described for compound 5 a (Scheme 2).The warfarin derivative 8 a fulfilled the aforementioned criteria (Figure 2A–D). Furthermore, its fluorescence emission was substantially different from those of NBD‐FA and BODIPY 5 a, so that the simultaneous selective quantification of all three ligands should be possible in an unprecedented three‐color fluorescent assay.
Scheme 2.
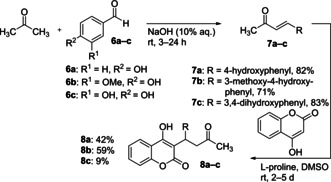
Synthesis of warfarin derivatives 8 a–c.
Figure 2.
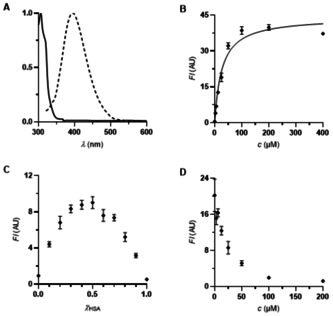
A) Absorption and emission spectra (both normalized) of warfarin derivative 8 a (40 μM ethanol). λ exc=340 nm. B) Titration of warfarin derivative 8 a (0–400 μM) to HSA (25 μM) (K D=26.5±3.0 μM. R2=0.9607). λ exc=330 nm. λ em=384 nm. C) Determination of the binding stoichiometry of warfarin derivative 8 a to HSA (25 μM, Job plot). λ exc=330 nm. λ em=384 nm. D) Competition experiment of iophenoxic acid (3) against warfarin derivative 8 a on HSA (25 μM each). λ exc=330 nm. λ em=384 nm.
Since we have determined the K D values of our probes exclusively by titration experiments, we considered the independent validation of these values with a different method.
To this end, independent characterization of all three ligands has been performed using the switchSENSE technology16 (Dynamic Biosensors, Munich). This fluorescence‐based biosensor allows for the biophysical characterization of biomolecules determining kinetic rate constants of association and dissociation (k ON and k OFF), and the dissociation constant (K D) via fluorescence proximity sensing. Furthermore, switchSENSE enables the user to detect intramolecular conformational changes by determination of the hydrodynamic friction of surface‐bound complexes using a complementary measurement mode (molecular dynamics mode).17
Here, switchSENSE was used for K D determination via kinetic rate constants and via binding equilibrium as well as analyzing conformational changes of HSA upon binding of different compounds (induced fit). For interaction analysis, HSA was immobilized on a gold microelectrode via short, single stranded DNA nanolevers using standard thiol coupling chemistry. The complementary DNA strand, covalently attached to the gold microelectrodes via Au−S bonds, carries a fluorescent dye (oxazine derivative) on the top end for signal detection. For the measurements of HSA with NBD‐FA, dimethylamino‐BODIPY 5 a and warfarin derivative 8 a, K D values in the micromolar range were determined (NBD‐FA: K D=27.5 μM, BODIPY 5 a: K D=5.2 μM, warfarin derivative 8 a: K D=25.5 μM) (Figures S8–11). In the molecular dynamics mode, HSA showed a significant expansion upon NBD‐FA binding. Due to a higher hydrodynamic radius in solution (measured in dynamic response units), the molecular dynamics of HSA slows down (Figure S10). This effect was neither observed for BODIPY 5 a nor for warfarin derivative 8 a (for further details see supplemental).
To check the suitability of the chosen trichromatic dye cocktail for simultaneous detection (for a graphical representation of the fluorescent properties of all three labels, see Figure 3), a mixture of 0.3 equivalents of each label was added to a solution of HSA (25 μM). This stoichiometry does not address differences in K D values, since this setup is used for the localization of binding. For determination of K D, we generally used and propose independent measurements with a single dye. Since the affinity of the used labels is high enough to ensure specific binding we could reduce the equivalents added. We found that 0.3 equivalents of each label delivered the highest assay sensitivity and reduces the possibility of unspecific rebinding.
Figure 3.
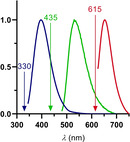
Absorption spectra (normalized) of warfarin derivative 8a (blue), NBD‐FA (green) and dimethylamino‐BODIPY 5a (red). Excitation wavelengths for each dye were drawn.
Gratifyingly, all three labels also behaved well in the chosen combination and in each case permitted the selective competition in the respective binding site. Figures 4–5 show typical displacement experiments. Commercial drugs were added to HSA loaded with the trichromatic cocktail at the concentrations given. The assay was performed in parallel in 96‐well‐microtiter plates, which were analyzed with a fluorescent plate reader preset to the wavelengths characteristic for the three reporter dyes (NBD‐FA: λ exc=435 nm. λ em=535 nm. BODIPY 5 a: λ exc=615 nm. λ em=690 nm. warfarin derivative 8 a: λ exc=330 nm. λ em=384 nm). Ibuprofen (1), ketoprofen (4) and indomethacin (5) selectively displaced dimethylamino‐BODIPY 5 a indicating selective binding to the albumin ibuprofen binding site (Sudlow‐site II) (Figures 4A–C), Indomethacin (5) in addition to 5 a also displaces the warfarin derivative 8 a.18 At high concentrations, both NSAIDs (non‐steroidal anti‐inflammatory drugs) 1 and 4 lead to decreased fluorescence, indicating secondary binding sites.19 Iophenoxic acid (3) is competitive to coumarin derivative 8 a 20 as well as to dimethylamino‐BODIPY 5 a.21
Figure 4.
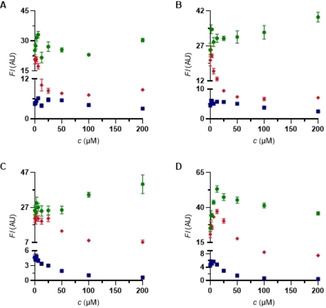
Competition experiments against NBD‐FA/BODIPY 5 a/coumarin 8 a (8 μM each) on HSA. • NBD‐FA. ♦ BODIPY 5 a. ▪ warfarin derivative 8 a. A) ibuprofen (1). B) ketoprofen (4). C) indomethacin (5). D) iophenoxic acid (3).
Figure 5.
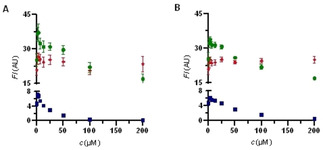
Competition experiments against NBD‐FA/BODIPY 5 a/coumarin 8 a (8 μM each) on HSA. • NBD‐FA. ♦ BODIPY 5 a. ▪ warfarin derivative 8 a. A) sulfasalazine (6). B) balsalazide (7).
For sulfasalazine (6), a marketed drug for the treatment of rheumatoid arthritis, ulcerative colitis, and Crohn′s disease, the fluorescence signal decreases for NBD‐FA and coumarin 8 a,3, 22 which indicates release of the site‐specific probe‐ligands while BODIPY 5 a in (Sudlow‐site II) is not released (Figure 5A). The same behavior is observed for the structurally related drug balsalazide (7) (Figure 5B).3
Thus, NBD‐FA as well as coumarin 8 a are effectively competed by sulfasalazine (6). This interesting observation can be explained by direct competition between ligand and molecular probes in two separate albumin binding sites, by neighboring sites, or by an allosteric binding event. The similar shape of displacement curves for NBD‐FA and warfarin derivative 8 a suggests a simultaneous release of both probes by only a single sulfasalazine (6) molecule rather than binding of two sulfasalazine molecules to these sites. Independent kinetic analysis using switchSENSE technology revealed a K D of 1.31 μM, with a remarkably fast k ON (5.76 10−1 M−1*s−1). As expected, only one binding event could be observed.
A comparable situation was described by F. Yang et al.23 They have observed independent binding of three different compounds (cinnamic acid, lamivudine, indomethacin) within this hydrophobic binding site, while binding is associated with a conformational change of albumin.
To further investigate this interesting binding behavior, we were able to solve an X‐ray crystal structure of sulfasalazine (6) in complex with HSA, obtained by co‐crystallization. The anisotropic crystal diffracted to 2.2 Å in the best and to 2.8 Å in the worst direction. The structure was solved by molecular replacement and the resulting electron density maps were clear. The conformation of HSA is more similar to its fatty‐acid free conformation18d (RMSD 2.5 Å to the PDB structure 1uor) than to the fatty‐acid bound structure2a (RMSD 5.5 Å to the myristate‐bound structure 1e7g). This might be due to our crystallization conditions in the absence of fatty acids. In total, three molecules of sulfasalazine (6) are bound to different HSA binding sites. As expected, one of them is located in the Sudlow‐site I with clear electron density. Two other molecules showing lower occupancy are bound to either HSA domain IIIb or to the interface between domains IIIa and IIIb (see the Supporting Information). These additional interactions might be attributed to high sulfasalazine (6) concentration during crystallization (16 mM 6, 2 mM HSA). K D values for the two additional sites were estimated from the fractional occupancies to be 0.9 mM and 3.4 mM, respectively (see Supporting Information).
Figure 6A shows experimentally determined interactions of sulfasalazine bound to Sudlow‐site I. While its location in this binding site agrees with previous docking studies, the molecule turned out to be flipped by 180°.3 The salicylate carboxylate group is engaged in hydrogen‐bond interactions and a salt‐bridge to Arg257 and Ser287 side chains. The central sulfasalazine aromatic ring is involved in a cation‐π interaction to Arg222. Both attached sulfonamide oxygen atoms interact via bridging water molecules with either Trp214 or Lys199 side chains. The distal pyridine aromatic ring is stacked on top of the indole ring of Trp214 with both nitrogen atoms likely arranged close together (distance 3.2 Å). The indole NH and the pyridine N are interacting with bridging water molecules.
Figure 6.
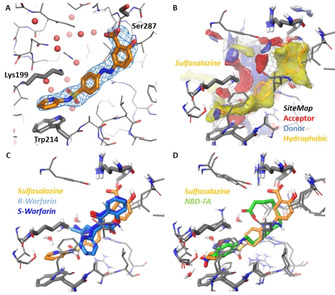
X‐ray crystal structure of HSA in complex with sulfasalazine (6) (PDB ID 6r7s resolution 2.2 Å). A) Binding of sulfasalazine (6) (orange carbon atoms) to Sudlow‐site I plus F o–F c omit map contoured at 3σ. Key amino acids and water oxygen atoms are indicated. B) Binding site analysis of the HSA‐6 complex using SiteMap. Red regions indicate favorable potential H‐bond acceptor interactions; blue regions indicate favorable H‐bond donor interactions and yellow regions indicate favorable hydrophobic interactions. C) Superposition of sulfasalazine (6) with the enantiomers of warfarin (2) from PDB 1ha2 (S‐warfarin, dark‐blue) and 1h9z (R‐warfarin, light‐blue), both at 2.5 Å resolution.24 D) Superposition of sulfasalazine with NBD‐FA (green carbon atoms) from PDB 6ezq3 at 2.5 Å resolution.
The binding site was then analyzed using SiteMap25 (Figure 6B) to identify favorable hydrophobic (yellow), hydrogen‐bond donor (blue) and acceptor interactions (red), which are in agreement to ligand interactions. A comparison with HSA X‐ray crystal structures with (R)‐ or (S)‐warfarin (Figure 6C, PDB 1ha2 for (S)‐warfarin and 1h9z for (R)‐warfarin, both 2.5 Å resolution) shows that the sulfasalazine salicylate and its central aromatic ring occupy parts of the warfarin binding site. This finding explains the competitive binding observed for sulfasalazine (6) and warfarin (2).
A comparison with the HSA‐NBD‐FA complex (Figure 6D) reveals that the pyrimidine ring overlaps with the NBD group, both being stacked on top of the indole ring of Trp214. Also the remaining parts of both ligands overlap, again explaining the strong competition of both ligands for binding to HSA. Although a significant excess of sulfasalazine (6) was used for crystallization (vide supra), the X‐ray crystal structure of its HSA complex revealed the bridging of the fatty acid binding site and Sudlow‐site I by only a single sulfasalazine molecule.
The trichromatic ligand cocktail was then employed for the analysis of the site‐specific binding behaviour of a series of commercial drugs. We also applied it for the analysis of biomolecules which carry albumin‐binding moieties, such as fatty acids. As an example we describe the kinetic analysis of HSA‐binding of two new antidiabetic peptides. Table 1 summarizes the results, while respective titration curves are given in the Supporting Information.
Table 1.
Localization of binding site and determination of K D of fatty acid modified GLP1 agonists.
|
Compound |
Duration of action |
Albumin binding site |
K D [μM][b] |
|---|---|---|---|
|
Liraglutide |
Once daily |
NBD‐FA[a] binding site |
8.9 |
|
Semaglutide |
Once weekly |
NBD‐FA binding site and FA3 |
1.9 |
[a] NBD‐FA: (7‐nitrobenz‐2‐oxa‐1,3‐diazol‐4‐yl)‐C12 fatty acid. [b] K D: dissociation constant.
Interestingly, these binding events were also associated with changes in HSA's hydrodynamic diameter.
The results obtained with the trichromatic assay are in accordance to literature3, 18b, 18c, 19, 20, 22 and to X‐ray crystal structures of HSA‐ligand complexes.18a, 18d, 21 The advantage of the present method over individual analysis of binding sites with only a single fluorescent ligand at a time is the reduction of the number of experiments required as well as of the overall protein consumption. The simultaneous analysis of displacement patterns also permits the rapid characterization of HSA binding behaviour for larger (bio)‐molecules displaying polyvalent binding characteristics.
We propose this general concept for the investigation of further biomolecules containing different binding sites. In the case of HSA, the developed assay system is useful for the initial characterization and differentiation of albumin‐binding drugs and is of potential relevance for the prediction of drug‐drug and drug‐food interactions (in particular involving fatty acids and cholesterol). It can also be used for nanobodies or the newly described small molecule‐based HSA‐binders26 employed to prolong plasma half‐life.
Experimental Section
See the Supporting Information for experimental details, crystallographic data, and further biochemical data.
Conflict of interest
The authors declare no conflict of interest.
Supporting information
As a service to our authors and readers, this journal provides supporting information supplied by the authors. Such materials are peer reviewed and may be re‐organized for online delivery, but are not copy‐edited or typeset. Technical support issues arising from supporting information (other than missing files) should be addressed to the authors.
Supplementary
Acknowledgements
We thank Dr. Michael Kurz (Frankfurt) and Dr. J. Liermann (Mainz) for NMR spectroscopy, Dr. N. Hanold (Mainz, deceased) for mass spectrometry, Dr. Dieter Schollmeyer (Mainz) for X‐ray crystal structure analysis of BODIPY derivative 5 a, Alexander Liesum (Frankfurt) for help with crystallization and mounting of the HSA crystal, Joachim Diez (Frankfurt) for data collection, Petra Loenze (Frankfurt) for help with data processing, and Pia Freisewinkel (Frankfurt) for competition experiments with fatty acid modified GLP1 agonists.
L. Wenskowsky, M. Wagner, J. Reusch, H. Schreuder, H. Matter, T. Opatz, S. M. Petry, ChemMedChem 2020, 15, 738.
Contributor Information
Prof. Dr. Till Opatz, Email: opatz@uni-mainz.de.
Dr. Stefan Matthias Petry, Email: StefanMatthias.Petry@sanofi.com.
References
- 1.
- 1a. Oettl K., Stauber R. E., Br. J. Pharmacol. 2007, 151, 580–590; [DOI] [PMC free article] [PubMed] [Google Scholar]
- 1b. Fehske K. J., Müller W. E., Wollert U., Biochem. Pharmacol. 1981, 30, 687–692; [DOI] [PubMed] [Google Scholar]
- 1c. Spector A. A., Santos E. C., Ashbrook J. D., Fletcher J. E., Ann. N. Y. Acad. Sci. 1973, 226, 247–258; [DOI] [PubMed] [Google Scholar]
- 1d. Spector A. A., J. Lipid Res. 1975, 16, 165–179; [PubMed] [Google Scholar]
- 1e. Fasano M., Curry S., Terreno E., Galliano M., Fanali G., Narciso P., Notari S., Ascenzi P., IUBMB Life 2005, 57, 787–796; [DOI] [PubMed] [Google Scholar]
- 1f. Fanali G., di Masi A., Trezza V., Marino M., Fasano M., Ascenzi P., Mol. Aspects Med. 2012, 33, 209–290. [DOI] [PubMed] [Google Scholar]
- 2.
- 2a. Bhattacharya A. A., Grüne T., Curry S., J. Mol. Biol. 2000, 303, 721–732; [DOI] [PubMed] [Google Scholar]
- 2b. Curry S., Mandelkow H., Brick P., Franks N., Nat. Struct. Biol. 1998, 5, 827–835; [DOI] [PubMed] [Google Scholar]
- 2c. Petitpas I., Grüne T., Bhattacharya A. A., Curry S., J. Mol. Biol. 2001, 314, 955–960; [DOI] [PubMed] [Google Scholar]
- 2d. Curry S., Drug Metab. Pharmacokinet. 2009, 24, 342–357. [DOI] [PubMed] [Google Scholar]
- 3. Wenskowsky L., Schreuder H., Derdau V., Matter H., Volkmar J., Nazaré M., Opatz T., Petry S., Angew. Chem. 2018, 130, 1056–1060. [DOI] [PubMed] [Google Scholar]
- 4.
- 4a. Fredrickson D. S., Gordon R. S., J. Clin. Invest. 1958, 37, 1504–1515; [DOI] [PMC free article] [PubMed] [Google Scholar]
- 4b. T. Peters Jr. , All about albumin: biochemistry, genetics, and medical applications, Academic press, New York, 1995. [Google Scholar]
- 5. Job P., Ann. Chim. Appl. 1928, 9, 113–203. [Google Scholar]
- 6. Sunahara H., Urano Y., Kojima H., Nagano T., J. Am. Chem. Soc. 2007, 129, 5597–5604. [DOI] [PubMed] [Google Scholar]
- 7.
- 7a. Rohacova J., Marin M. L., Miranda M. A., J. Phys. Chem. B 2010, 114, 4710–4716; [DOI] [PubMed] [Google Scholar]
- 7b. Diehl K. L., Ivy M. A., Rabidoux S., Petry S. M., Müller G., Anslyn E. V., Proc. Natl. Acad. Sci. USA 2015, 112, E3977–E3986; [DOI] [PMC free article] [PubMed] [Google Scholar]
- 7c. Chattopadhyay A., Chem. Phys. Lipids 1990, 53, 1–15. [DOI] [PubMed] [Google Scholar]
- 8. Dorh N., Zhu S., Dhungana K. B., Pati R., Luo F.-T., Liu H., Tiwari A., Sci. Rep. 2015, 5, 18337. [DOI] [PMC free article] [PubMed] [Google Scholar]
- 9. KyuáKim H., Chem. Commun. 2011, 47, 2339–2341. [Google Scholar]
- 10. Jameson L. P., Smith N. W., Annunziata O., Dzyuba S. V., Phys. Chem. Chem. Phys. 2016, 18, 14182–14185. [DOI] [PMC free article] [PubMed] [Google Scholar]
- 11. Kim D., Ma D., Kim M., Jung Y., Kim N. H., Lee C., Cho S. W., Park S., Huh Y., Jung J., J. Fluoresc. 2017, 27, 2231–2238. [DOI] [PubMed] [Google Scholar]
- 12. Er J. C., Vendrell M., Tang M. K., Zhai D., Chang Y.-T., ACS Comb. Sci. 2013, 15, 452–457. [DOI] [PubMed] [Google Scholar]
- 13. Ryan A. J., Ghuman J., Zunszain P. A., Chung C.-W., Curry S., J. Struct. Biol. 2011, 174, 84–91. [DOI] [PMC free article] [PubMed] [Google Scholar]
- 14. Lee J.-S., -y Kang N., Kim Y. K., Samanta A., Feng S., Kim H. K., Vendrell M., Park J. H., Chang Y.-T., J. Am. Chem. Soc. 2009, 131, 10077–10082. [DOI] [PubMed] [Google Scholar]
- 15.
- 15a. Chen P.-Y., Wu Y.-H., Hsu M.-H., Wang T.-P., Wang E.-C., Tetrahedron 2013, 69, 653–657; [Google Scholar]
- 15b. Halland N., Hansen T., Jørgensen K. A., Angew. Chem. 2003, 115, 5105–5107. [Google Scholar]
- 16. Cléry A., Sohier T. J., Welte T., Langer A., Allain F. H., Methods 2017, 118, 137–145. [DOI] [PubMed] [Google Scholar]
- 17.
- 17a. Langer A., Hampel P. A., Kaiser W., Knezevic J., Welte T., Villa V., Maruyama M., Svejda M., Jähner S., Fischer F., Nat. Commun. 2013, 4, 2099; [DOI] [PMC free article] [PubMed] [Google Scholar]
- 17b. Langer A., Kaiser W., Svejda M., Schwertler P., Rant U., J. Phys. Chem. B 2014, 118, 597–607. [DOI] [PubMed] [Google Scholar]
- 18.
- 18a. Ghuman J., Zunszain P. A., Petitpas I., Bhattacharya A. A., Otagiri M., Curry S., J. Mol. Biol. 2005, 353, 38–52; [DOI] [PubMed] [Google Scholar]
- 18b. Sudlow G., Birkett D., Wade D., Mol. Pharmacol. 1976, 12, 1052–1061; [PubMed] [Google Scholar]
- 18c. Watanabe H., Tanase S., Nakajou K., Maruyama T., Kragh-Hansen U., Otagiri M., Biochem. J. 2000, 349, 813–819; [DOI] [PMC free article] [PubMed] [Google Scholar]
- 18d. He X. M., Carter D. C., Nature 1992, 358, 209–215. [DOI] [PubMed] [Google Scholar]
- 19.
- 19a. Li F., Zhou D., Guo X., J. Chromatogr. Sci. 2003, 41, 137–141; [DOI] [PubMed] [Google Scholar]
- 19b. Kober A., Sjöholm I., Mol. Pharmacol. 1980, 18, 421–426. [PubMed] [Google Scholar]
- 20. Sudlow G., Birkett D. J., Wade D. N., Clin. Exp. Pharmacol. Physiol. 1975, 2, 129–140. [DOI] [PubMed] [Google Scholar]
- 21. Ryan A. J., -w Chung C., Curry S., BMC Struct. Biol. 2011, 11, 18. [DOI] [PMC free article] [PubMed] [Google Scholar]
- 22. Równicka-Zubik J., Sulkowska A., Pozycka J., Gazdzicka K., Bojko B., Maciazek-Jurczyk M., Sulkowski W., J. Mol. Struct. 2009, 924, 371–377. [Google Scholar]
- 23. Yang F., Yue J., Ma L., Ma Z., Li M., Wu X., Liang H., Mol. Pharmaceutics 2012, 9, 3259–3265. [DOI] [PubMed] [Google Scholar]
- 24. Petitpas I., Bhattacharya A. A., Twine S., East M., Curry S., J. Biol. Chem. 2001, 276, 22804–22809. [DOI] [PubMed] [Google Scholar]
- 25. Halgren T. A., J. Chem. Inf. Model. 2009, 49, 377–389. [DOI] [PubMed] [Google Scholar]
- 26.
- 26a. Bech E. M., Pedersen S. L., Jensen K. J., ACS Med. Chem. Lett. 2018, 9, 577–580; [DOI] [PMC free article] [PubMed] [Google Scholar]
- 26b. Sleep D., Cameron J., Evans L. R., Biochim. Biophys. Acta Gen. Subj. 2013, 1830, 5526–5534; [DOI] [PubMed] [Google Scholar]
- 26c. van Witteloostuijn S. B., Pedersen S. L., Jensen K. J., ChemMedChem 2016, 11, 2474–2495; [DOI] [PubMed] [Google Scholar]
- 26d. Kurtzhals P., Havelund S., Jonassen I., Kiehr B., Larsen U., Ribel U., Markussen J., Biochem. J. 1995, 312, 725–731; [DOI] [PMC free article] [PubMed] [Google Scholar]
- 26e. Kontermann R. E., BioDrugs 2009, 23, 93–109; [DOI] [PubMed] [Google Scholar]
- 26f. Kontermann R. E., Curr. Opin. Biotechnol. 2011, 22, 868–876; [DOI] [PubMed] [Google Scholar]
- 26g. Koehler M. F., Zobel K., Beresini M. H., Caris L. D., Combs D., Paasch B. D., Lazarus R. A., Bioorg. Med. Chem. Lett. 2002, 12, 2883–2886. [DOI] [PubMed] [Google Scholar]
Associated Data
This section collects any data citations, data availability statements, or supplementary materials included in this article.
Supplementary Materials
As a service to our authors and readers, this journal provides supporting information supplied by the authors. Such materials are peer reviewed and may be re‐organized for online delivery, but are not copy‐edited or typeset. Technical support issues arising from supporting information (other than missing files) should be addressed to the authors.
Supplementary


