

Abstract
The activity of many water‐splitting photocatalysts could be improved by the use of RhIII–CrIII mixed oxide (Rh2−xCrxO3) particles as cocatalysts. Although further improvement of water‐splitting activity could be achieved if the size of the Rh2−xCrxO3 particles was decreased further, it is difficult to load ultrafine (<2 nm) Rh2−xCrxO3 particles onto a photocatalyst by using conventional loading methods. In this study, a new loading method was successfully established and was used to load Rh2−xCrxO3 particles with a size of approximately 1.3 nm and a narrow size distribution onto a BaLa4Ti4O15 photocatalyst. The obtained photocatalyst exhibited an apparent quantum yield of 16 %, which is the highest achieved for BaLa4Ti4O15 to date. Thus, the developed loading technique of Rh2−xCrxO3 particles is extremely effective at improving the activity of the water‐splitting photocatalyst BaLa4Ti4O15. This method is expected to be extended to other advanced water‐splitting photocatalysts to achieve higher quantum yields.
Keywords: cocatalysts, metal clusters, nanostructures, photocatalysts, water splitting
Rh2−x Cr x O3 particles with a size of approximately 1.3 nm were loaded onto a BaLa4Ti4O15 photocatalyst. The photocatalyst exhibited the highest quantum yield reported for BaLa4Ti4O15. The developed preparation technique of Rh2−xCrxO3 particles is also expected to improve the activity of other advanced water‐splitting photocatalysts. SG=glutathionate.

Introduction
With increasing the global warming and the depletion of fossil resources, society is expected to shift to using clean and renewable energy instead of fossil fuels. Hydrogen (H2) can be converted to electricity by using a fuel cell and such conversion generates only water as a by‐product. Therefore, the establishment of a system in which H2 is generated from water and solar energy by using a photocatalyst1 is desirable, with the generated H2 used for the generation of electricity from fuel cells (Scheme S1). Once such an energy‐conversion system is established, it will be possible to circulate an energy medium (H2) in addition to obtaining electricity only from solar energy and abundant water resources. However, realization of such an ultimate energy‐conversion system requires further improvement of the reaction efficiency of water splitting as well as fuel cells.
In many cases, the surface of water‐splitting photocatalysts is coated with metal or metal oxide nanoparticles.2, 3, 4, 5, 6, 7, 8, 9, 10, 11, 12, 13, 14, 15, 16, 17, 18, 19, 20, 21, 22 The loaded nanoparticles, called cocatalysts, promote charge separation and act as active sites in the water‐splitting reaction (Scheme 1). Effective strategies to realize highly active photocatalysts include improvement of the semiconductor photocatalyst and the cocatalyst. The activity of the cocatalysts can be enhanced by decreasing the particle diameter and improving the dispersibility.2, 3, 4, 5, 6, 7, 8, 9, 10, 11, 12, 13, 14, 15, 16, 17, 18, 19, 20, 21, 22 Previous studies have shown that the particle size of cocatalysts can be readily controlled in the small particle region when pre‐synthesized nanoparticles/clusters are used as precursors.26, 27, 28, 29, 30 In addition, previous studies have demonstrated that protection of the cocatalyst with a chromium oxide (Cr2O3) film prevents the photoreduction reaction of oxygen (O2) (Scheme 1), which is one of the back reactions of water splitting.31, 32, 33, 34, 35, 36, 37, 38, 39, 40, 41 We previously prepared a water‐splitting photocatalyst with relatively high activity by applying both of the aforementioned techniques to a gold (Au) cocatalyst‐supported BaLa4Ti4O15 photocatalyst (Figure S1).42, 43
Scheme 1.

Schematic of photocatalytic water splitting using a one‐step photoexcitation system (CB, conduction band; VB, valence band; E g, band gap) showing the processes of i) hydrogen evolution, ii) oxygen evolution, and iii) oxygen photoreduction.
However, a volcano plot of H2 adsorption and desorption44 predicted that rhodium (Rh) should show higher activity than Au as a cocatalyst for H2 production. Therefore, it is expected that loading an ultrafine cocatalyst composed of Rh and Cr oxides onto a photocatalyst surface will lead to higher water‐splitting activity. Actually, Maeda and co‐workers45, 46, 47, 48 reported that a photocatalyst loaded with RhIII–CrIII mixed oxide nanoparticles (Rh2−xCrxO3, 10–30 nm) showed higher water‐splitting activity than a photocatalyst loaded with other nanoparticles. The activity of the photocatalyst seemed to increase with the use of finer Rh2−xCrxO3 nanoparticles. However, it is very difficult to load ultrafine (<2 nm) particles onto photocatalysts by using common methods, such as impregnation or photodeposition.45, 46, 47, 48 In addition, it is also difficult to load the small Rh2−xCrxO3 particles onto the photocatalysts by using the loading method developed in the previous studies42, 43 because there are no precise synthesis method for small Rh2−xCrxO3 clusters, which is different from the case with Au clusters.
In this study, we attempted to load small Rh2−xCrxO3 cluster cocatalysts, by using the aggregation of a Rh–thiolate complex, onto the surface of the photocatalysts. As a result, we have succeeded in loading Rh2−xCrxO3 particles with a size of approximately 1.3 nm and a narrow size distribution onto a BaLa4Ti4O15 photocatalyst (Rh2−xCrxO3(1.3 nm)/BaLa4Ti4O15). Scanning transmission electron microscopy coupled with energy‐dispersive X‐ray spectroscopy (STEM‐EDX) and X‐ray absorption fine structure (XAFS) measurements revealed that the loaded particles were an oxide solid solution composed of RhIII and CrIII species. Moreover, Rh2−xCrxO3(1.3 nm)/BaLa4Ti4O15 showed higher water‐splitting activity than that of previously reported BaLa4Ti4O15 loaded with fine (≈1.2 nm) Au‐cocatalyst nanoparticles protected by a Cr2O3 film42, 43 and BaLa4Ti4O15 loaded with ≈3 nm Rh2−xCrxO3 particles (Rh2−xCrxO3(3.0 nm)/BaLa4Ti4O15) prepared via the impregnation method.
Results and Discussion
BaLa4Ti4O15 (Figure S1), which is a most advanced photocatalyst, was used in this work. Rh2−xCrxO3 particles (≈1.3 nm) were loaded onto the BaLa4Ti4O15 surface by the method summarized in Figure 1. Firstly, a Cr2O3 layer was formed on BaLa4Ti4O15 (Figure 1 a) by photodeposition to form Cr2O3/BaLa4Ti4O15 (Figure 1 b).42, 43 Then, a Rh–glutathionate (SG, Figure S2) complex with a molecular size slightly under 1 nm was adsorbed on the surface of Cr2O3/BaLa4Ti4O15 to give Rh–SG/Cr2O3/BaLa4Ti4O15 (Figure 1 c). Next, Rh–SG/Cr2O3/BaLa4Ti4O15 was calcined at 300 °C under reduced pressure to remove the ligands from the Rh–SG complex and form a solid solution of Rh and Cr oxides (Rh2−xCrxOy/BaLa4Ti4O15, Figure 1 d). Finally, a small amount of Cr with a high oxidation state (y>3) was reduced to CrIII by using ultraviolet (UV) light irradiation (Rh2−xCrxO3(1.3 nm)/BaLa4Ti4O15, Figure 1 e).42, 43
Figure 1.

Schematic of the experimental procedure. (a) BaLa4Ti4O15, (b) Cr2O3/BaLa4Ti4O15, (c) Rh–SG/Cr2O3/BaLa4Ti4O15, (d) Rh2−xCrxOy/BaLa4Ti4O15, and (e) Rh2−xCrxO3/BaLa4Ti4O15. Rh2−xCrxOy indicates Rh2−xCrxO3 including highly oxidized Cr (>3+).
The high‐resolution (HR)‐TEM images of the Cr2O3/BaLa4Ti4O15 is shown in Figure 2. The Cr2O3 layers were mainly observed at the edge of BaLa4Ti4O15 (Figure S3–S5). The reduction of the metal ions occurs more easily at the edge of BaLa4Ti4O15 than at the flat surface of BaLa4Ti4O15,49 therefore, the Cr2O3 layers seem to be formed preferentially at the edge of BaLa4Ti4O15 (Figure 1 a).
Figure 2.
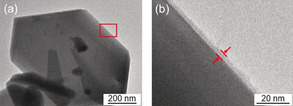
HR‐TEM images of Cr2O3/BaLa4Ti4O15 observed at (a) low and (b) high magnification for the edge of BaLa4Ti4O15 (Figure S3 and S4). The image (b) is an expansion of the red square in image (a). In this experiment, Cr was loaded at 1 wt % to easily monitor the position of the Cr2O3 layers. For the HR‐TEM image of Cr2O3/BaLa4Ti4O15 with 0.1 wt %, see Figure S5.
The Rh–SG complex was prepared by mixing RhCl3 with glutathione (GSH, Figure S2) in water, followed by the addition of a reducing agent. The optical absorption spectrum of the product is shown in Figure 3 a. A peak attributed to charge transfer from SG to Rh (ligand‐to‐metal charge transfer; LMCT)50 was observed near 350 nm, indicating the formation of the Rh−S bond. This bond formation was also confirmed by Fourier transform (FT) infrared (IR) absorption51 (Figure 3 b and S6) and Rh K‐edge FT extended X‐ray absorption fine structure (EXAFS) spectroscopies52 (Figure 3 c). The electrospray ionization (ESI) mass spectrum of the product (Figure S7) is shown in Figure 3 d. This spectrum revealed that the Rh–SG complex mainly contained RhII and RhIII species (Figure 3 d and Table S1). A similar interpretation was also obtained from the Rh K‐edge X‐ray absorption near‐edge structure (XANES) spectrum (Figure 3 e); the XANES spectrum is not consistent with that of RhIII because of a distribution in the charge state of Rh in Rh–SG complex. A dynamic light scattering (DLS) measurement revealed that the obtained Rh–SG complex had a molecular size of around 0.8 nm in solution (Figure 3 f).
Figure 3.

Characterization of the Rh–SG complex. (a) Comparison of the optical absorption spectra of Rh–SG, RhCl3, and GSH. (b) Comparison of FT‐IR spectra of Rh–SG and GSH (Figure S6). (c) Rh K‐edge FT‐EXAFS of Rh–SG. (d) Negative‐ion ESI mass spectrum of Rh–SG (Figure S7), showing that the main products are Rh2(SG)2 containing RhII (i) or RhIII (ii) (Table S1). (e) Comparison of K‐edge XANES spectra of Rh–SG, Rh2O3, and Rh foil, confirming that Rh in Rh–SG is oxidized. (f) DLS spectrum of Rh–SG, showing that the Rh–SG complex has an average diameter of 0.8 nm in water.
The Rh–SG complex was adsorbed onto Cr2O3/BaLa4Ti4O15 by stirring the materials together in water (Figure 1 c). Inductively coupled plasma mass spectrometry (ICP‐MS) analysis of the supernatant confirmed that the Rh–SG complex was adsorbed onto the photocatalyst surface with a relatively high adsorption rate (Table S2). In water, the surface of Cr2O3 is in the state of CrO(1.5−m)(OH)2m⋅x H2O (m=0, 0.5, or 1.5).53 Moreover, the bare surface of BaLa4Ti4O15 lacking Cr2O3 has also hydroxyl groups (‐OH).54 It is considered that because the polar functional groups in the ligand of the Rh–SG complex, such as carboxyl and amino groups (Figure S2), formed hydrogen bonds with the ‐OH groups on the photocatalyst surface, the Rh–SG complex was adsorbed on Cr2O3/BaLa4Ti4O15 at a high adsorption rate (Figure S8 and S9).
Rh–SG/Cr2O3/BaLa4Ti4O15 was calcined at 300 °C (Figure S10 and S11) under reduced pressure (>1.0×10⁻¹ Pa; Figure 1 d). The S 2p photoelectron spectra before and after calcination of the BaLa4Ti4O15 photocatalyst containing 0.09 wt % Rh and 0.10 wt % Cr are shown in Figure 4 Aa and 4 Ab. Before calcination (Rh–SG/Cr2O3/BaLa4Ti4O15), a peak attributed to S 2p3/2 was observed near 161.2 eV (Figure 4 Aa).55 After calcination (Rh2−xCrxOy/BaLa4Ti4O15), this peak disappeared (Figure 4 Ab), implying that SG was removed by calcination.42, 43 The elemental mapping of this photocatalyst before and after calcination is depicted in Figure 4 Ba and 4 Bb, respectively, obtained by STEM‐EDX. Before calcination (Rh–SG/Cr2O3/BaLa4Ti4O15), Rh was present on the Cr2O3 film (Figure 4Ba). After calcination (Rh2−xCrxOy/BaLa4Ti4O15), both Rh and Cr were found in the same layer (Figure 4 Bb). This phenomenon was also confirmed from the line analysis of the elemental mapping (Figure 4 C). These results indicate that Rh and Cr species mixed during calcination (Figure 5). The Rh K‐edge XANES spectra of the photocatalyst before and after irradiation is shown in Figure 6 A. The Rh K‐edge XANES spectrum of the calcined sample (Rh2−xCrxOy/BaLa4Ti4O15) greatly differs from that of Rh foil, but it resembles that of Rh1.5Cr0.5O3.45, 46, 47, 48 The estimated number of Rh−O bonds in the sample after calcination (Figure S12) is similar to that in Rh2O3 and Rh1.5Cr0.5O3 (Table S3). The Cr K‐edge XANES spectra of the sample before and after irradiation is depicted in Figure 6 B. After calcination (Rh2−xCrxOy/BaLa4Ti4O15), the intensity of the Cr K‐edge XANES spectrum at an absorption edge near 6010 eV is stronger than that of Cr foil. This indicates that the Cr in the sample after calcination (Rh2−xCrxOy/BaLa4Ti4O15) was oxidized.56 In the TEM image of Rh2−xCrxOy/BaLa4Ti4O15 (Figure 6Ca), very fine particles (1.2±0.2 nm) were observed. These results indicate that calcination resulted in the loading of ultrafine RhIII–(CrIII, CrVI) mixed oxide particles onto the BaLa4Ti4O15 surface. It is considered that because Rh and Cr tend to form mixed oxides when heated,45, 46 the calcination process induced the formation of mixed oxide particles as well as SG ligand removal (Figure 5).
Figure 4.

Characterization of the BaLa4Ti4O15 photocatalyst containing 0.09 wt % Rh and 0.10 wt % Cr. (A) S 2p photoelectron spectra and (B) STEM‐EDX elemental mapping for (a) Rh–SG/Cr2O3/BaLa4Ti4O15 and (b) Rh2−xCrxOy/BaLa4Ti4O15. (C) Line analysis of elemental mapping for (a),(c) Rh–SG/Cr2O3/BaLa4Ti4O15 and (b),(d) Rh2−xCrxOy/BaLa4Ti4O15.
Figure 5.

Schematic of the phenomenon that occurred during calcination process (Figure 4 B,C).
Figure 6.

Characterization of the BaLa4Ti4O15 photocatalyst containing 0.09 wt % Rh and 0.10 wt % Cr. (A) Rh K‐edge XANES spectra of Rh2−xCrxOy/BaLa4Ti4O15 and Rh2−xCrxO3/BaLa4Ti4O15 together with those of Rh foil and Rh0.5Cr1.5O3. (B) Cr K‐edge XANES spectra of Rh2−xCrxOy/BaLa4Ti4O15 and Rh2−xCrxO3/BaLa4Ti4O15 together with those of Cr foil, CrO3, and Rh0.5Cr1.5O3. (C) TEM images of (a) Rh2−xCrxOy/BaLa4Ti4O15 and (b) Rh2−xCrxO3/BaLa4Ti4O15. In (C), the red circles indicate the Rh2−xCrxOy or Rh2−xCrxO3 particles.
Immediately after calcination (Figure 1 d), part of the Cr species in the sample was oxidized to a higher oxidation state than CrIII.42, 43 Then, the obtained photocatalyst was irradiated with UV light for 1 h to reduce the Cr species in the higher oxidation state to CrIII (Figure 1 e).42, 43 The Cr K‐edge XANES spectrum confirmed that the Cr species in the higher oxidation state was reduced by the UV light irradiation (Figure 6 B and S13). This process had little effect on the oxidation state of the Rh species (Figure 6 A). Moreover, during the series of reaction steps in Figure 1, the crystalline structure of BaLa4Ti4O15 barely changed (Figure S14). In the TEM image of the obtained Rh2−xCrxO3/BaLa4Ti4O15 (Figure 6 Cb), particles with a size of 1.3±0.3 nm were observed. These results demonstrate that the developed loading method enabled very fine Rh2−xCrxO3 particles (≈1.3 nm) with a narrow size distribution to be loaded onto the BaLa4Ti4O15 surface (Rh2−xCrxO3(1.3 nm)/BaLa4Ti4O15).
Considering the particle size of Rh2−xCrxO3 of 1.3±0.3 nm, the obtained Rh2−xCrxO3 particles should be formed from several Rh–SG complexes. Particles of this size were probably formed (Figure S15) because several Rh–SG complexes aggregated onto BaLa4Ti4O15 during the adsorption process (Figure 4 Ba, 4 Ca, and Figure 5). The size of the loaded Rh2−xCrxO3 particles did not change when the loading amount of Rh was altered in the range of 0.05 to 0.13 wt % (Figure S16). This finding means that such a small difference of the concentration of Rh–SG complexes in solution hardly affected the degree of aggregation of Rh–SG complexes onto the BaLa4Ti4O15 surface during the adsorption process.
The water‐splitting activity of the obtained Rh2−xCrxO3(1.3 nm)/BaLa4Ti4O15 photocatalyst was then examined. Specifically, Rh2−xCrxO3(1.3 nm)/BaLa4Ti4O15 (500 mg) was dispersed in water and irradiated with UV light from a high‐pressure mercury (Hg) lamp (Figure S17).42, 43 Water‐splitting experiments using a series of samples (Figure S16 b) revealed that Rh2−xCrxO3(1.3 nm)/BaLa4Ti4O15 containing 0.09 wt % Rh and 0.10 wt % Cr exhibited the highest activity (Figure S18). For this photocatalyst, almost no decrease in activity (Figure 7) and no increase in particle size (Figure 8) were observed even after 10 h of water‐splitting reaction. Moreover, it was confirmed that the reverse reaction (Figure S19 a and S20) and the O2 photoreduction reaction (Figure S19 b and S21) were well suppressed over this sample, as expected.
Figure 7.

Time course of water splitting over Rh2−xCrxO3(1.3 nm)/BaLa4Ti4O15 with 0.09 wt % Rh and 0.10 wt % Cr. The activity hardly decreased during 10 h of the water‐splitting reaction.
Figure 8.

TEM image of Rh2−xCrxO3(1.3 nm)/BaLa4Ti4O15 containing 0.09 wt % Rh and 0.10 wt % Cr after 10 h of the water‐splitting reaction. The average size of Rh2−xCrxO3 particles after 10 h of the reaction was similar to that before the reaction (Figure 6 C(b)).
The gas‐evolution rate of Rh2−xCrxO3(1.3 nm)/BaLa4Ti4O15 containing 0.09 wt % Rh and 0.10 wt % Cr (Table 1) is shown in Figure 9 a; this photocatalyst exhibited the highest activity of the investigated photocatalysts (Figure S18). The ratio of the generated H2 and O2 amount was close to 2:1, indicating that the water‐splitting reaction proceeded ideally. The water‐splitting activity of this sample was approximately four times higher than that of BaLa4Ti4O15 loaded with Au25 clusters57, 58, 59, 60, 61, 62, 63, 64, 65, 66, 67 protected by a Cr2O3 film (Au25@Cr2O3/BaLa4Ti4O15)42, 43 (Figure 9 b and Table 1). Moreover, the Rh2−xCrxO3(1.3 nm)/BaLa4Ti4O15 photocatalyst also showed higher water‐splitting activity than that of BaLa4Ti4O15 loaded with 0.50 wt % Ni (NiNP@NiOx/BaLa4Ti4O15, Figure S22), which exhibited the highest water‐splitting activity of previously reported BaLa4Ti4O15 catalysts (Figure 9 c and Table 1).49 These results demonstrate that the use of Rh2−xCrxO3 particles as a cocatalyst is also very effective for improving the water‐splitting activity of BaLa4Ti4O15.45, 46, 47, 48, 68, 69 Rh2−xCrxO3(1.3 nm)/BaLa4Ti4O15 containing 0.09 wt % Rh and 0.10 wt % Cr showed an apparent quantum yield of 16 % under 270 nm excitation.
Table 1.
Gas‐evolution rates over various photocatalysts.
|
Photocatalyst |
Ratio of cocatalysts elements |
Loading of cocatalysts |
H2 [mmol h−1] |
O2 [mmol h−1] |
|---|---|---|---|---|
|
Rh2−xCrxO3(1.3 nm)/BaLa4Ti4O15 |
0.09 wt % Rh and 0.10 wt % Cr |
this method[a] |
9.9 |
5.1 |
|
Au25@Cr2O3/BaLa4Ti4O15 |
0.10 wt % Au and 0.50 wt % Cr |
our previous method[b] |
2.4 |
1.2 |
|
NiNP@NiOx/BaLa4Ti4O15 |
0.50 wt % Ni |
impregnation |
1.2 |
0.6 |
|
Rh2−xCrxO3(3.0 nm)/BaLa4Ti4O15 |
0.10 wt % Rh and 0.15 wt % Cr |
impregnation |
7.3 |
3.6 |
[a] Photodeposition of Cr2O3+adsorption of Rh–SG complexes+calcination of photocatalysts. [b] Photodeposition of Cr2O3+adsorption of SG‐protected Au25 cluster+calcination of photocatalysts.43
Figure 9.

Comparison of gas‐evolution rates over different photocatalysts (a) Rh2−xCrxO3(1.3 nm)/BaLa4Ti4O15 (0.09 wt % Rh and 0.10 wt % Cr), (b) Au25@Cr2O3/BaLa4Ti4O15 (0.10 wt % Au and 0.50 wt % Cr), (c) NiNP@NiOx/BaLa4Ti4O15 (0.50 wt % Ni),67 and (d) Rh2−xCrxO3(3.0 nm)/BaLa4Ti4O15 (0.10 wt % Rh and 0.15 wt % Cr) (Table 1).
To examine the importance of the preparation method used in this study, we also attempted to load the Rh2−xCrxO3 particles onto BaLa4Ti4O15 by impregnation (Figure S23) and photodeposition methods (Figure S24). We found that these techniques could not form Rh2−xCrxO3 particles with a size comparable to that achieved by the method developed in this study. Therefore, our technique is important because it allows loading of ultrafine Rh2−xCrxO3 particles. The impregnation method allowed loading of Rh2−xCrxO3 particles onto BaLa4Ti4O15 to give a photocatalyst with 0.10 wt % Rh and 0.15 wt % Cr with a particle size of 3.0±2.3 nm (Rh2−xCrxO3(3.0 nm)/BaLa4Ti4O15; Figure S23). This photocatalyst showed the highest water‐splitting activity among the Rh2−xCrxO3/BaLa4Ti4O15 photocatalysts prepared by the impregnation and photodeposition methods (Figure S24). However, the gas‐evolution rate of Rh2−xCrxO3(3.0 nm)/BaLa4Ti4O15 was ≈74 % of that of Rh2−xCrxO3(1.3 nm)/BaLa4Ti4O15 prepared by our technique (Figure 9 d and Table 1). These two photocatalysts were prepared via different methods, therefore, there may be additional differences other than the size of the Rh2−xCrxO3 particles, such as the position of cocatalysts on the surface, that contribute to the higher water‐splitting activity of Rh2−xCrxO3(1.3 nm)/BaLa4Ti4O15 compared with that of Rh2−xCrxO3(3.0 nm)/BaLa4Ti4O15 (Figure S25). Overall, this study demonstrates that loading ultrafine Rh2−xCrxO3 particles by the developed technique is an effective approach to improve the water‐splitting activity of BaLa4Ti4O15.
Conclusion
We loaded ultrafine Rh2−xCrxO3 particles with a size of approximately 1.3 nm and a narrow size distribution onto the BaLa4Ti4O15 photocatalyst by establishing a new loading method for the Rh2−xCrxO3 particles. The obtained photocatalyst exhibited a remarkably high quantum yield for water splitting compared to that achieved for BaLa4Ti4O15 in previous studies. Although this study used only BaLa4Ti4O15 as the photocatalyst,42, 43 the developed loading method can, in principal, be applied to other photocatalysts as well. Rh2−xCrxO3 particles are a useful cocatalyst for many water‐splitting photocatalysts,45, 46, 47, 48, 68, 69 therefore, we expect that this loading method should also be suitable to improve the water‐splitting activity of other advanced photocatalysts.
Conflict of interest
The authors declare no conflict of interest.
Supporting information
As a service to our authors and readers, this journal provides supporting information supplied by the authors. Such materials are peer reviewed and may be re‐organized for online delivery, but are not copy‐edited or typeset. Technical support issues arising from supporting information (other than missing files) should be addressed to the authors.
Supplementary
Acknowledgements
This work was supported by the Japan Society for the Promotion of Science (JSPS) KAKENHI, Scientific Research on Innovative Areas “Coordination Asymmetry” (grant number 17H05385), and Scientific Research on Innovative Areas “Innovations for Light‐Energy Conversion” (grant number 18H05178). The authors acknowledge the STEM facilities and scientific and technical assistance of Dr. Ashley Slattery at Adelaide Microscopy (University of Adelaide), part of Microscopy Australia.
W. Kurashige, Y. Mori, S. Ozaki, M. Kawachi, S. Hossain, T. Kawawaki, C. J. Shearer, A. Iwase, G. F. Metha, S. Yamazoe, A. Kudo, Y. Negishi, Angew. Chem. Int. Ed. 2020, 59, 7076.
References
- 1. Fujishima A., Honda K., Nature 1972, 238, 37–38. [DOI] [PubMed] [Google Scholar]
- 2. Yamakata A., Ishibashi T., Kato H., Kudo A., Onishi H., J. Phys. Chem. B 2003, 107, 14383–14387. [Google Scholar]
- 3. Hisatomi T., Kubota J., Domen K., Chem. Soc. Rev. 2014, 43, 7520–7535. [DOI] [PubMed] [Google Scholar]
- 4. Sato J., Saito N., Yamada Y., Maeda K., Takata T., Kondo J. N., Hara M., Kobayashi H., Domen K., Inoue Y., J. Am. Chem. Soc. 2005, 127, 4150–4151. [DOI] [PubMed] [Google Scholar]
- 5. Yang J., Wang D., Han H., Li C., Acc. Chem. Res. 2013, 46, 1900–1909. [DOI] [PubMed] [Google Scholar]
- 6. Maeda K., Teramura K., Lu D., Takata T., Saito N., Inoue Y., Domen K., Nature 2006, 440, 295. [DOI] [PubMed] [Google Scholar]
- 7. Kudo A., Miseki Y., Chem. Soc. Rev. 2009, 38, 253–278. [DOI] [PubMed] [Google Scholar]
- 8. Yoshida M., Maeda K., Lu D., Kubota J., Domen K., J. Phys. Chem. C 2013, 117, 14000–14006. [Google Scholar]
- 9. Li Q., Guo B., Yu J., Ran J., Zhang B., Yan H., Gong J. R., J. Am. Chem. Soc. 2011, 133, 10878–10884. [DOI] [PubMed] [Google Scholar]
- 10. Zou Z., Ye J., Sayama K., Arakawa H., Nature 2001, 414, 625–627. [DOI] [PubMed] [Google Scholar]
- 11. Wang Q., Hisatomi T., Jia Q., Tokudome H., Zhong M., Wang C., Pan Z., Takata T., Nakabayashi M., Shibata N., Li Y., Sharp I. D., Kudo A., Yamada T., Domen K., Nat. Mater. 2016, 15, 611–615. [DOI] [PubMed] [Google Scholar]
- 12. Xiang Q., Yu J., Jaroniec M., J. Am. Chem. Soc. 2012, 134, 6575–6578. [DOI] [PubMed] [Google Scholar]
- 13. Abe R., Higashi M., Domen K., J. Am. Chem. Soc. 2010, 132, 11828–11829. [DOI] [PubMed] [Google Scholar]
- 14. Osterloh F. E., Chem. Mater. 2008, 20, 35–54. [Google Scholar]
- 15. Khan S. U. M., Al-Shahry M., W. B. Ingler, Jr. , Science 2002, 297, 2243–2245. [DOI] [PubMed] [Google Scholar]
- 16. Chen X., Shen S., Guo L., Mao S. S., Chem. Rev. 2010, 110, 6503–6570. [DOI] [PubMed] [Google Scholar]
- 17. Wang X., Maeda K., Thomas A., Takanabe K., Xin G., Carlsson J. M., Domen K., Antonietti M., Nat. Mater. 2009, 8, 76–80. [DOI] [PubMed] [Google Scholar]
- 18. Wang Y., Suzuki H., Xie J., Tomita O., Martin D. J., Higashi M., Kong D., Abe R., Tang J., Chem. Rev. 2018, 118, 5201–5241. [DOI] [PMC free article] [PubMed] [Google Scholar]
- 19. Fabian D. M., Hu S., Singh N., Houle F. A., Hisatomi T., Domen K., Osterloh F. E., Ardo S., Energy Environ. Sci. 2015, 8, 2825–2850. [Google Scholar]
- 20. Kim H. G., Hwang D. W., Lee J. S., J. Am. Chem. Soc. 2004, 126, 8912–8913. [DOI] [PubMed] [Google Scholar]
- 21. Mukherji A., Seger B., Lu G. Q. M., Wang L., ACS Nano 2011, 5, 3483–3492. [DOI] [PubMed] [Google Scholar]
- 22. Maeda K., ACS Catal. 2013, 3, 1486–1503. [Google Scholar]
- 23. Hara M., Lean J. T., Mallouk T. E., Chem. Mater. 2001, 13, 4668–4675. [Google Scholar]
- 24. Liu J., Liu Y., Liu N., Han Y., Zhang X., Huang H., Lifshitz Y., Lee S.-T., Zhong J., Kang Z., Science 2015, 347, 970–974. [DOI] [PubMed] [Google Scholar]
- 25. Linic S., Christopher P., Ingram D. B., Nat. Mater. 2011, 10, 911–921. [DOI] [PubMed] [Google Scholar]
- 26. Ikeda T., Xiong A., Yoshinaga T., Maeda K., Domen K., Teranishi T., J. Phys. Chem. C 2013, 117, 2467–2473. [Google Scholar]
- 27. Sakamoto N., Ohtsuka H., Ikeda T., Maeda K., Lu D., Kanehara M., Teramura K., Teranishi T., Domen K., Nanoscale 2009, 1, 106–109. [DOI] [PubMed] [Google Scholar]
- 28. Negishi Y., Matsuura Y., Tomizawa R., Kurashige W., Niihori Y., Takayama T., Iwase A., Kudo A., J. Phys. Chem. C 2015, 119, 11224–11232. [Google Scholar]
- 29. Xue F., Chen C., Fu W., Liu M., Liu C., Guo P., Shen S., J. Phys. Chem. C 2018, 122, 25165–25173. [Google Scholar]
- 30. Wang D., Liu Z.-P., Yang W.-M., ACS Catal. 2018, 8, 7270–7278. [Google Scholar]
- 31. Maeda K., Teramura K., Lu D., Saito N., Inoue Y., Domen K., Angew. Chem. Int. Ed. 2006, 45, 7806–7809; [DOI] [PubMed] [Google Scholar]; Angew. Chem. 2006, 118, 7970–7973. [Google Scholar]
- 32. Yoshida M., Takanabe K., Maeda K., Ishikawa A., Kubota J., Sakata Y., Ikezawa Y., Domen K., J. Phys. Chem. C 2009, 113, 10151–10157. [Google Scholar]
- 33. Cho Y.-J., Moon G.-H., Kanazawa T., Maeda K., Choi W., Chem. Commun. 2016, 52, 9636–9639. [DOI] [PubMed] [Google Scholar]
- 34. Dionigi F., Vesborg P. C. K., Pedersen T., Hansen O., Dahl S., Xiong A., Maeda K., Domen K., Chorkendorff I., J. Catal. 2012, 292, 26–31. [Google Scholar]
- 35. Maeda K., Sakamoto N., Ikeda T., Ohtsuka H., Xiong A., Lu D., Kanehara M., Teranishi T., Domen K., Chem. Eur. J. 2010, 16, 7750–7759. [DOI] [PubMed] [Google Scholar]
- 36. Maeda K., Xiong A., Yoshinaga T., Ikeda T., Sakamoto N., Hisatomi T., Takashima M., Lu D., Kanehara M., Setoyama T., Teranishi T., Domen K., Angew. Chem. Int. Ed. 2010, 49, 4096–4099; [DOI] [PubMed] [Google Scholar]; Angew. Chem. 2010, 122, 4190–4193. [Google Scholar]
- 37. Sanwald K. E., Berto T. F., Jentys A., Camaioni D. M., Gutiérrez O. Y., Lercher J. A., ACS Catal. 2018, 8, 2902–2913. [Google Scholar]
- 38. Maeda K., Teramura K., Lu D., Saito N., Inoue Y., Domen K., J. Phys. Chem. C 2007, 111, 7554–7560. [Google Scholar]
- 39. Takata T., Pan C., Nakabayashi M., Shibata N., Domen K., J. Am. Chem. Soc. 2015, 137, 9627–9634. [DOI] [PubMed] [Google Scholar]
- 40. Maeda K., Lu D., Domen K., Chem. Eur. J. 2013, 19, 4986–4991. [DOI] [PubMed] [Google Scholar]
- 41. Ravi P., Rao V. N., Shankar M. V., Sathish M., Int. J. Hydrogen Energy 2018, 43, 3976–3987. [Google Scholar]
- 42. Kurashige W., Hayashi R., Wakamatsu K., Kataoka Y., Hossain S., Iwase A., Kudo A., Yamazoe S., Negishi Y., ACS Appl. Energy Mater. 2019, 2, 4175–4187. [Google Scholar]
- 43. Kurashige W., Kumazawa R., Ishii D., Hayashi R., Niihori Y., Hossain S., Nair L. V., Takayama T., Iwase A., Yamazoe S., Tsukuda T., Kudo A., Negishi Y., J. Phys. Chem. C 2018, 122, 13669–13681. [Google Scholar]
- 44. Trasatti S., J. Electroanal. Chem. 1972, 39, 163–184. [Google Scholar]
- 45. Hisatomi T., Maeda K., Takanabe K., Kubota J., Domen K., J. Phys. Chem. C 2009, 113, 21458–21466. [Google Scholar]
- 46. Maeda K., Teramura K., Masuda H., Takata T., Saito N., Inoue Y., Domen K., J. Phys. Chem. B 2006, 110, 13107–13112. [DOI] [PubMed] [Google Scholar]
- 47. Ohno T., Bai L., Hisatomi T., Maeda K., Domen K., J. Am. Chem. Soc. 2012, 134, 8254–8259. [DOI] [PubMed] [Google Scholar]
- 48. Maeda K., Lu D., Teramura K., Domen K., Energy Environ. Sci. 2010, 3, 471–478. [Google Scholar]
- 49. Miseki Y., Kato H., Kudo A., Energy Environ. Sci. 2009, 2, 306–314. [Google Scholar]
- 50. Garcia A. E., Jalilehvand F., J. Biol. Inorg. Chem. 2018, 23, 231–239. [DOI] [PMC free article] [PubMed] [Google Scholar]
- 51. Barth A., Prog. Biophys. Mol. Biol. 2000, 74, 141–173. [DOI] [PubMed] [Google Scholar]
- 52. Parthé E., Hohnke D., Hulliger F., Acta Crystallogr. 1967, 23, 832–840. [Google Scholar]
- 53. Sunseri C., Piazza S., Quarto F. D., J. Electrochem. Soc. 1990, 137, 2411–2417. [Google Scholar]
- 54. Boehm H. P., Discuss. Faraday Soc. 1971, 52, 264–275. [Google Scholar]
- 55. Uvdal K., Bodö P., Liedberg B., J. Colloid Interface Sci. 1992, 149, 162–173. [Google Scholar]
- 56. Peterson M. L., G. E. Brown, Jr. , Parks G. A., Stein C. L., Geochim. Cosmochim. Acta 1997, 61, 3399–3412. [Google Scholar]
- 57. Zhu M., Aikens C. M., Hollander F. J., Schatz G. C., Jin R., J. Am. Chem. Soc. 2008, 130, 5883–5885. [DOI] [PubMed] [Google Scholar]
- 58. Negishi Y., Nobusada K., Tsukuda T., J. Am. Chem. Soc. 2005, 127, 5261–5270. [DOI] [PubMed] [Google Scholar]
- 59. Shichibu Y., Negishi Y., Tsukuda T., Teranishi T., J. Am. Chem. Soc. 2005, 127, 13464–13465. [DOI] [PubMed] [Google Scholar]
- 60. Shibu E. S., Muhammed M. A. H., Tsukuda T., Pradeep T., J. Phys. Chem. C 2008, 112, 12168–12176. [Google Scholar]
- 61. Wang S., Song Y., Jin S., Liu X., Zhang J., Pei Y., Meng X., Chen M., Li P., Zhu M., J. Am. Chem. Soc. 2015, 137, 4018–4021. [DOI] [PubMed] [Google Scholar]
- 62. Yao C., Lin Y.-J., Yuan J., Liao L., Zhu M., Weng L.-H., Yang J., Wu Z., J. Am. Chem. Soc. 2015, 137, 15350–15353. [DOI] [PubMed] [Google Scholar]
- 63. Dass A., Stevenson A., Dubay G. R., Tracy J. B., Murray R. W., J. Am. Chem. Soc. 2008, 130, 5940–5946. [DOI] [PubMed] [Google Scholar]
- 64. Chen T., Fung V., Yao Q., Luo Z., Jiang D.-E., Xie J., J. Am. Chem. Soc. 2018, 140, 11370–11377. [DOI] [PubMed] [Google Scholar]
- 65. Luo Z., Nachammai V., Zhang B., Yan N., Leong D. T., Jiang D.-E., Xie J., J. Am. Chem. Soc. 2014, 136, 10577–10580. [DOI] [PubMed] [Google Scholar]
- 66. Kawamura K., Hikosou D., Inui A., Yamamoto K., Yagi J., Saita S., Kawasaki H., J. Phys. Chem. C 2019, 123, 26644–26652. [Google Scholar]
- 67. Black D. M., Crittenden C. M., Brodbelt J. S., Whetten R. L., J. Phys. Chem. Lett. 2017, 8, 1283–1289. [DOI] [PubMed] [Google Scholar]
- 68. Sakata Y., Hayashi T., Yasunaga R., Yanaga N., Imamura H., Chem. Commun. 2015, 51, 12935–12938. [DOI] [PubMed] [Google Scholar]
- 69. Chiang T. H., Lyu H., Hisatomi T., Goto Y., Takata T., Katayama M., Minegishi T., Domen K., ACS Catal. 2018, 8, 2782–2788. [Google Scholar]
Associated Data
This section collects any data citations, data availability statements, or supplementary materials included in this article.
Supplementary Materials
As a service to our authors and readers, this journal provides supporting information supplied by the authors. Such materials are peer reviewed and may be re‐organized for online delivery, but are not copy‐edited or typeset. Technical support issues arising from supporting information (other than missing files) should be addressed to the authors.
Supplementary