

SUMMARY
Atherosclerosis is driven by multifaceted contributions of the immune system within the circulation and at vascular focal sites. However, specific characteristics of dysregulated immune cells within atherosclerotic lesions that lead to clinical events such as ischemic stroke or myocardial infarction are poorly understood. Here, using single-cell proteomic and transcriptomic analyses we uncovered distinct features of both T cells and macrophages in carotid artery plaques of patients with clinically symptomatic disease (recent stroke or transient ischemic attack) compared to asymptomatic disease (no recent stroke). Plaques from symptomatic patients were characterized by a distinct subset of CD4+ T cells and by T cells that were activated and differentiated. Moreover, some T cell subsets in these plaques presented markers of T cell exhaustion. Additionally, macrophages from these plaques contained alternatively activated phenotypes, including subsets associated with plaque vulnerability. In plaques from asymptomatic patients, T cells and macrophages were activated and displayed evidence of IL-1β signaling. The identification of specific features of innate and adaptive immune cells in plaques that are associated with cerebrovascular events may enable the design of more precisely tailored cardiovascular immunotherapies.
Keywords: Atherosclerotic plaque, T cells, macrophages, cerebrovascular events, Stroke, CyTOF, scRNA-seq, CITE-seq, cell-cell interactions, IL-1β, PD-1, T cell exhaustion
INTRODUCTION
Vascular inflammation is a key component of atherosclerosis that contributes to plaque instability and clinical cardiovascular (CV) events, including ischemic stroke and myocardial infarction (MI)1–3. Despite decades of research, the immune mechanisms contributing to these processes remain largely unresolved. Most studies in the field rely on the use of animal models that fail to adequately recapitulate the human immune environment and lack spontaneous plaque rupture4,5. Histological studies from plaques of acute coronary death patients have established that culprit lesions present a large necrotic core, a thin fibrous cap and a high ratio of macrophages to vascular smooth muscle cells6. Consequently, most research has focused on macrophages as drivers of plaque instability2,3. However, the inherent immune diversity in atherosclerotic plaques suggests a critical yet obscure role for other immune cells at the plaque site. For example, murine studies demonstrate that plaque-derived T cells can be either pro- or anti-atherogenic1,7, but the phenotypic and functional diversity of these and other cell types in atherosclerosis and their contribution to human disease remain undefined. Several studies suggest that circulating immune cells influence the clinical course of atherosclerosis, as patients with acute CV events present increased circulating monocyte and CD4+ T cell subtypes8–10. However, the interplay of systemic immune responses with those at the plaque site, where rupture occurs, are vastly under investigated. Thus, immune cell phenotypes and functional relationships within and between plaque and blood of the same patient are important yet unexplored concepts that could lead to conceptually innovative immunotherapies.
Targeting inflammation to reduce CV risk in patients has long been proposed. The recent outcomes of the Canakinumab Anti‐inflammatory Thrombosis Outcomes Study (CANTOS)11 support the efficacy of this approach. However, interleukin‐1β inhibition only moderately (−15%) reduced CV events in post-MI patients, leaving a high residual CV risk. Furthermore, the failure of the Cardiovascular Inflammation Reduction Trial (CIRT)12 which tested low‐dose methotrexate, has shown that broad anti-inflammatory treatments are ineffective in reducing CV events. Altogether these observations underscore that immunomodulatory treatments must be tailored to specific immune defects.
Therefore, the identification of specific immune dysregulation at the plaque site could aid new immunotherapies for CV disease, beyond the traditional management of risk factors and use of standard-of-care lipid lowering drugs13. The recent use of innovative single-cell analyses to study murine atherosclerosis14–17 highlights the potential of these unbiased approaches to systematically resolve the immune diversity in plaques and decipher the molecular alterations of immune cells that contribute to human disease and its CV complications.
RESULTS
Single-Cell Immunophenotyping of Human Atherosclerosis: Study Design
To map the immune microenvironment of atherosclerotic lesions, identify mirroring changes in blood and pinpoint cell-specific alterations associated with CV events (i.e. stroke, TIA), we integrated mass-cytometry (CyTOF), Cellular Indexing of Transcriptomes and Epitopes by Sequencing (CITE-seq) and scRNA-seq analyses from a total of 46 prospectively enrolled patients undergoing carotid endarterectomy (Extended Fig.1a-c, Supplementary Table 1a; Methods). A first CyTOF analysis (cohort 1, n=15) revealed an unexpected T cell heterogeneity in plaques compared to blood. We also identified adaptive dysregulation within plaques of patients with recent CV events (symptomatic, SYM; n=7) vs. asymptomatic patients (ASYM; n=8) (Supplementary Table 1b). Based on these observations, we performed additional analyses on additional 31 patients (Cohort 2, Supplementary Table 1c). CyTOF analysis of T cells in blood and plaque of the same patient was done on a total of 27 patients (Supplementary Table 1d) which included metaclustering analysis (n=23) and manual gating which was performed on both cohorts (Fig.1b) (Supplementary Table 1d-e). CITE-seq analysis of blood and paired atherosclerotic plaque of the same patient (n=1) complemented these studies. Finally, to identify plaque-specific immune alterations associated with CV events, we investigated T cells and macrophages in 6 plaques of SYM and ASYM patients combining CyTOF, scRNA-seq and cell-cell interaction analyses (Extended Fig.1c; Supplementary Table 1f,g).
Figure 1. T cells and macrophages dominate the atherosclerotic plaque immune landscape.

MetaLouvain clustering of CD45+ cells derived from blood and plaque tissue (n=15 patients). Representative ViSNE plots of Louvain clustered immune cells (n= 9,490) overlaid with tissue type (a) or immune cell populations (b). Parentheses indicate the MetaCluster (MC) Community. (c) Heatmap of normalized, Z-scored protein expression of MC data, relating the MC communities (left) found across both tissue types to the expression of protein markers (top) and the annotated cell types (right). (d) Bar chart of the relative frequency of immune cell types derived from aggregated MC data in blood and plaque. pDC, plasmacytoid dendritic cell; DC, dendritic cell. (e) Volcano plot of the fold change of MC frequency in plaque and blood from 15 patients. P values were calculated using a paired, two-sided Student’s t-Test and FDR corrected using Benjamini-Hochberg. (f) Scatter bar plots of plaque-enriched MCs from 15 patients, showing the MC frequency stratified by tissue type. MCs are annotated by their cell type. Data were analyzed with the two-sided Wilcoxon test. Values are mean ± SD.
Mass-Cytometry Immunophenotyping of Atherosclerotic Plaque and Paired Blood
The phenotypic distribution of immune cells in plaque and blood by CyTOF were first analyzed using viSNE, an unbiased dimensionality reduction algorithm (Fig.1a, Methods). Unbiased MetaLouvain analysis (Methods) was used to cluster single cells by shared proteins in each tissue of each individual patient. Secondary clustering identified MetaClusters (MCs) across tissues and patients. MCs discovered in cohort 1 (n=15) largely corresponded to known immune cell populations with distinct distributions between blood and plaque (Fig.1a–d, Extended Fig. 2a,b). All major immune cells were identified in plaques, with CD4+ and CD8+ T cells combined being the most abundant (≈65%), and CD8+ T cells the most enriched vs. blood (Fig.1d). Immune cells specifically enriched in plaques included macrophages (MC4), CD8+ EM T cells (MC12), CD4+ EM T cells (MC7) and CD4–CD8– T cells (MC18) (Fig.1e,f, Extended Fig. 2b; Supplementary Table 2). As expected, CD14+ monocytes (MC13), natural killer (NK) cells (MC6), plasmacytoid dendritic cells (pDCs) (MC16), B cells (MC3), and CD4+CD8+ T cells (MC10) were more abundant in blood (Extended Fig.2b,c). See Supplementary Table 3 for a list of antibodies.
Mass-Cytometry of Immune Cells in Atherosclerotic Plaque
An independent MC analysis comparing plaque immune cells from ASYM (n=8) and SYM (n=7) patients of cohort 1 identified 15 plaque tissue-specific MCs (Extended Fig.3a-e, including 2 macrophage MCs (MCs1,4). Macrophages of MC1 were CD206hiCD163hi, corresponding M2-like macrophages with reported atheroprotective or proatherogenic functions18. We also identified 3 subsets of CD8+ T cells (MCs 3,7,10) and 5 of CD4+ T cells (MCs 5,8,9,13,15). CD8+ T cells (MC7) and of CD4+CD56+ cells (MC5) were exclusively enriched in SYM plaques. Significant associations between cell frequencies of different plaque MCs suggested dynamic interplay between the innate and adaptive immune cells (Supplementary Fig.1). Identified differences were unrelated to the plaque pathology—as prospectively enrolled ASYM and SYM patients of cohort 1 presented the same type VI plaque as per the criteria of the American Heart Association (AHA) classification19—nor to clinical characteristics (Supplementary Fig.2).
Mass-Cytometry Analysis of T Cells in Atherosclerotic Plaque and Paired Blood
We next analyzed a second independent cohort (cohort 2, n=23) of ASYM and SYM patients (Supplementary Table 1 with an extended antibody panel (Extended Fig.1a, Methods, Supplementary Table 3). We confirmed that T cells were dominant in plaques vs. blood, and discovered a highly heterogenous adaptive immune compartment (Fig.2a–d, Extended Fig.4a-e). Thirteen MCs of CD4+ T cells included central memory (CM) (MCs 7,14,17,23,24), effector memory (EM) (MCs 1,4,12,18,22), terminally differentiated effector memory (EMRA) (MC2), and regulatory T cells (MCs 6,19). The CD8+ T-cell compartment comprised 6 MCs, including naïve (MC13), EM (MCs 20,11,10), and EMRA (MCs 9,21). A manual gating analysis confirmed that most plaque T cells were EM cells (Extended Fig.3f-h, Supplementary Table 4).
Figure 2. Diversity of the T cell compartment in human atherosclerosis.

(a-d) MetaLouvain clustering of CD3+ T cells from blood and plaque tissue from 23 patients. Representative viSNE plots of Louvain clustered T cells (n=10,000 cells) overlaid with tissue type (a), spectral colors indicating protein expression of the T-cell markers CD8 (b) and CD4 (c), and with the respective MetaLouvain clustered (MetaCluster, MC) communities that are found numbered in boxes on top. (e) Clustergrammer heatmap showing protein marker expression (top) in each MC (left) and the canonical annotation of these communities (right). The dendrogram bars (light gray) indicate the clustering of MCs based on the cosine distance method in Clustergrammer. (f) Bar chart of the relative frequency of T cell MCs in blood and plaque. (g) Volcano plot of the fold change of MC frequency in blood (left) and atherosclerotic plaque (right). P values were calculated using a paired, two-sided Student’s t-Test and FDR corrected using Benjamini-Hochberg (h) Scatter bar plots of plaque-enriched T cell MCs from 23 patients, showing that MC frequency stratified by tissue type. MCs are annotated by their cell type. Data were analyzed with the two-sided Wilcoxon test. Values are mean ± SD.
Plaques had a higher frequency of CD8+ T cells (≈39% vs. ≈26% in blood), and a lower frequency of CD4+ T cells (≈50% vs. ≈65% in blood) (Fig.2f), confirming an enrichment of CD8+ T cell in plaque. Specifically, the 4 plaque-enriched MCs (Fig.2g, Extended Fig.4b) were all EM T cells (CCR7lowCD45RAlow) and shared high expression of CD69, an early activation and tissue residency marker20 (Fig.2e). Three were CD8+ subsets (MCs 10,11,20), and one was a CD4+ subset (MC12) (Fig.2e–h, Extended Fig.4d). MCs 10, 12, and 20 displayed the most similar marker expression pattern and unbiasedly clustered together (Fig.2e, Extended Fig.4e), suggesting similar functions in plaque. Conversely, MC11 unbiasedly clustered with EMRA subsets, suggesting a transition toward a terminally differentiating phenotype (Fig.2e, Extended Fig.4d). CD8+ T cells from MC10 were CD103+, detected exclusively in plaque (Fig.2e,h, Extended Fig.4b), and corresponded to a classical tissue-resident memory (TRM) T cell reported in human lymphoid and non-lymphoid tissues20. Our study is the first to identify their presence in the human atherosclerotic arterial wall.
Mass-Cytometry Analysis of T Cells Enriched in Atherosclerotic Plaques
Plaque-derived CD4+ and CD8+ EM T cells (MCs 11,12,20) expressed higher levels of CD69 vs. blood (Extended Fig.5a-c). Because CD69 can define TRM subsets regardless of CD103 expression20, these observations suggest that plaque-enriched MCs might represent TRM subsets. CD69 is also a marker of early activation; therefore, we assessed the activation markers CD38, CCR5, and HLA-DR20. CD38 expression was high and uniform on cells of MCs 11, 12, and 20 vs. blood. In contrast, CCR5 and HLA-DR showed different patterns of expression. These data suggest that CD4+ and CD8+ T cell subsets in plaque are more activated than their blood counterparts and present a heterogeneous spectrum of activation. T cells from MCs 11, 12, and 20 expressed high levels of PD-1, a negative regulator of T cell activation and marker of T cell exhaustion21,22, in plaque vs. blood. T cells in tissue generally expressed low levels of co-stimulatory molecules (i.e. CD28, CD27, CD127). Overall, plaque T cell subsets exhibited a chronically activated and differentiated phenotype. The high PD-1 levels suggest that these subsets may simultaneously initiate an exhaustion reprogramming in response to plaque chronic inflammation21,22. Additionally, CD8+ T cells of MCs 11, 12 and 20 expressed lower levels of perforin, but not of granzyme B, in plaques, which suggests partially reduced cytotoxic functions that are typically seen in early T cell exhaustion23,24 (Extended Fig.5d). Because MC10 was exclusive to plaque, we compared it to MCs 11 and 20 in tissue (Extended Fig.5e). CCR5 expression was similar between MCs 10 and 20, and higher than in MC11, suggesting higher activation of both MC10 and MC20. MC10 also displayed lower levels of the co-stimulatory molecules CD27 and CD28 than MCs 11 and 20, suggesting that the cells of MC 10 were more differentiated21. PD-1 levels were similar between MCs 10, 11, and 20. An independent MC analysis on plaque T cells from cohort 2 (Extended Fig.6a-c identified a MC of CD69+CCR5+PD1intCD127-CD8+ T cells (MC25) whose frequencies correlated with TCR clonality in tissue (Extended Fig. 6b, suggesting clonal expansion of these cells in plaques. An independent manual gating analysis of plaque-specific CD8+ T cells confirmed that the majority of CD8+ subsets (≈68%) were CD127– and activated (HLA-DRhiCD38hi), differentiated (CD26loCD27loCCR7lo) and positively correlated with TCR clonality in tissue (Extended Fig. 6d-h), suggesting clonal expansion of these cells. Accordingly, CD127- T cells were more proliferative (Ki67+) except for a subset of CD57hiki67– cells (Extended Fig. 6i-k), suggesting a senescent replicative transitioning possibly due to chronic antigen stimulation21.
CITE-seq Immune Profiling Across Plaque and Blood
To further decipher key differences in immune molecular mechanisms and signaling pathways in plaque tissue and blood, we analyzed T cells using CITE-seq, a method that integrates proteomic and transcriptomic data into a single readout. We also focused on plaque macrophages, given their undisputed role in the disease1,25. Consistent with our CyTOF results, T cells accounted for the majority of plaque immune cells (Fig.3a–c) and CD8+ T cells were enriched in plaque (≈46%) compared to blood (≈10%). (Fig.3c). CD8+ and CD4+ T cell subsets confirmed distinct functional states, with blood having higher levels of naïve and central memory markers (CD62L and CD27), and plaque of the activation markers HLA-DR and of CD38 exclusively in CD8+ T cells (Extended Fig.7a-e. Plaque macrophages (≈16%) (Extended Fig.7f,g comprised 2 macrophage subsets (CD64+HLADR+CD206hi and CD64+HLADR+CD206lo) based on the varied expression of the M2 marker CD206, which accounted for ~47% of plaque macrophages (Extended Fig.7h,i).
Figure 3. Combined epitope and transcriptomic analysis of paired atherosclerotic plaque and blood using CITE-seq.

(a, b) viSNE plots (n=5,362 cells) clustered by Antibody Derived Tag (ADT) expression and overlaid with tissue (a) or immune cell (b) type. (c) Bar chart of cell type frequencies in blood and plaque. (d-i) CITE-Seq gene expression data from T cells (plaque n=921; blood n=1,652) and macrophages (n=265). (d) Volcano plot of the top 5000 Differentially Expressed Genes (DEGs) (determined by two-sided Welch’s T- Test and Benjamini-Hochberg correction) in T cells of plaque or blood. (e) Pathway analysis of T cell DEGs with q<0.05 (n=1,570 genes) upregulated in blood (left) and plaque (right). The combined score metric corresponds to the P value (two-sided Fisher’s exact test) multiplied by the Z-score of the deviation from the expected rank, and q values determined by Benjamini-Hochberg correction. Heatmap of hierarchically clustered (f) top 50 variable genes across T cells (n=2,573 cells) in plaque and blood, and (h) top 100 variable genes across macrophages (n=265 cells). Rows: z-scored gene expression values; columns: individual cells. Heatmap categories (above) of identified cell clusters. (f), the middle category indicates the cell’s origin from plaque or blood; the bottom category indicates the cluster’s identity as CD8+ or CD4+ T cells. Cluster enrichment in tissue type is displayed below the heatmap with p values (two-sided binomial proportions test). Boxes (right) list key genes found in clusters. (g, i) Canonical signaling pathway analysis of the top 5000 DEGs in the indicated cell clusters from T cells (g) and macrophages (i).
GEX analysis of T cells in blood and plaques.
Plaque T cells displayed transcriptional signatures associated with T cell activation (NFATC2, FYN, ZAP70), cytotoxicity (GZMA, GZMK), and T cell exhaustion (EOMES, PDCD1, LAG3) (Fig. 3d). Signaling pathway analysis highlighted effector and inflammatory functions (Interferon and Cytokine Signaling), proliferation and survival (IL-2 Signaling) (Fig.3e). In contrast, blood T cells expressed genes generally inhibiting T cell functions (i.e. KLF2, TXNIP) (Fig.4d). Consistent with a resting phenotype, TGF-β signaling, RNA processing/splicing were activated in blood T cells (Fig.3e). We identified 16 clusters providing more granular information on T cells in plaque or blood (Fig.3f). Plaque-enriched clusters corresponded to CD8+ T cells (1, 3, 4, 12) and CD4+ T cells (9), consistent with our CyTOF observations that plaques are enriched in heterogeneous subsets CD8+ T cells. Blood-enriched clusters (11,15, 16) mostly corresponded to resting CD4+ T cells consistent with upregulated Rho GDP-dissociation inhibitor (RhoDGI) signaling, which antagonizes T cell activation26 (Fig.3g). The majority of plaque-enriched clusters (1, 3, 9) presented distinct activation states based on the differential representation of pathways such as RhoA and PCKθ signaling27. Plaque-specific clusters 1, 3, and 9 upregulated signaling associated with activation-induced T cell exhaustion, including PKCθ signaling, required for TCR-induced T cell activation, and NFAT signaling28. These data confirm our CyTOF observations that in blood, T cells mostly display a quiescent state, while in plaques, they exhibit distinct degrees of activation which overlaps with exhaustion, suggesting a progressive loss of T-cell functions in response to chronic, persistent inflammation23,24. A sub analysis of CD4+ T cells confirmed that circulating cells were resting whereas in plaques they presented an activated pro-inflammatory state [Th1 functions (i.e. KLRD1, KLRC1, CXCR3, STAT3, IFNGR1, HLA-B); chemotaxis (i.e. CCL5, CCL4, CXCR6)] (Extended Fig.8a,c). The only plaque-enriched cluster (11) expressed genes of T cell activation and was the only one associated with the activation of the pro-inflammatory Th1 and Th17 signaling pathways (Extended Fig. 8e,g). A subanalysis of CD8+ T cells showed a similar pattern of cells resting in blood and an activated in plaque (Extended Fig. 8b,d). Signaling pathway analysis confirmed the co-existence of activated, pro-inflammatory and exhausted CD8+ T cells in plaques as shown by the concomintant activation of IFNγ and PD-1 signaling. We identified 8 clusters of CD8+ T cells with the majority (clusters 1, 2 and 4–7) being enriched in plaque. Clusters 1 and 7 were the more activated, with cluster 1 being more cytotoxic. Other clusters were less active and cluster 2 was uniquely characterized by the activation of the T cell exhaustion pathway (Extended Fig. 8f,h; Supplementary Table 5)
Figure 4. Dysregulation of CD4+ T cells associated with cerebrovascular events.

(a-c) Cohort 2 MC analyses on 23 patients stratified by asymptomatic (ASYM, n=14) and symptomatic (SYM, n=9). (a) Frequencies of MCs in plaque, sidebar (right) indicates MC T cell subtype(b) Volcano plot of MCs enriched in SYM (red) or ASYM (blue). (c) Frequency of T cells belonging to MC12 in plaques from ASYM and SYM patients. Values are mean ± SD. For (b, c) q values determined by two-sided multiple t-test with FDR=0.5% corrected using the Benjamini, Krieger and Yekuteli method. (d-g) Single-cell gene expression data of CD4+ T cells (n=1,200) from atherosclerotic plaques of both SYM (n=2) and ASYM (n=4) patients. (d) Volcano plot of the top 5000 Differentially Expressed Genes (DEGs), determined by two-sided Welch’s T- Test and Benjamini-Hochberg correction, that were upregulated in SYM and ASYM(e) Pathway analysis of CD4+ T cell DEGs (n=5,000 genes) in plaques upregulated in SYM (right) and ASYM (left). The combined score metric corresponds to the P value (two-sided Fisher’s exact test) multiplied by the Z-score of the deviation from the expected rank, and q values determined by Benjamini-Hochberg correction. (f) Heatmap of hierarchically clustered top 100 variable genes across CD4+ T cells (n=1,200 cells) in SYM and ASYM patients. Rows: z-scored gene expression values; columns: individual cells. The top category of the heatmap shows identified cell clusters, the middle category indicates the cluster’s enrichment in SYM/ ASYM patients (p values determined by the two-sided binomial proportions test), and the bottom category indicates the cell’s origin from SYM or ASYM subjects. Boxes (right) list key genes found in corresponding clusters. (g) Canonical signaling pathway analysis of the top 5000 DEGs in the indicated cell clusters from plaques from SYM or ASYM patients.
GEX analysis of macrophages in plaques.
The transcriptional analysis of plaque macrophages identifed 5 distinct clusters (Fig.3h) and revealed a greater functional heterogeneity compared to the two subsets detected in our CyTOF and CITE-seq analyses (Extended Fig.7h,i). Signaling pathway analysis revealed that clusters 1, 2 and 3, were more activated and pro-inflammatory than cluster 5, which presented a foam cell transcriptional signature (Fig.3h,i). Cluster 1 expressed genes involved in macrophage activation(i.e. HLA-DRA and CD74)17. Cluster 2 was highly inflammatory, expressing genes involved in inflammatory responses (i.e. CYBA, LYZ, S100A9/8, AIF1), toll-like receptor binding (S100A9/8), and oxidoreductase activities (CYBA). Cluster 2 also upregulated the metalloprotease inhibitor TIMP1, which could reduce extracellular matrix (ECM) degradation and plaque stabilization. Cluster 3 uniquely upregulated genes involved in pro-inflammatory responses (JUNB, NFKBIA) and highly expressed MALAT1, a long non-coding gene with proatherogenic functions29 but also implicated in M2 polarization30 and foam cell formation31. The activation of liver X receptor (LXR) and retinoid X receptor (RXR) signaling in this cluster suggests cholesterol efflux functions. Finally, cluster 5 expressed genes involved in cholesterol uptake and metabolism (i.e. APOC1, APOE) and lipid accumulation (PLIN2), corresponding to foam cells. These macrophages showed reduced pro-inflammatory signaling (e.g. IL-1, IFN), suggesting an anti-inflammatory nature for macrophages of cluster 5 except for the expression of the chemokine CCL2.
Immune Dysregulation Linked to Clinical Cerebrovascular Outcomes: Mass-Cytometry of ASYM and SYM plaques.
To identify the plaque-specific immune perturbations associated with recent CV events, we stratified the profiles of SYM and ASYM patients from the T cell MC analysis (Cohort 2, Fig.2). SYM patients had a greater frequency of CD4+ EM T cells of MC12 in plaques (≈32%, SYM vs. ≈20%, ASYM) (Fig.4a-c), a change unrelated to the plaque type according to the pathological criteria of the AHA19 (Extended Fig.9a, Supplementary Fig.2). These changes in plaque frequency were not associated to phenotypic differences based on the analysis of surface markers (Extended Fig.9). Other plaque-enriched MCs displayed differences in surface marker expression, suggesting functional alterations associated with recent ischemic cerebrovascular events (Extended Fig.9).
Immune Dysregulation Linked to Clinical Cerebrovascular Outcomes: scRNA-seq Analysis of ASYM and SYM plaques
To further investigate functional dysregulation of T cells and investigate macrophage alterations associated with CV events, we performed scRNA-seq analysis of plaques from SYM and ASYM patients.
CD4+ T cells.
This analysis highlighted a transcriptional profile and signaling pathways consistent with activation and effector functions of CD4+ T cells in ASYM patients (i.e. IFNG pathway, type I interferon signaling). These cells also exclusively upregulated the IL-1 and IL-6 signaling pathways (Fig.4d,e). Because IL-1 acts as a licensing signal that stabilizes cytokine transcripts and enables effector functions32 and IL-6 promotes T cell survival33, these pathways may enhance the effector functions of CD4+ T cells in ASYM plaques. CD4+ T cells in SYM plaques explicitly lacked IL-1 and IL-6 signaling pathways, which may indicate that therapeutics that target these pathways may be less effective following acute ischemic events. CD4+ T cells from SYM plaques displayed distinct signaling pathways involved in T cell migration (RhoGTPase)27, activation (PDGFR-β)34 and differentiation (Wnt35, IL-236). We identified 4 main clusters with distinct enrichments between ASYM (15, 58) and SYM (11, 35) plaques (Fig.4f). ASYM-enriched clusters shared many of the same pathways highlighting a similar activated cell phenotype (Fig.4g). Conversely, SYM-enriched cluster 11 was activated and proinflammatory, as indicated by Th1 pathway and RhoA signaling. SYM-enriched cluster 35 presented an overall downregulation of gene expression.
CD8+ T cells.
The transcriptional profile CD8+ T cells in ASYM and SYM plaques (Fig.5a) partially overlapped with that of CD4+ T cells as shown by the upregulation of activation genes (i.e. IFNG, and TNF) and signaling pathways (type I interferon, IL-6 signaling) (Fig.5a). Distinct gene expression (i.e. CXCR4, GZMB, CCL4L2) and signaling pathways (granzyme, TGFβ) indicated specific chemotactic and cytotoxic functions CD8+ T cells in ASYM plaques. SYM CD8+ T cells were characterized by unique set of genes (Fig.5a) and signaling pathways (Fig.5c). This analysis identified clusters with distinct enrichments between ASYM (3, 4) and SYM (1, 5, 7) plaques (Fig.5e). Cluster 4 was characterized by inflammatory (IL-6, chemokine signaling) and regulatory pathways related to T cell activation and migration (i.e. RAC signaling, TNFR½ signaling) (Fig.5g). Cluster 1 and cluster 3 shared a similar, activated functional state (Fig.5g). However, cluster 1 was distinctive in the co-activation of Interferon and T cell exhaustion signaling (Fig.5g). Because T cell exhaustion is characterized by the gradual depletion of effector functions in response to chronic, non-resolving inflammation23,24, the identification of concomitant activation and exhaustion signaling suggests that these activated cells initiate an exhaustion reprogramming (Supplementary Table 6).
Figure 5. Transcriptional dysregulation of CD8+ T cells and macrophages associated with cerebrovascular events.

Volcano plots of the top 5000 Differentially Expressed Genes (DEGs) upregulated in SYM (red) and ASYM (blue) patients in (a) CD8+ T cells (n=1,747 cells) and (b) macrophages (n=747 cells)DEGs were statistically derived using a two-sided Welch’s T- Test combined with Benjamini-Hochberg correction. Pathway analysis of the top 5000 DEGs of (c) CD8+ T cells and (d) macrophages in plaques upregulated in SYM and ASYM patients. The combined score corresponds to the P value (two-sided Fisher’s exact test) multiplied by the Z-score of the deviation from the expected rank, and q values were determined using the Benjamini-Hochberg multiple hypothesis correction. Heatmap of the top 100 variable genes hierarchically clustered in (e) CD8+ T cells and (f) macrophages across SYM and ASYM patients. Rows: z-scored gene expression values; columns: individual cells. Above the heatmap, the top category shows identified cell clusters, the middle category indicates the cluster’s enrichment in SYM/ ASYM patients (p values determined by the two-sided binomial proportions test), and the bottom category indicates the cell’s origin from SYM or ASYM subjects. Boxes (right) list key genes found in clusters. (g) Canonical signaling pathway analysis of the top 5000 DEGs in the indicated cell clusters from plaques from SYM or ASYM patients.
Macrophages.
ASYM macrophages were more activated, pro-inflammatory, and displayed enhanced foam cell functions compared to SYM macrophages. ASYM macrophages were characterized by several pro-inflammatory chemokines (Fig.5b). IL-1 signaling was highly activated in ASYM macrophages, which expressed IL1B and IL1RAP (a component of the IL-1 receptor) as well as NFKBIA and NLRP3, known mediators of IL-1β production37. The inhibitory IL-1 decoy receptor (IL1RN), was co-expressed, suggesting regulatory mechanisms for IL-1β signaling (Fig.5d). ASYM macrophages expressed genes involved in lipid metabolism and foam cell formation. In SYM plaques, macrophages expressed several granzyme genes as well as the proatherogenic chemokine CCL5 associated with plaque instability38(Fig.5b). Top signaling pathways included CXCR4 signaling, which indicates pro-inflammatory functions, and pathways involved reparative functions [phagocytosis (RAC139 and IL-2140 signaling), cell survival and wound healing (IL-35 signaling41)] (Fig.5d). The pro-angiogenic IL-8 and CXCR2 signaling, implicated in plaque instability42, and the Hedgehog and Wnt signaling, involved in anti-fibrotic responses and possibly plaque destabilization43, were both identified in SYM macrophages.
Heterogeneous and highly specialized macrophage subsets were enriched in either ASYM plaques (clusters 5, 6, 8) or SYM plaques (clusters 2, 9, 10) (Fig.5f,h). In ASYM plaque, macrophages of cluster 6, 8 were activated and pro-inflammatory. Macrophages from cluster 8 expressed IL1B and the inflammasome pathway, IL-1 and IL-6 signaling were activated in this cluster. Cluster 5 uniquely upregulated genes involved in lipid uptake and metabolism (i.e. APOC1, APOE) and cholesterol transportation (NPC2) suggesting that these macrophages were foam cells. In contrast, clusters 2, 9 and 10 from SYM plaques displayed fewer proinflammatory genes. Clusters 9 and 10 shared similar phenotypes including PPARα/RXRα signaling that is known to drive macrophage polarization towards the reparative M2 phenotype44. Cluster 9 was distinct based on the activation of NFAT signaling, as seen in macrophages in rheumatoid arthritis45 and inflammatory bowel disease46, conditions that are at high risk of CV disease47,48. Cluster 2 was uniquely characterized by the upregulation of genes responsible for iron metabolism (FTH1) and iron storage (FTL) representing alternatively activated macrophages with proatherogenic potential involved in the clearance of iron derived from hemoglobin deposited in areas of intraplaque hemorrhage19,49. This phenomenon has been associated with plaque progression and features of plaque instability and is typically seen in AHA type VI complicated plaques19, the same type that is exhibited by all SYM patients in our cohort (Supplementary Table 6).
Cell-to-Cell Communications in Atherosclerotic Plaques Associated with Cerebrovascular Events
Using an established computational approach50, we predicted cell-to-cell interactions that may contribute to the distinct functional state of T cell and macrophage in atherosclerotic plaques of ASYM and SYM patients (Fig.6, Extended Fig.10).
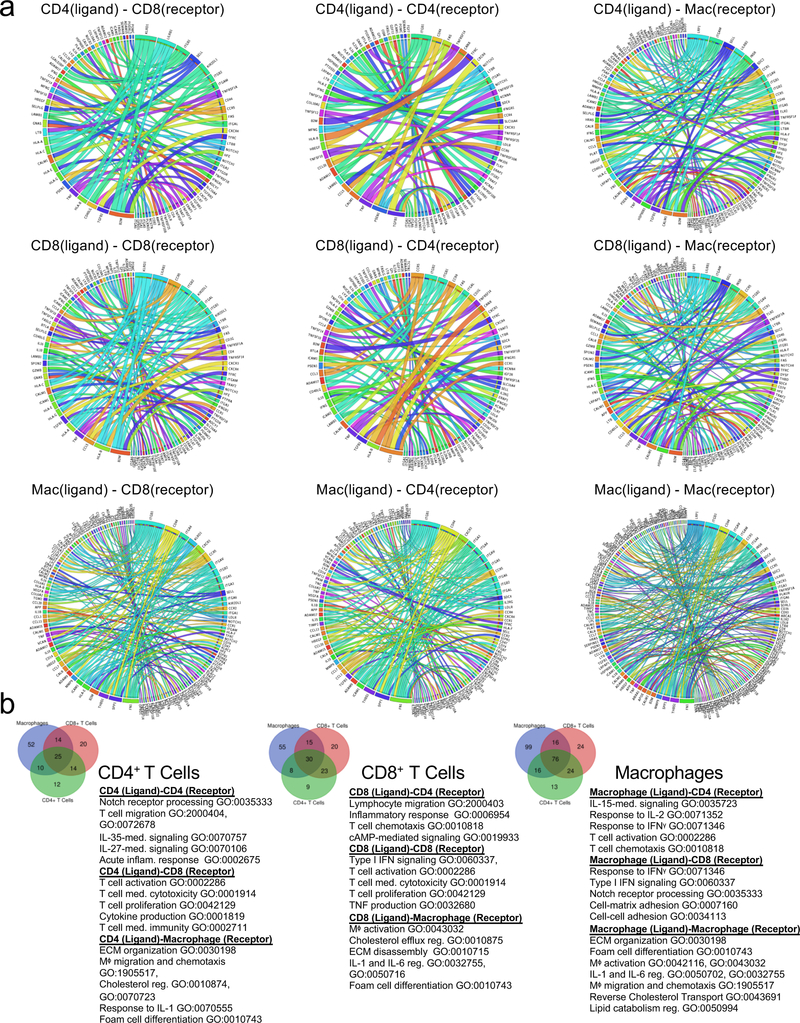
Figure 6. Cell-cell interactions associated with cerebrovascular events.

(a-c) Heat maps of the top 30 differentially-expressed ligand-receptor interactions between Symptomatic (SYM) and Asymptomatic (ASYM) plaques based on the log2 fold change across ligands and visualized using Clustergrammer. Gene ontology terms associated with the functions of the ligands and receptors are labeled to the left. Ligand-receptor interactions are shown for T cell-T cell interactions (a), T cell-macrophage interactions and macrophage-T cell interactions (b), and macrophage-macrophage interactions (d). Interactions are presented as (ligand-receptor). (d) Schematic illustrating the key innate and adaptive immune functional alterations and main differences in cell-cell communications identified in plaques from ASYM and SYM patients, see text for details.
T cell-T cell Interactions.
In ASYM plaques, we ligand-receptor interactions between CD4+ and CD8+ T cells driven by the TNF and IFNγ ligands that could contribute to their activated, pro-inflammatory phenotype (Fig.6a; Extended Fig.10a,b). Other interactions involved lymphocyte chemotaxis and migration. In SYM plaques, both CD4+ and CD8+ T cells expressed PSEN1, a gamma secretase component known to cleave the Notch receptors (NOTCH½/3) expressed by T cells in plaque, a signaling that may contribute to T cell activation51, differentiation, PD-1 expression and regulation of cytolytic functions52. A key finding was that the same ligand was predicted to interact through distinct receptors on T cells in SYM and ASYM plaques. For example, IL-15 interaction with IL15RA in ASYM plaques could promote cell proliferation, migration, and inhibition of apoptosis53. In SYM plaques, IL-15-IL2RB could regulate Th1 reprogramming54 and differentiation55, two phenotypes that emerged in SYM plaques from our CyTOF and scRNAseq analyses.
T Cell-Macrophage Interactions.
In ASYM plaques we identified adaptive signals involved in macrophage activation, migration, foam cell formation and immunomodulatory signaling (Fig.6b; Extended Fig.10a,b). T cell expressed genes encoding for ligands of TLR2, which was expressed on macrophages and could contribute to the pro-inflammatory status of plaque macrophages. Other T cell-macrophage interactions in ASYM plaques involved the regulation of lipid accumulation and foam cell formation though the expression of ligands of the proatherogenic LDL Receptor-Related Protein (LRP1) on macrophages. In SYM plaques, T cells might activate macrophages through the expression of ligands (i.e. VCAN) that bind to TLRs (i.e. TLR½) and contribute to plaque vulnerability (CCL5-CCR5)38. T cells also expressed ligands predicted to affect the reparative macrophage polarization detected in SYM plaques, through the expression of GDF11, a TGFβ superfamily member56. In ASYM plaques, macrophage ligands were predicted to interact with CD4+ and CD8+ T cell receptors involved in cell proliferation, immune responses, and plaque recruitment. ASYM macrophages exclusively expressed IL1B that was predicted to bind to IL1RAP, which encodes for a component of the interleukin 1 receptor complex, expressed by T cells. This interaction may enhance effector functions of T cells infiltrating ASYM plaques32 and corroborate our scRNA-seq findings that IL-1β signaling is exclusive to ASYM plaques. In SYM plaques, we identified fewer ligand-receptor interactions between macrophages and T cells which included interactions involved in inflammatory response, TCR signaling and recruitment into SYM plaques (Fig.6b; Extended Fig.10a,b).
Macrophage-Macrophage Interactions.
We detected diverse and distinctive communication patterns in autocrine macrophage interactions. Specifically, macrophage-macrophage interactions in ASYM plaques could induce self-activation and pro-inflammatory interactions via, self-recruitment, and IL-1 signaling via IL1B binding IL1RAP and its regulation through the binding of IL1R2. Also macrophages could stimulate extracellular matrix remodeling through the expression of MMP9 and angiogenesis through VEGFA. In SYM plaques, lesional macrophages expressed chemoattractants and cytokines involved cell migration, and inflammatory responses. Additionally, SYM macrophages may be involved self-maintaining the reparative M2-like phenotype through the expression of the differentiation M2 marker F13A1 (Fig.6c; Extended Fig.10a,b).
DISCUSSION
In this study, we provide a first single-cell immune mapping of plaques and paired blood in patients with atherosclerosis that uncovered new innate and adaptive immune dysregulation at the atherosclerotic site associated with clinical cerebrovascular events. Understanding the contribution of the immune system to human atherogenesis has been challenging. Human plaque immune composition has been inferred using deconvolution methods on bulk RNA-seq data from atherosclerotic tissue and proof-of-concept CyTOF analysis of an individual plaque14. Given that bulk RNA-seq approaches are limited to averaging gene expression patterns across whole tissues, single-cell technologicies represent a step forward, allowing precise measurements of individual cell phenotypical and functional variations57 that have the potential of changing our conceptual understanding of human vascular biology and disease state.
Our study is the first and largest to integrate CyTOF, CITE-seq and scRNA-seq to study the immune composition of human plaques and to identify specific immune dysregulation associated with clinical CV events. We identified unique differences and highly specialized functions of plaque T cells. Not only T cells were prominent in plaques but they were more activated, differentiated, and exhausted compared to their blood counterparts. Plaque T cells expressed high levels of PD-1, a marker of T cell exhaustion that is upregulated upon T cell activation23. This was confirmed at the transcriptional level by an exhaustion gene expression signature (i.e. EOMES, LAG3) similar to that of exhausted T cells in the tumor microenvironment23. The co-existence of exhausted and activated T cell subsets within the same plaque, suggested that highly activated T cells may initiate an exhaustion reprogramming, the progressive loss of T cell functions, possibly sustained by chronic unresolving plaque inflammation23,24. Since our analysis of symptomatic plaques is intrinsically limited to lesions following acute CV events, we cannot exclude that T cell exhaustion is initiated by T cell overactivation triggered by plaque disruption. CyTOF analysis on plaque-derived immune cells also identified two subsets of macrophages, resembling the classically-activated M1 and alternatively-activated M2 phenotypes1,25. Plaque macrophages were more resolved at the single-cell transcriptional level, indicating a diverse functional heterogeneity of these cells in plaque. Distinct macrophage subsets displayed activated and pro-inflammatory functional states, expressed genes involved in lipid metabolism, resembling foam cell functions, and showed unique anti-inflammatory transcriptional signatures. These data highlight a spectrum of functional specialization of lesional macrophages within the human plaque microenvironment that is not accurately reflected by the M1 and M2-phenotypes resolved by canonical surface protein marker analysis1,25.
Single-cell proteomics and transcriptomics underscored new immune dysregulation in plaques associated with recent clinical CV events. Plaques of symptomatic patients showed a significant expansion of an activated EM CD4+ T cell subset. Single-cell transcriptomics highlighted distinctive alterations of both plaque CD4+ and CD8+ T cells associated with recent CV events. In symptomatic patients, both T cell lineages presented gene expression signatures largely consistent with activation, differentiation, and exhaustion. Conversely, T cells were mostly activated in plaques of asymptomatic patients. Cell-cell interaction analysis showed that these functional states were tightly regulated by interactions with other T cells and macrophages. Previous murine studies have shown that PD-1 signaling, a regulator of T-cell exhaustion, is required to modulate atherogenic responses of activated T cells in the arterial wall and its inhibition results in aggravated atherosclerosis58. Our data showed that T cell exhaustion is subset-specific and co-exists with activated T cells in human plaques from patients with recent CV events. This suggests unforeseen and complex roles of exhaustion in human atherosclerosis with potential clinical implications. The discovery that PD-1 inhibitors reverse anergy of tumor T cells has fundamentally changed the therapeutic options and prognosis for patients with advanced malignancies59. Our findings that exhausted T cells expressing PD-1 exist in atherosclerotic plaques suggest that PD-1 inhibitors may activate T cells in plaques. Considering that T cell activation aggravates atherosclerosis1, treatment with PD-1 inhibitors may have unanticipated consequences in cancer patients with underlying CV disease. Additionally, the greater exhaustion seen plaques of patients following CV events suggests that any possible off-target effect may have worse consequences in patients with recent history of stroke or TIA, who are already at hightened risk of recurrent ischemic events60. Future cardio-oncology monitoring studies designed to investigate unrecognized CV side effects of increasingly used immune checkpoint inhibitors59 would be useful to test this hypothesis and help improve patient selection and cardiovascular monitoring in the clinical setting.
Similar to plaque T cells, macrophages of asymptomatic patients were activated and pro-inflammatory. Conversely, macrophages from plaques of patients with recent CV events displayed transcriptional signatures consistent with distinct pro-inflammatory and reparative functions, including proatherogenic cells involved in metabolism of iron from hemoglobin deposits in areas of intraplaque hemorrhage, a feature of AHA type VI plaques19,49 seen in all symptomatic patients in our cohort. As discussed for T cell exhaustion, the identification of reparative macrophages in plaque of patients with recent CV events may contribute to the healing process following plaque disruption. Overall, the specialized functions of macrophages in atherosclerotic plaques from symptomatic and asymptomatic patients were self-regulated but also dependent on T cell ligand signals, indicating unique and highly coordinated innate and adaptive cross-communications at the lesional site.
An unexpected finding was the discovery that IL-1 signaling, which was targeted in the CANTOS trial to reduce the CV risk in high risk post-MI patients11, may be differentially regulated in plaques from symptomatic and asymptomatic patients. Plaque macrophages of asymptomatic patients expressed higher levels of IL1B and IL-1 signaling was predicted to be activated compared to symptomatic patients. Additionally, we found that IL-1 may not only signal innate pro-inflammatory functions exclusively in macrophages but also in T cells, suggesting a role at the intersection of innate and adaptive immune responses by sustaining effector functions of T cells in ASYM plaques. These data may suggest that post-MI patients in the CANTOS may have been less susceptible to IL-1β inhibition at the culprit plaque site, than high-risk patients without recent CV event.
In conclusion, combining proteomic and transcriptomic single-cell analyses of atherosclerotic plaques and blood of the same patients provides a first immune atlas of human atherosclerosis and identifies new innate and adaptive immune dysregulation at the atherosclerotic site in patients with recent CV events. While our study may be considered exploratory, our results strongly support the concept that an accurate selection of patients is required to optimize treatment efficacy, and that new immunotherapies must be precisely tailored to discrete immune molecular and cellular defects.
METHODS
Human Specimens and Patient Clinical Characteristics
Forty-six patients undergoing carotid endarterectomy at the Mount Sinai Hospital were enrolled in an ongoing clinical study approved by the Institutional Review Board of the Icahn School of Medicine at Mount Sinai (IRB 11–01427). Eligible subjects gave informed written consent. The exclusion criteria were current infection, autoimmune disease, active or recurrent cancer, severe renal failure requiring dialysis, peripheral arterial occlusive disease causing pain at rest. Peripheral venous blood and atherosclerotic specimens were obtained from each patient.
Supplementary Table 1 summarizes the demographic and clinical characteristics of the entire cohort and of the subgroups used for different assays. There were 29 men and 17 women with a mean age of 72.9±8.7 years (median 73.0 years). Symptomatic patients were defined as having had a cerebral ischemic event (stroke, TIA, amaurosis fugax) ipsilateral to the collected plaque within 6 months according to validated criteria61,62. Asymptomatic patients had no ischemic events within 6 months before surgery.
Sample Collection
Fasting blood was collected preoperatively into tubes containing ACD Solution A as anti-coagulant (BD Vacutainer, 364606). Carotid atherosclerotic tissue specimens were obtained at the bifurcation point and placed immediately in Dulbecco’s modified Eagle’s medium (DMEM, Corning, 10–013-CV) supplemented with 10% fetal bovine serum (FBS, Gibco, 10082–147) on ice.
Isolation of PBMCs
Blood was processed within 2 hr of collection and spun at 1500 rpm for 10 min using an Eppendorf A-4–62 rotor. Plasma was collected, and the cell fraction was diluted 1:2 with phosphate-buffered saline (PBS, Corning, 1–031-CV), placed on Ficoll-Paque Plus (ratio 7:3) (GE Healthcare Life Sciences, 17144003), and centrifuged for 20 min at 1800 rpm at room temperature. After centrifugation, the PBMC layer was collected and washed twice in PBS at room temperature.
Cell Dissociation from Atherosclerotic Plaques
Plaque specimens were processed within 1 hr after surgery. Each specimen was washed extensively in DMEM, weighed, and digested as described 168 at 37° C for 1 hr in 10 ml of DMEM containing 10% fetal bovine serum; collagenase type IV (Sigma, C5138) at a final concentration of 1 mg/ml; and DNase (Sigma, DN25), hyaluronidase (Sigma, H3506), collagenase type XI (Sigma, C7657), and collagenase type II (Sigma, C6885), each at a final concentration of 0.3 mg/ml. The mixture was filtered consecutively through 70 μm and 40 μm cell strainers, washed twice in PBS, and centrifuged at 300 g for 8 min. Dead cells were removed with a kit (Miltenyi Biotec, 130–090-101, or Stem Cell Technologies, 17899) according to the manufacturer’s instructions. Cells were counted with an automatic cell counter.
Preparation of Paired Samples for CyTOF
Cells isolated from plaque specimens and paired PBMCs from the same patient were barcoded using a CD45-based approach and optimized for scarce clinical samples63,64, pooled, and stained with antibody panels. All antibodies were validated at the Human Immune Monitoring Center of the Icahn School of Medicine at Mount Sinai 65 and data deposited (https://flowrepository.org/id/FR-FCM-Z23S). See Supplementary Table 3 for a complete list of antibodies used in this study. Antibodies were either purchased pre-conjugated from Fluidigm, or purchased purified and conjugated in-house using MaxPar X8 Polymer Kits (Fluidigm) according to the manufacturer’s instructions. The samples were then washed and stained with cisplatin-195Pt or Intercalator Rh103 (Fluidigm, 201064 and 201103A) as a viability dye 66, washed, fixed, and permeabilized with BD Perm/Wash and Cytofix/Cytoperm buffers (BD Biosciences, 51–2090KZ and 51–2091KZ), and stored in freshly diluted 2% formaldehyde (Electron Microscopy Sciences) in PBS containing 0.125 nM Iridium 191/193 intercalator (Fluidigm, 201192) until acquisition. A limitation of our T cell focused panel consisted in the lack of anti-foxp-3 antibody, which limited the ability of dissecting the Tregs compartment in human atherosclerosis.
Acquisition and Processing of CyTOF Data
CyTOF data were acquired with a CyTOF2 using a SuperSampler fluidics system (Victorian Airships) at an event rate of <400 events per second and normalized with Helios normalizer software (Fluidigm version 6.7.1014). Barcoded samples were deconvoluted and cross-sample doublets were filtered using a Matlab-based debarcoding application67. Data were uploaded to Cytobank (https://mtsinai.cytobank.org; Cytobank, Menlo Park, CA, 7.0) for analysis and visualization.
Preprocessing of CYTOF Data
CYTOF data were processed with Cytobank to sequentially remove calibration beads, dead cells, debris, and barcodes for CD45+ plaque and CD45+ blood cells. For Cohort 1, we analyzed 41,222 plaque cells with an average of 2,748 cells per sample. For Cohort 2, we analyzed 49,088 plaque cells with an average of 2,134 cells per sample. For the T-cell MC analysis (Fig. 2) and manual gating analysis (Extended Fig. 3g,h), T cells were considered as CD3+CD14loCD16loCD56loCD19loCD64lo, and gated as such. For the manual gating analysis, T cells were further stratified as CD8+ or CD4+. Sub-classifications were defined as follows: naïve (CD45RA+CCR7+) CM (CD45RA–CCR7+), EM (CD45RA–CCR7–), EMRA (CD45RA+CCR7–), T regulatory cells (CD4+CD127loCD25+CCR4+), Th1 (CD4+CXCR3hiCCR6-), Th2 (CD4+CXCR3loCCR6+), and Th17 (CD4+CXCR3loCCR6hi) (Supplementary Table 4 for details on the gating strategy)22.
Visualizing and Clustering CyTOF Data
CyTOF data were analyzed and visualized with Cytobank. Tissue-associated inflammatory cells and matched PBMCs were analyzed with an R-based semi-automated pipeline developed at the Human Immune Monitoring Center of the Icahn School of Medicine at Mount Sinai. This pipeline uses viSNE68 as a dimensionality-reducing visualization tool and Phenograph67,69 as an automated clustering algorithm. Stratifying signatures between the sample groups were identified by calculating the fold change between mean cluster abundances across groups. P values were calculated using a paired, two-sided Student’s t-Test using the FDR correction by Benjamini-Hochberg. Fold change and p values were visualized using a volcano plot (Figs 1 and 2, and Supplementary Table 2). Clusters were manually annotated according to canonical patterns of marker expression, and Marker expression values were Z-scored and visualized with Clustergrammer (http://amp.pharm.mssm.edu/clustergrammer/). Statistical analysis of cell population frequencies and marker expression using the multiple t test with FDR correction, one-Way ANOVA test with Bonferroni’s post-hoc correction, two tailed Student’s t-test, Wilcoxon test and Spearman rank correlation were done with GraphPad Prism 8.0.
Characterization of Plaque Type
The carotid plaque specimens were fixed in formalin (Thermo Scientific, 9990244), embedded in paraffin at the Pathology Biorepository at Mount Sinai Hospital, cut into 5-μm-thick sections, placed on charged glass slides, and stained with Masson’s trichrome stain as recommended by the manufacture (American Master Tech KTMTRPT). The images were used to evaluate the plaque type according to the American Heart Association Classifications19.
TCR Variable Beta Chain Sequencing and Statistical Analysis
The CDR3 variable regions of the TCRβ chain were sequenced with the ImmunoSEQ Assay (Adaptive Biotechnologies, Seattle, WA). Genomic DNA was extracted from formalin-fixed, paraffin-embedded tissue samples and amplified by bias-controlled multiplex PCR, followed by high-throughput sequencing. Sequences were collapsed and filtered to identify and quantitate the absolute abundance of each unique TCRβ CDR3 region70. Clonality was defined as 1 – Peilou’s eveness71 and calculated as described64. Clonality values range from 0 to 1 and describe the shape of the frequency distribution: clonality values approaching 0 indicate a very even distribution of frequencies, whereas values approaching 1 indicate an increasingly asymmetric distribution in which a few clones are present at high frequencies. Correlations between clonality and CyTOF data were assessed with Spearman’s rank correlation test after running a Shapiro-Wilk test for normality. Statistical analyses were done with GraphPad Prism 8.0.
Cellular Indexing of Transcriptomes and Epitopes by sequencing (CITE-seq) and Single-Cell RNA sequencing (scRNA-seq) Sample Preparation
A protocol adapted from Stoeckius et al 201772 was used to perform CITE-seq. All antibodies used for CITE-seq were conjugated at the Human Immune Monitoring Core at Mount Sinai using ThunderLink Plus conjugation kits (Expedeon, Cat#425–0000), following manufacturer’s instructions. Single cell suspensions of atherosclerotic plaque and PBMCs were enriched for immune cells using a CD45+ enrichment kit (Miltenyi, 130–045-801), and equal proportions of CD45+ enriched blood and plaque samples were barcoded and immuno-stained on ice with the CITE-seq antibody panel (Supplemental Table 3).
The single-cell suspensions of CITE-seq and scRNA-seq samples were converted to barcoded scRNA-seq libraries by using the Chromium Single Cell 3’ Library, Gel Bead & Multiplex Kit, and Chip Kit (10x Genomics) 73,74. Chromium Single Cell 3’ v2 Reagent (10X Genomics, 120237) kit was used to prepare single-cell RNA libraries according to the manufacturer’s instructions. DNA quality was measured with an Agilent Bioanalyzer and quantity was assessed with the Qubit fluorometric assay (Invitrogen). Both CITE-seq and scRNA-seq used Cell Ranger Single-Cell Software Suite (version 2.1.1, 10X Genomics) to quality control the single-cell expression data. For CITE-seq, the Cell Ranger outputs estimated 3,573 cells with 50,701 mean reads per cell, and 3,879 median UMI counts per cell. For the scRNA-seq data a total of 7,169 cells were analyzed and averages of the Cell Ranger outputs from the n=6 patients an average of 111,670 mean reads per cell, and 2,929 median UMI counts per cell. The filtered gene-barcode matrix output from Cell Ranger, which removes barcodes with a low unique molecular identifier (UMI) count, was analyzed in further analyses using Clustergrammer275 (https://github.com/ismms-himc/clustergrammer2; https://clustergrammer.readthedocs.io/).
CITE-seq Expression Analysis
PBMC and Plaque-derived cells were identified by de-hash tagging (following the cell hashing technique from Stoeckius et al 72). The surface marker expression, from Antibody derived tags (ADT) data from a 21 antibody panel (Supplementary table 3) was analyzed using Cytobank. First, doublets between PBMCs and plaque were removed by exclusion of overlapping barcodes. Second, all individual cells were clustered using the t-SNE algorithm based on expression of all 21 markers. Third, immune cell types were determined based on the expression of canonical markers, and were thus gated directly from the viSNE plot. Correlations of the gene and surface marker expression can be found in Supplementary Fig. 3.
Ribosomal and mitochondrial genes were dropped from the gene expression analysis. Gene expression signatures of the atherosclerotic plaque and blood were derived from the cell types obtained from the ADT manual gating (CD4 T cells, CD8 T cells, B Cells, Macrophages, Monocytes, NK Cells, NKT Cells, Plasma Cells, CD1c DCs, pDCs), and used to predict cell type across the cohort of single-cell RNA-seq of atherosclerotic plaques. The gene expression data corresponding to the cells of gated populations was used for further analysis by Clustergrammer2, Ingenuity Pathway Analysis (IPA) and Enrichr (https://amp.pharm.mssm.edu/Enrichr3).
Batch Correction of Single-Cell RNA-seq data
Plaque gene expression from six subjects was combined, and batch normalized using mutual nearest neighbors (MNN) (https://github.com/chriscainx/mnnpy)76. First, gene expression data from all subjects was combined into a single dataset and suspected red blood cells were dropped (e.g. cells with high hemoglobin expression). Second, gene expression data was Arcsinh normalized and filtered to keep the top 10,000 genes based on variance across the aggregated dataset as described76. Third, MNN batch correction was performed using the one of the samples as a reference (Supplementary Fig. 4).
Cell Type Prediction of Single-Cell RNA-seq using CITE-seq Gene Expression Signatures
Cell type from single-cell gene expression data across six subjects was predicted using a gene expression signature method. First, 1,641 single cells from the CITE-seq sample were assigned a cell type based manual annotation of single cell t-SNE clustering in surface marker space (cell types include: CD4+ T cells, CD8+ T cells, B Cells, Macrophages, Monocytes, NK Cells, NKT Cells, Plasma Cells, CD1c DCs, pDCs). Second, cell type gene expression signatures were generated from the MNN batch corrected CITE-seq gene expression data. Cell type signatures were calculated by Z-scoring gene expression levels across all 7,169 cells, averaging gene expression levels across cell types, and keeping the top 200 differentially expressed genes for each cell type (using the Welch’s T-test). Third, cell type is predicted for all 7,169 cells across all samples by assigning each cell to the closest cell type signature based on cosine distance (gene expression data is Z-scored before distance calculation). Cell type prediction of the CITE-seq dataset using the MNN-batch corrected gene expression signatures matched previous ADT-based assignments 81% of the time.
Single-Cell RNA-seq and CITE-seq Gene Expression and Pathway analysis
Single-cell gene expression data was analyzed for differential genes expression across tissue types (CITE-seq), or across patient types (using aggregated scRNA-seq). Differential gene expression was calculated using UMI normalized gene expression data. When differential expression was calculated using data from multiple subject samples, which had been subject to MNN batch correction, UMI normalized gene expression data was used in place of MNN normalized data as described76. Differential expression was calculated using the Welch’s T-test with multiple hypothesis correction using Benjamini-Hochberg correction. Single-cells were hierarchically clustered using the top genes based on variance to identify subclusters within specific cell types. The hierarchical clustering was done using cosine distance with average linkage. Clusters were defined by assigning groups at a manually chosen level in the dendrogram. Differentially expressed genes across cell clusters were identified with the Welch t test with unequal variance; multiple hypothesis correction was done with the Benjamini-Hochberg correction in the SciPy Stats package, (release 1.3.0, https://docs.scipy.org/doc/scipy/reference/index.html). For our canonical pathway analysis, we analyzed cell clusters containing at least 25 cells using Ingenuity Pathway Analysis (v.2.4. QIAGEN Inc.). The top 5000 DEGs corresponding to the identified cell clusters were investigated with the gene enrichment analysis tool Enrichr77,78 (version Enrichr3; https://amp.pharm.mssm.edu/Enrichr3). For CITE-seq, the Enrichr pathway analysis terms were chosen from the Reactome library. Reactome, Biocarta, NCI Nature, and GO Biological Functions libraries were used to analyze the scRNA-seq data. Terms from these libraries were plotted using the combined score, which represents the p value (Fisher’s exact test) multiplied by the Z-score of the deviation from the expected rank.
Cell Type Ligand-Receptor Interaction
Potential ligand-receptor interaction between one set of ligand expressing cells and another set of receptor expressing cells is calculated as the average of the product of ligand and receptor expression (respectively from set one and two) across all single-cell pairs:
I= interaction score between ligand expressing cells in set one and receptor expressing cells in set two
li= ligand expression of cell i in cell set one
rj= receptor expression of cell j in cell set two
n= number of cells in set one
m= number of cells in set two
Prior knowledge ligand and receptor interactions were obtained from Ramilowski et al79. Cell types were obtained from the 7,169 cell MNN batch corrected dataset and gene expression levels were calculated using UMI normalized data. Potential ligand-receptor interactions were calculated for three cell types (CD4 T Cells, CD8 T Cells, and Macrophages) resulting in nine cell-type/cell-type interaction scores. Visualization of the interactions was performed using CIRCOS plots (Circos Table viewer v0.63–9; http://mkweb.bcgsc.ca/tableviewer/), and Clustergrammer2. Comparison of receptor-ligand pairs between cell types were analyzed visualize using a Venn diagram generate from (http://bioinformatics.psb.ugent.be/webtools/Venn/).
Differential regulation of ligand-receptor interactions between symptomatic and asymptomatic cells was identified by comparing single-cell/single-cell ligand-receptor interaction scores for symptomatic and asymptomatic cells. Fold change of symptomatic vs asymptomatic interaction scores were calculated using the average interaction scores from symptomatic and asymptomatic. The significance of differential regulation was assessed by comparing the distributions of cell-cell ligand-receptor interaction scores from symptomatic and asymptomatic cells using the Welch’s T-test. Symptomatic vs Asymptomatic differentially regulated interactions were identified based on the following 4 criteria: (1) one percent of cells must express the ligand and receptor of interest in either symptomatic or asymptomatic cells, (2) the interaction score of symptomatic or asymptomatic cells must be at least half of the baseline interaction score (defined as the interaction score between all cells in the dataset), (3) the log2 fold change of the interaction score (symptomatic vs asymptomatic) must be greater than 0.5, (4) the P-value of the Welch’s T-test with multiple hypothesis correction (Benjamini-Hochberg) must be less than 0.05. For visualization, log2 Fold Change values were clipped at +/−10.
Data and Software Availability
The data discussed in this publication are deposited in Figshare (https://figshare.com/s/c00d88b1b25ef0c5c788, DOI: 10.6084/m9.figshare.9206387) and Git-Hub with links to interactive Jupiter notebooks are provided (https://github.com/giannarelli-lab/Single-Cell-Immune-Profiling-of-Atherosclerotic-Plaques, DOI: 10.5281/zenodo.3361716). FASTQ files that also contains unpublished data from cell types not included in this publications are available upon request to the correspondent author.
Extended Data
Extended Data Fig. 1. Study overview.

(a) Schematic illustration of the collection and processing of paired atherosclerotic plaque and blood from each patient. (b) Schematic illustration of the CyTOF and CITE-seq studies of paired atherosclerotic tissue and blood. Immune cells from blood and plaque were used in CyTOF mass cytometry studies where data were defined using MetaLouvain clustering and Manual Gating. CITE-seq on blood and plaque cells related the surface marker expression of individual cells to the cell’s transcriptome. (c) Schematic illustration of single-cell analysis of plaques from patients with symptomatic disease (stroke or TIA) as compared to patients without symptomatic disease (no recent stroke): a three tier approach. The analysis included single-cell proteomic data from CyTOF studies, gene expression data from scRNA-seq studies, and cell-cell interaction studies based on patterns of ligand and receptor expression. ADT: Antibody-tag data from CITE-seq; GEX: gene expression data from CITE-seq.
Extended Data Fig. 2. Definition of MetaClusters from Cohort 1.

(a) Representative ViSNE plots of Louvain clustered immune cells (n=9,490 cells) overlaid by protein expression in spectral colors. (b) Scatter bar plot of MC frequencies in blood and plaque from 15 patients. Statistical significance was determined using a two-sided unpaired t-test with multiple comparisons corrected by two-stage linear step procedure of Benjamini, Krieger and Yekuteli with FDR=0.5%. Annotated MC communities are shown on the right. (c) Scatter bar plots of blood-enriched MCs from 15 patients, showing the MC frequency stratified by tissue type. MCs are annotated by their cell type. Data were analyzed with the two-sided Wilcoxon test. Values are mean ± SD.
Extended Data Fig. 3. Tissue–specific MetaClustering and canonical T cell definition by manual gating.

(a) MetaLouvain Clustering of CD45+ cells from atherosclerotic plaque tissue from n=15 patients. (b) Average population frequency of plaque-derived MCs. (c, d) Representative Louvain clustered viSNE plot of n=4,386 cells overlaid by MC distribution (c), and selected myeloid surface marker expression in spectral colors (d). (e) Volcano plot of the difference of MC frequencies in ASYM (n=8 patients, left) and SYM (n=7 patients, right) atherosclerotic plaques. Statistical significance was determined using two-sided unpaired t-test with multiple comparisons corrected using the two-stage linear step up procedure of Benjamini, Krieger, and Yekutieli with FDR=0.5% (f-h) Manual gating analysis of the T-cell compartment from 24 patients. (f) viSNE plots of n=19,882 T cells overlaid by tissue origin (top left), CD4 and CD8 population (top right), effector status (bottom left), or classical definition (bottom right). (g,h) Scatter bar plots of manually gated cell populations from n=24 patients. Values are mean ± SD, p values were determined by two-sided Wilcoxon test.
Extended Data Fig. 4. Definition of the T cell compartment from Cohort 2.

(a) viSNE plots of Louvain clustered T cells (n=10,000 cells) overlaid by the protein marker expression in spectral colors. (b,) Scatter bar plots of T-cell MC frequencies in blood and plaque of n=23 patients. (c) Bar chart of MC frequencies per patient of the 23 patients. (d) Scatter bar plots of normalized surface marker expression of plaque-enriched MCs in blood and plaque. Statistical significance for (b) and (d) were determined using multiple unpaired two-sided Student’s t-tests corrected by two-stage linear step procedure of Benjamini, Krieger and Yekuteli with FDR=0.5%. For all scatter bar plots, values are mean ± SD. (e) Similarity matrix of T cell MetaClusters based on the cosine distance method
Extended Data Fig. 5. Unique T-Cell Signature in Atherosclerotic Plaques.

Scatter bar plots of normalized protein marker expression in plaque-enriched T cell MetaClusters (MCs) across 23 patients, and stratified by tissue type (a-d), and comparison of MCs 10, 11, and 20 in plaque tissue (e). Statistical analysis used an unpaired two sided Student’s t-test (a-d), and One-Way ANOVA test with Bonferroni’s post-hoc correction (e). Values are mean ± SD
Extended Data Fig. 6. Tissue–specific T cell Metaclustering identifies a replicative senescent CD8+ T cell population.

(a) Heatmap of MetaCluster communities of CD3+ T cells from atherosclerotic plaque by surface marker expression tissue (n=23). (b) Correlations between TCR clonality in plaque and the frequency of MetaCluster 25 in 8 patients by two-sided Pearson correlation test. (c) Representative viSNE plots of n=10,000 cells showing the MC distribution and expression of selected markers. (d-e) Analysis of manually gated CD8+ T cells from cohorts 1 and 2 combined (n=37 patients). (d) Representative viSNE plot overlaid by CD8+CD127+ and CD8+CD127– populations. (e) Scatter bar plot of CD8+CD127+/− frequencies from 37 patients, assessed by two-sided paired Student’s t test. Values are mean ± SD. (f) viSNE plots of n=8,086 cells overlaid with expression of T cell functional markers. (g) Scatter bar plots of the median values of T cell functional markers available between cohorts 1 and 2. CCR7, CD26, CD38, PD1, CD69 were available from 24 patients; CD27 from 25 patients, CD25, HLADR from 37 patients. p values were determined using Wilcoxon test, and values are mean ± SD. (h) Correlations between TCR clonality and CD8+CD127- cell frequency from 9 patients. Two-sided Spearman correlation test was used. (i) ViSNE plots of representative CD8+ T cell population in plaque of n=9,025 cells overlaid with CD127 expression (top), or by subpopulation: CD127+ (blue), CD127- (yellow), and Ki67+ (red) (bottom). (j) Percent of Ki67+ cells in CD127 subpopulations from 3 independent experiments (n=3). Statistic determined using a two-sided paired Student’s t test. Values are mean ± SD. (k) Representative contour plots of CD8+CD127- plaque T cells gated for CD57 expression, and the CD8+CD127-CD57+ subpopulation gated for Ki67 expression.
Extended Data Fig. 7. Analysis of the CITE-seq ADT Expression.

viSNE plots of T cells (n=2,315 cells) clustered using the ADT data, and overlaid by (a) tissue type, or expression of canonical (c) or functional (d) T cell markers. (b) Frequency of T cell subtypes per tissue. (e) Functional surface marker expression in individual cells per tissue type. For CD8+ T cells, n=379 plaque cells and n=159 blood cells. For CD4+ T cells, n=287 plaque cells and n=1,387 blood cells. The approximate P values were determined using a two-sided Mann-Whitney test, lines indicate the mean. (f, g) viSNE plots of plaque cells (n=1,708 cells) overlaid to indicate macrophage population (f), or expression of macrophage markers (g). (h) viSNE plot of clustered macrophages (n=300 cells) overlaid with CD206 expression. (i) Macrophage population of the CITE-seq experiment gated for expression of CD206 and CD64.
Extended Data Fig. 8. Single-Cell Gene Expression analysis of CD8+ and CD4+ T Cells in paired blood and plaque.

(a, b) Volcano plot of the top 5000 Differentially Expressed Genes (DEGs) (determined by two-sided Welch’s T- Test and Benjamini-Hochberg correction) in (a) CD4+ T Cells and (b) CD8+ T Cells T cells of plaque or blood. (c, d) Pathway analysis of (c) CD4+ and (d) CD8+ T cell DEGs with q<0.05 (CD4+, n=930 genes; CD8+, n=310 genes) upregulated in blood (left) and plaque (right). The combined score metric corresponds to the P value (two-sided Fisher’s exact test) multiplied by the Z-score of the deviation from the expected rank, and q values determined by Benjamini-Hochberg correction. (e, f) Heatmap of hierarchically clustered top 50 variable genes across (e) CD4+ (n=1,830 total cells, n=347 plaque cells, n=1,483 blood cells) and (f) CD8+ (n=579 total cells, n=420 plaque cells, n=159 blood cells) T cells in plaque and blood. Rows: z-scored gene expression values; columns: individual cells. Above the heatmap, categories of identified cell clusters (top) cell’s origin from plaque or blood (bottom). Below the heatmap, cluster enrichment in tissue type is displayed with p values (two-sided binomial proportions test). Boxes (right) list key genes found in clusters. (g, h) Canonical signaling pathway analysis of the top 5000 DEGs in the indicated cell clusters from (g) CD4+ and (h) CD8+ T cells.
Extended Data Fig. 9. Dysregulation of T cells between SYM and ASYM patients.

Scatter bar plots of MetaCluster (MC) frequencies and protein expression in plaque-enriched MCs from 23 patients. (a) T cell MC frequencies and MC marker expression (b-c) in plaque enriched CD4+ (b) or CD8+ (c) T cell MCs. Blood (right) and plaque (left). Asymptomatic patients (A-SYM, blue) and symptomatic patients (SYM, red). Statistics were determined by two-sided multiple t-test and FDR (1%) correction using the two-stage step up procedure of Benjamini, Krieger, and Yekuteli. Values are mean ± SD. (d) AHA plaque type classification in SYM and ASYM plaques of cohort 2 (n=23). (e, f) Volcano plot of T cell MCs (n=23 patients) according to clinical phenotype in type VI plaques from SYM and ASYM patients (e), or according to plaque type (type VI vs. type IV) in all 23 patients (f). q values determined by two-sided multiple t-test with FDR=0.5% corrected using Benjamini, Krieger and Yekuteli method.
Extended Data Fig. 10. Protein-Ligand Interactions.
(a) Circos plots of the significant ligand-receptor interactions between cell types, mediated by CD4+ T cells (top row), CD8+ T Cells (middle row), or macrophages (bottom row). (b) Venn diagrams of ligand-receptor pairs from the top 5000 genes (>0.5 Log2 fold change) show unique and overlapping paired between cell-types. Gene Ontology terms were identified for each group using Enrichr.
Supplementary Material
ACKNOWLEDGMENTS
We thank the Human Immune Monitoring Center (HIMC), in particular Oksana Mayovska, Victor Guo, Xiaochen Ivy Qin, Hui Emily Xie, Manishkumar Patel, Melanie Davila, Brian Lee, Shermineh Bradford, Laura Walker, and Kevin Tuballes. We thank Swathy Sajja and Peik Sean Chong for their coordination efforts. We are grateful to Dr. Alice Kamphorst for her critical review of this manuscript. We thank the Biorepository and Pathology Core of the Icahn School of Medicine at Mount Sinai. This work utilized mass cytometry instrumentation supported by NIH grant S10OD023547–01. This work was funded by NIH grants K23HL111339, R03HL135289. C.G. was also funded by NIH grants R21TR001739, and UH2TR002067 and partially supported by the American Heart Association (14SFRN20490315). D.F. is supported by the NIH grant 5T32HL007824–20. J.L.M.B is supported by NIH grants R01HL125863 and R21TR001739. A.M. and Z.W. are supported by NIH grants U54-HL127624 (LINCS-DCIC) and U24-CA224260 (IDG-KMC). M.M is supported by NIH grants U24 AI118644, U19 AI128949.
Footnotes
DECLARATIONS OF INTERESTS
J.L.M.B is the founder and former CEO of Clinical Gene Networks (CGN) and received financial compensation as a consultant for CGN.
REFERENCES
- 1.Tabas I & Lichtman AH Monocyte-Macrophages and T Cells in Atherosclerosis. Immunity 47, 621–634 (2017). [DOI] [PMC free article] [PubMed] [Google Scholar]
- 2.Libby P. Superficial erosion and the precision management of acute coronary syndromes: not one-size-fits-all. European heart journal 38, 801–803 (2017). [DOI] [PubMed] [Google Scholar]
- 3.Moreno PR, et al. Macrophage infiltration in acute coronary syndromes. Implications for plaque rupture. Circulation 90, 775–778 (1994). [DOI] [PubMed] [Google Scholar]
- 4.Jawien J. The role of an experimental model of atherosclerosis: apoE-knockout mice in developing new drugs against atherogenesis. Current pharmaceutical biotechnology 13, 2435–2439 (2012). [PubMed] [Google Scholar]
- 5.van der Heiden K, Hoogendoorn A, Daemen MJ & Gijsen FJ Animal models for plaque rupture: a biomechanical assessment. Thrombosis and haemostasis 115(2015). [DOI] [PubMed] [Google Scholar]
- 6.Finn AV, Nakano M, Narula J, Kolodgie FD & Virmani R. Concept of vulnerable/unstable plaque. Arteriosclerosis, thrombosis, and vascular biology 30, 1282–1292 (2010). [DOI] [PubMed] [Google Scholar]
- 7.Cochain C & Zernecke A. Protective and pathogenic roles of CD8(+) T cells in atherosclerosis. Basic Res Cardiol 111, 71 (2016). [DOI] [PubMed] [Google Scholar]
- 8.Dumitriu IE, et al. High levels of costimulatory receptors OX40 and 4–1BB characterize CD4+CD28null T cells in patients with acute coronary syndrome. Circulation research 110, 857–869 (2012). [DOI] [PubMed] [Google Scholar]
- 9.Methe H, et al. Enhanced T-helper-1 lymphocyte activation patterns in acute coronary syndromes. Journal of the American College of Cardiology 45, 1939–1945 (2005). [DOI] [PubMed] [Google Scholar]
- 10.Ghattas A, Griffiths HR, Devitt A, Lip GY & Shantsila E. Monocytes in coronary artery disease and atherosclerosis: where are we now? Journal of the American College of Cardiology 62, 1541–1551 (2013). [DOI] [PubMed] [Google Scholar]
- 11.Ridker PM, et al. Antiinflammatory Therapy with Canakinumab for Atherosclerotic Disease. The New England journal of medicine 377, 1119–1131 (2017). [DOI] [PubMed] [Google Scholar]
- 12.Ridker PM, et al. Low-Dose Methotrexate for the Prevention of Atherosclerotic Events. The New England journal of medicine 380, 752–762 (2019). [DOI] [PMC free article] [PubMed] [Google Scholar]
- 13.Cholesterol Treatment Trialists C, et al. The effects of lowering LDL cholesterol with statin therapy in people at low risk of vascular disease: meta-analysis of individual data from 27 randomised trials. Lancet 380, 581–590 (2012). [DOI] [PMC free article] [PubMed] [Google Scholar]
- 14.Winkels H, et al. Atlas of the Immune Cell Repertoire in Mouse Atherosclerosis Defined by Single-Cell RNA-Sequencing and Mass Cytometry. Circulation research 122, 1675–1688 (2018). [DOI] [PMC free article] [PubMed] [Google Scholar]
- 15.Cole JE, et al. Immune cell census in murine atherosclerosis: cytometry by time of flight illuminates vascular myeloid cell diversity. Cardiovasc Res 114, 1360–1371 (2018). [DOI] [PMC free article] [PubMed] [Google Scholar]
- 16.Cochain C, et al. Single-Cell RNA-Seq Reveals the Transcriptional Landscape and Heterogeneity of Aortic Macrophages in Murine Atherosclerosis. Circulation research (2018). [DOI] [PubMed] [Google Scholar]
- 17.Lin JD, et al. Single-cell analysis of fate-mapped macrophages reveals heterogeneity, including stem-like properties, during atherosclerosis progression and regression. JCI Insight 4(2019). [DOI] [PMC free article] [PubMed] [Google Scholar]
- 18.Moore KJ, Sheedy FJ & Fisher EA Macrophages in atherosclerosis: a dynamic balance. Nature reviews. Immunology 13, 709–721 (2013). [DOI] [PMC free article] [PubMed] [Google Scholar]
- 19.Stary HC, et al. A definition of advanced types of atherosclerotic lesions and a histological classification of atherosclerosis. A report from the Committee on Vascular Lesions of the Council on Arteriosclerosis, American Heart Association. Circulation 92, 1355–1374 (1995). [DOI] [PubMed] [Google Scholar]
- 20.Kumar BV, et al. Human Tissue-Resident Memory T Cells Are Defined by Core Transcriptional and Functional Signatures in Lymphoid and Mucosal Sites. Cell Rep 20, 2921–2934 (2017). [DOI] [PMC free article] [PubMed] [Google Scholar]
- 21.Strioga M, Pasukoniene V & Characiejus D. CD8+ CD28- and CD8+ CD57+ T cells and their role in health and disease. Immunology 134, 17–32 (2011). [DOI] [PMC free article] [PubMed] [Google Scholar]
- 22.Kamphorst AO, et al. Rescue of exhausted CD8 T cells by PD-1-targeted therapies is CD28-dependent. Science 355, 1423–1427 (2017). [DOI] [PMC free article] [PubMed] [Google Scholar]
- 23.Wherry EJ & Kurachi M. Molecular and cellular insights into T cell exhaustion. Nature reviews. Immunology 15, 486–499 (2015). [DOI] [PMC free article] [PubMed] [Google Scholar]
- 24.Yi JS, Cox MA & Zajac AJ T-cell exhaustion: characteristics, causes and conversion. Immunology 129, 474–481 (2010). [DOI] [PMC free article] [PubMed] [Google Scholar]
- 25.Moore KJ & Tabas I. Macrophages in the pathogenesis of atherosclerosis. Cell 145, 341–355 (2011). [DOI] [PMC free article] [PubMed] [Google Scholar]
- 26.Krammer PH, Arnold R & Lavrik IN Life and death in peripheral T cells. Nature reviews. Immunology 7, 532–542 (2007). [DOI] [PubMed] [Google Scholar]
- 27.Baker CM, et al. Opposing roles for RhoH GTPase during T-cell migration and activation. Proceedings of the National Academy of Sciences of the United States of America 109, 10474–10479 (2012). [DOI] [PMC free article] [PubMed] [Google Scholar]
- 28.Hogan PG Calcium-NFAT transcriptional signalling in T cell activation and T cell exhaustion. Cell Calcium 63, 66–69 (2017). [DOI] [PMC free article] [PubMed] [Google Scholar]
- 29.Cremer S, et al. Hematopoietic Deficiency of the Long Noncoding RNA MALAT1 Promotes Atherosclerosis and Plaque Inflammation. Circulation 139, 1320–1334 (2019). [DOI] [PubMed] [Google Scholar]
- 30.Huang C, et al. Exosomal MALAT1 derived from oxidized low-density lipoprotein-treated endothelial cells promotes M2 macrophage polarization. Mol Med Rep 18, 509–515 (2018). [DOI] [PubMed] [Google Scholar]
- 31.Huangfu N, et al. LncRNA MALAT1 regulates oxLDL-induced CD36 expression via activating beta-catenin. Biochem Biophys Res Commun 495, 2111–2117 (2018). [DOI] [PubMed] [Google Scholar]
- 32.Jain A, Song R, Wakeland EK & Pasare C. T cell-intrinsic IL-1R signaling licenses effector cytokine production by memory CD4 T cells. Nat Commun 9, 3185 (2018). [DOI] [PMC free article] [PubMed] [Google Scholar]
- 33.Ayroldi E, et al. Interleukin-6 (IL-6) prevents activation-induced cell death: IL-2-independent inhibition of Fas/fasL expression and cell death. Blood 92, 4212–4219 (1998). [PubMed] [Google Scholar]
- 34.Daynes RA, Dowell T & Araneo BA Platelet-derived growth factor is a potent biologic response modifier of T cells. J Exp Med 174, 1323–1333 (1991). [DOI] [PMC free article] [PubMed] [Google Scholar]
- 35.Ma J, Wang R, Fang X & Sun Z. beta-catenin/TCF-1 pathway in T cell development and differentiation. J Neuroimmune Pharmacol 7, 750–762 (2012). [DOI] [PMC free article] [PubMed] [Google Scholar]
- 36.Rollings CM, Sinclair LV, Brady HJM, Cantrell DA & Ross SH Interleukin-2 shapes the cytotoxic T cell proteome and immune environment-sensing programs. Sci Signal 11(2018). [DOI] [PMC free article] [PubMed] [Google Scholar]
- 37.Sutterwala FS, Haasken S & Cassel SL Mechanism of NLRP3 inflammasome activation. Ann N Y Acad Sci 1319, 82–95 (2014). [DOI] [PMC free article] [PubMed] [Google Scholar]
- 38.Herder C, et al. RANTES/CCL5 and risk for coronary events: results from the MONICA/KORA Augsburg case-cohort, Athero-Express and CARDIoGRAM studies. PloS one 6, e25734 (2011). [DOI] [PMC free article] [PubMed] [Google Scholar]
- 39.Lee DJ, Cox D, Li J & Greenberg S. Rac1 and Cdc42 are required for phagocytosis, but not NF-kappaB-dependent gene expression, in macrophages challenged with Pseudomonas aeruginosa. J Biol Chem 275, 141–146 (2000). [DOI] [PubMed] [Google Scholar]
- 40.Vallieres F & Girard D. IL-21 enhances phagocytosis in mononuclear phagocyte cells: identification of spleen tyrosine kinase as a novel molecular target of IL-21. Journal of immunology 190, 2904–2912 (2013). [DOI] [PubMed] [Google Scholar]
- 41.Jia D, et al. Interleukin-35 Promotes Macrophage Survival and Improves Wound Healing After Myocardial Infarction in Mice. Circulation research (2019). [DOI] [PubMed] [Google Scholar]
- 42.Tziakas DN, et al. Interleukin-8 is increased in the membrane of circulating erythrocytes in patients with acute coronary syndrome. European heart journal 29, 2713–2722 (2008). [DOI] [PubMed] [Google Scholar]
- 43.Xiao H, et al. Anti-fibrotic effects of pirfenidone by interference with the hedgehog signalling pathway in patients with systemic sclerosis-associated interstitial lung disease. Int J Rheum Dis 21, 477–486 (2018). [DOI] [PubMed] [Google Scholar]
- 44.Rigamonti E, Chinetti-Gbaguidi G & Staels B. Regulation of macrophage functions by PPAR-alpha, PPAR-gamma, and LXRs in mice and men. Arteriosclerosis, thrombosis, and vascular biology 28, 1050–1059 (2008). [DOI] [PubMed] [Google Scholar]
- 45.McInnes IB & Schett G. Cytokines in the pathogenesis of rheumatoid arthritis. Nature reviews. Immunology 7, 429–442 (2007). [DOI] [PubMed] [Google Scholar]
- 46.Pazianas M, Rhim AD, Weinberg AM, Su C & Lichtenstein GR The effect of anti-TNF-alpha therapy on spinal bone mineral density in patients with Crohn’s disease. Ann N Y Acad Sci 1068, 543–556 (2006). [DOI] [PubMed] [Google Scholar]
- 47.Mackey RH, Kuller LH & Moreland LW Update on Cardiovascular Disease Risk in Patients with Rheumatic Diseases. Rheum Dis Clin North Am 44, 475–487 (2018). [DOI] [PubMed] [Google Scholar]
- 48.Singh S, Kullo IJ, Pardi DS & Loftus EV Jr. Epidemiology, risk factors and management of cardiovascular diseases in IBD. Nat Rev Gastroenterol Hepatol 12, 26–35 (2015). [DOI] [PubMed] [Google Scholar]
- 49.Guo L, et al. CD163+ macrophages promote angiogenesis and vascular permeability accompanied by inflammation in atherosclerosis. J Clin Invest 128, 1106–1124 (2018). [DOI] [PMC free article] [PubMed] [Google Scholar]
- 50.Kumar MP, et al. Analysis of Single-Cell RNA-Seq Identifies Cell-Cell Communication Associated with Tumor Characteristics. Cell Rep 25, 1458–1468 e1454 (2018). [DOI] [PMC free article] [PubMed] [Google Scholar]
- 51.Eagar TN, et al. Notch 1 signaling regulates peripheral T cell activation. Immunity 20, 407–415 (2004). [DOI] [PubMed] [Google Scholar]
- 52.Mathieu M, Cotta-Grand N, Daudelin JF, Thebault P & Labrecque N. Notch signaling regulates PD-1 expression during CD8(+) T-cell activation. Immunology and cell biology 91, 82–88 (2013). [DOI] [PubMed] [Google Scholar]
- 53.Marra P, et al. IL15RA drives antagonistic mechanisms of cancer development and immune control in lymphocyte-enriched triple-negative breast cancers. Cancer Res 74, 4908–4921 (2014). [DOI] [PubMed] [Google Scholar]
- 54.Read KA, Powell MD, McDonald PW & Oestreich KJ IL-2, IL-7, and IL-15: Multistage regulators of CD4(+) T helper cell differentiation. Exp Hematol 44, 799–808 (2016). [DOI] [PubMed] [Google Scholar]
- 55.Waickman AT, et al. CD4 effector T cell differentiation is controlled by IL-15 that is expressed and presented in trans. Cytokine 99, 266–274 (2017). [DOI] [PMC free article] [PubMed] [Google Scholar]
- 56.Li W, et al. GDF11 antagonizes TNF-alpha-induced inflammation and protects against the development of inflammatory arthritis in mice. FASEB J 33, 3317–3329 (2019). [DOI] [PubMed] [Google Scholar]
- 57.Tanay A & Regev A. Scaling single-cell genomics from phenomenology to mechanism. Nature 541, 331–338 (2017). [DOI] [PMC free article] [PubMed] [Google Scholar]
- 58.Bu DX, et al. Impairment of the programmed cell death-1 pathway increases atherosclerotic lesion development and inflammation. Arteriosclerosis, thrombosis, and vascular biology 31, 1100–1107 (2011). [DOI] [PMC free article] [PubMed] [Google Scholar]
- 59.Darvin P, Toor SM, Sasidharan Nair V & Elkord E. Immune checkpoint inhibitors: recent progress and potential biomarkers. Exp Mol Med 50, 165 (2018). [DOI] [PMC free article] [PubMed] [Google Scholar]
- 60.Edwards JD, Kapral MK, Fang J & Swartz RH Long-term morbidity and mortality in patients without early complications after stroke or transient ischemic attack. CMAJ 189, E954–E961 (2017). [DOI] [PMC free article] [PubMed] [Google Scholar]
- 61.Herrmann J, et al. Expression of lipoprotein-associated phospholipase A(2) in carotid artery plaques predicts long-term cardiac outcome. European heart journal 30, 2930–2938 (2009). [DOI] [PMC free article] [PubMed] [Google Scholar]
- 62.Versari D, et al. Dysregulation of the ubiquitin-proteasome system in human carotid atherosclerosis. Arteriosclerosis, thrombosis, and vascular biology 26, 2132–2139 (2006). [DOI] [PubMed] [Google Scholar]
- 63.Lai L, Ong R, Li J & Albani S. A CD45-based barcoding approach to multiplex mass-cytometry (CyTOF). Cytometry. Part A : the journal of the International Society for Analytical Cytology 87, 369–374 (2015). [DOI] [PMC free article] [PubMed] [Google Scholar]
- 64.Lavin Y, et al. Innate Immune Landscape in Early Lung Adenocarcinoma by Paired Single-Cell Analyses. Cell 169, 750–765 e717 (2017). [DOI] [PMC free article] [PubMed] [Google Scholar]
- 65.Amir ED, et al. Development of a Comprehensive Antibody Staining Database Using a Standardized Analytics Pipeline. Front Immunol 10, 1315 (2019). [DOI] [PMC free article] [PubMed] [Google Scholar]
- 66.Fienberg HG, Simonds EF, Fantl WJ, Nolan GP & Bodenmiller B. A platinum-based covalent viability reagent for single-cell mass cytometry. Cytom Part A 81A, 467–475 (2012). [DOI] [PMC free article] [PubMed] [Google Scholar]
- 67.Levine JH, et al. Data-Driven Phenotypic Dissection of AML Reveals Progenitor-like Cells that Correlate with Prognosis. Cell 162, 184–197 (2015). [DOI] [PMC free article] [PubMed] [Google Scholar]
- 68.Amir el AD, et al. viSNE enables visualization of high dimensional single-cell data and reveals phenotypic heterogeneity of leukemia. Nature biotechnology 31, 545–552 (2013). [DOI] [PMC free article] [PubMed] [Google Scholar]
- 69.Blondel VD, Guillaume JL, Lambiotte R & Lefebvre E. Fast unfolding of communities in large networks. J Stat Mech-Theory E (2008). [Google Scholar]
- 70.Carlson CS, et al. Using synthetic templates to design an unbiased multiplex PCR assay. Nat Commun 4, 2680 (2013). [DOI] [PubMed] [Google Scholar]
- 71.Kirsch I, Vignali M & Robins H. T-cell receptor profiling in cancer. Mol Oncol 9, 2063–2070 (2015). [DOI] [PMC free article] [PubMed] [Google Scholar]
- 72.Stoeckius M, et al. Simultaneous epitope and transcriptome measurement in single cells. Nat Methods 14, 865–868 (2017). [DOI] [PMC free article] [PubMed] [Google Scholar]
- 73.Azizi E, et al. Single-Cell Map of Diverse Immune Phenotypes in the Breast Tumor Microenvironment. Cell 174, 1293–1308 e1236 (2018). [DOI] [PMC free article] [PubMed] [Google Scholar]
- 74.Lambrechts D, et al. Phenotype molding of stromal cells in the lung tumor microenvironment. Nature medicine 24, 1277–1289 (2018). [DOI] [PubMed] [Google Scholar]
- 75.Fernandez NF, et al. Clustergrammer, a web-based heatmap visualization and analysis tool for high-dimensional biological data. Sci Data 4, 170151 (2017). [DOI] [PMC free article] [PubMed] [Google Scholar]
- 76.Haghverdi L, Lun ATL, Morgan MD & Marioni JC Batch effects in single-cell RNA-sequencing data are corrected by matching mutual nearest neighbors. Nature biotechnology 36, 421–427 (2018). [DOI] [PMC free article] [PubMed] [Google Scholar]
- 77.Kuleshov MV, et al. Enrichr: a comprehensive gene set enrichment analysis web server 2016 update. Nucleic Acids Res 44, W90–97 (2016). [DOI] [PMC free article] [PubMed] [Google Scholar]
- 78.Chen EY, et al. Enrichr: interactive and collaborative HTML5 gene list enrichment analysis tool. BMC Bioinformatics 14, 128 (2013). [DOI] [PMC free article] [PubMed] [Google Scholar]
- 79.Ramilowski JA, et al. A draft network of ligand-receptor-mediated multicellular signalling in human. Nat Commun 6, 7866 (2015). [DOI] [PMC free article] [PubMed] [Google Scholar]
Associated Data
This section collects any data citations, data availability statements, or supplementary materials included in this article.
Supplementary Materials
Data Availability Statement
The data discussed in this publication are deposited in Figshare (https://figshare.com/s/c00d88b1b25ef0c5c788, DOI: 10.6084/m9.figshare.9206387) and Git-Hub with links to interactive Jupiter notebooks are provided (https://github.com/giannarelli-lab/Single-Cell-Immune-Profiling-of-Atherosclerotic-Plaques, DOI: 10.5281/zenodo.3361716). FASTQ files that also contains unpublished data from cell types not included in this publications are available upon request to the correspondent author.