

Abstract
1-(1-propanoylpiperidin-4-yl)-3-[4-(trifluoromethoxy)phenyl]urea (TPPU) and 1-(4-trifluoro-methoxy-phenyl)-3-(1-cyclopropanecarbonyl-piperidin-4-yl)-urea (TCPU) are potent inhibitors of soluble epoxide hydrolase (sEH) that have much better efficacy in relieving nociceptive response than the Food and Drug Administration–approved drug gabapentin in a rodent model of diabetic neuropathy. Experiments conducted in sEH knockout mice or with coadministration of a potent sEH displacer demonstrated that the pharmacokinetics of TPPU and TCPU were influenced by the specific binding to their pharmacologic target sEH, a phenomenon known as target-mediated drug disposition (TMDD). To quantitatively characterize the complex pharmacokinetics of TPPU and TCPU and gain better understanding on their target occupancy, population pharmacokinetics analysis using a nonlinear mixed-effect modeling approach was performed in the current study. The final model was a novel simultaneous TMDD interaction model, in which TPPU and TCPU compete for sEH, with TCPU binding to an additional unknown target pool with larger capacity that we refer to as a refractory pool. The total amount of sEH enzyme in mice was predicted to be 16.2 nmol, which is consistent with the experimental value of 10 nmol. The dissociate rate constants of TPPU and TCPU were predicted to be 2.24 and 2.67 hours−1, respectively, which is close to the values obtained from in vitro experiments. Our simulation result predicted that 90% of the sEH will be occupied shortly after a low dose of 0.3 mg/kg TPPU administration, with ≥40% of sEH remaining to be bound with TPPU for at least 7 days. Further efficacy experiments are warranted to confirm the predicted target occupancy.
SIGNIFICANCE STATEMENT
Although target-mediated drug disposition (TMDD) models have been well documented, most of them were established in a single compound scenario. Our novel model represents the first TMDD interaction model for two small-molecule compounds competing for the same pharmacological target.
Introduction
Soluble epoxide hydrolase (sEH) is a major enzyme involved in metabolizing epoxy-polyunsaturated fatty acids such as epoxyeicosatrienoic acids into much less active dihydroxyeicosatrienoic acids (Tu et al., 2018), leading to partial or complete loss of their initial biologic activities. sEH is highly expressed in the liver, kidney, heart, lung, intestine, brain, and vasculature of mammals, and its increased expression is associated with inflammation and several diseases (Enayetallah et al., 2004; Sura et al., 2008; Marowsky et al., 2009). sEH is also presented in red blood cells in small amounts (Lee et al., 2019). Because inhibition of sEH stabilizes endogenous epoxyeicosatrienoic acids, sEH represents a promising therapeutic target for the treatment of inflammation, pain, cardiovascular diseases, and a variety of other disease usually involving mitochondrial dysfunction and endoplasmic reticulum stress (Lee et al., 2013, 2014; Wagner et al., 2017; Tu et al., 2018).
Effort has been made toward the discovery of the sEH inhibitors in past decades. Among the various sEH inhibitors identified, 1-(1-propanoylpiperidin-4-yl)-3-[4-(trifluoromethoxy)phenyl]urea (TPPU) and 1-(4-trifluoro-methoxy-phenyl)-3-(1-cyclopropanecarbonyl-piperidin-4-yl)-urea (TCPU) represent two particularly promising candidates because of their potent inhibition on sEH (Ostermann et al., 2015; Goswami et al., 2016; Yao et al., 2016; Guo et al., 2018). Both TPPU and TCPU have demonstrated much better efficacy in relieving nociceptive response than the Food and Drug Administration–approved drug gabapentin in a rodent model of diabetic neuropathy (Lee et al., 2019). In vitro binding kinetic experiments with mouse sEH showed that TPPU and TCPU have small dissociation rate constants [koff = (8.52 ± 0.47) × 10−4 and (9.9 ± 0.1) × 10−4 second−1 respectively], which indicates their tight binding with sEH (Liu et al., 2012; Lee et al., 2014). In addition, both TPPU and TCPU have high affinity to sEH (kd = 2.5 and 0.9 nM, respectively).
Interesting characteristics in the pharmacokinetic profiles of TPPU and TCPU were observed in our novel displacement experiment conducted recently in both wild-type mice and sEH-global knockout mice (Lee et al., 2019). We have the following key observations. 1) TPPU blood concentration decreased rapidly in sEH knockout mice and cannot be measured after 48 hours using a highly sensitive mass spectrometry method with the limit of detection ≤0.4 nM. In contrast, TPPU pharmacokinetics in wild-type mice have a much longer terminal phase, with TPPU blood concentrations being measurable past 312 hours. This phenomenon may be explained by the tight binding of TPPU with sEH and the corresponding slow dissociation process of TPPU from the TPPU-sEH complex in tissues. 2) When the wild-type mice dosed with TPPU at time 0 followed by a dose of TCPU at 168 hours (i.e., 1 week later), the TPPU blood profile showed two peaks, with the first TPPU peak (∼2 hours) observed shortly after TPPU dose and the second TPPU peak (∼170 hours) observed shortly after the TCPU dose. The second peak was not observed in sEH knockout mice following the same dosing regimen. 3) Interestingly, we observed TCPU blood concentration peaks right after time 0 (TPPU added) in one group of reused mice that were administrated TCPU 2 weeks previously, which accidently supported the hypothesis that TCPU could also be displaced by TPPU reversely. Our findings strongly suggested that the pharmacokinetics of TPPU and TCPU were influenced by the specific binding to their pharmacologic target sEH, a phenomenon known as target-mediated drug disposition (TMDD) (An, 2020).
It is known that compounds exhibiting TMDD usually have complex and nonlinear pharmacokinetics, and the dose regimen selection can be quite challenging because the relationship among dose, drug exposure, and response is no longer intuitive. To optimize the dose regimen, it is important to use pharmacometric modeling approaches to elucidate the quantitative relationship between drug exposure and response. The goal of the current study was to develop a TMDD mathematical model to quantitatively characterize the complex pharmacokinetics of TPPU and TCPU that we observed in mice and gain better understanding on their target occupancy. The first TMDD mathematical model was proposed by Mager and Jusko (2001). Several different TMDD models have been published since then (Grimm, 2009; Ait-Oudhia et al., 2010; Gibiansky and Gibiansky, 2010; Yan et al., 2012; Dua et al., 2015). However, most reported TMDD models were developed in a single compound scenario and therefore cannot be adapted directly to characterize the TPPU and TCPU data we have. In the current study, we present a novel simultaneous TMDD interaction model, in which TPPU and TCPU compete for their pharmacologic target sEH, with TCPU unexpectedly binding to an additional unknown target pool with larger capacity that we refer to as a refractory to degradation pool.
Materials and Methods
Data Source
TPPU and TCPU pharmacokinetics displacement data in mice came from a published study and were used for development of the TMDD pharmacokinetics model (Lee et al., 2019). The chemical structures of TPPU and TCPU are shown in Supplemental Table 1, and study design is shown in Fig. 1. As shown in Fig. 1, two experiments were conducted, with four treatment groups in experiment 1 and three treatment groups in experiment 2 (four to six mice/group). In experiment 1, wild-type mice received a 0.3 mg/kg dose of TPPU subcutaneously at time 0 on the 1st day followed by either blank vehicle (group 1) or 3 mg/kg TCPU (group 2) at 168 hours on the 7th day. Similarly, sEH knockout mice in experiment 1 received 0.3 mg/kg s.c. dose of TPPU at time 0 on the 1st day followed by either blank vehicle (group 3) or 3 mg/kg TCPU (group 4) at 168 hours on the 7th day. In experiment 1, blood samples were collected at 0, 0.25, 0.5, 1, 2, 4, 6, 8, 24, 48, 72, 96, 120, 144, 168, 168.25, 168.5, 168, 169, 170, 172, 174, 176, 192, 216, 264, and 312 hours. In experiment 2, wild-type mice received a 0.3 mg/kg s.c. dose of TPPU at time 0 on the 1st day followed by TCPU 1 (group 1), 10 (group 2), or 0.3 mg/kg (group 3) at 168 hours on the 7th day. The wild-type mice used in group 3 of experiment 2 were reused from a previous experiment, in which the mice were given a weak sEH inhibitor, mTPPU (Supplemental Fig. 1), at 1 mg/kg s.c. 3 weeks ago followed by 3 mg/kg TCPU s.c. 1 week from the administration of mTPPU. Blood samples from experiment 2 were collected through tail nick at similar time points as those in experiment 1. The concentrations of TPPU and TCPU in mice plasma were quantified using a well characterized and quantitative liquid chromatography–tandem mass spectrometry assay as published previously (Lee et al., 2019). Lower limit of quantification for both TPPU and TCPU was 0.49 nM. The interday and intraday accuracy and precision of TPPU and TCPU were all within 15%. Detailed bioanalytical assay information has been previously reported (Lee et al., 2019).
Fig. 1.

Schematic flow diagram of animal study protocol in experiment 1 and experiment 2. Four treatment groups from wild-type or sEH-deficient mice were included in experiment 1. Three treatment groups from wild-type mice were included in experiment 2.
Population Pharmacokinetics Modeling
All pharmacokinetics data for TPPU and TCPU from both in vivo displacement experiments were analyzed simultaneously using the nonlinear mixed-effect modeling approach with NONMEM (version 7.4.3; Icon Development Solutions, Ellicott City, MD) interfaced with Pirana (version 2.9.9, http://www.pirana-software.com/). The first-order conditional estimation method with interaction and a user-defined subroutine (ADVAN13) were used to estimate the population mean values of the pharmacokinetics parameters, interindividual variability (IIV) and residual variability (RV) between observed and individually predicted blood TPPU and TCPU concentrations. Sigmaplot and RStudio (version 1.0.143, https://www.rstudio.com/) were used for graphical analysis and data handling. Data from the reused mice (experiment 2, third group) were excluded to avoid the potential inference from the previous experiment, even though this group accidentally revealed the TMDD characteristics of TCPU. TCPU data in knockout mice were also excluded because of the small sample size with outlier data. BLQ data were also excluded.
Structural Model Evaluated.
TPPU data from sEH knockout mice were used to build the TPPU base structure model. Among the different models tested (e.g., one- or two-compartment models), the one compartment model with first-order absorption and linear elimination was found to best characterize TPPU disposition in sEH knockout mice. This base structure was then incorporated with the TMDD component(s) to characterize TPPU pharmacokinetics from the wild-type mice. During the model-building process, various TMDD model structures for TPPU and TCPU were evaluated. The following are several representative models (model structure is shown in Supplemental Fig. 2).
Model with one TMDD component (Supplemental Fig. 2a).
In this model, both TPPU and TCPU have the same central pharmacophore (i.e., one-compartment, first-order absorption and elimination), but only TPPU has a TMDD component. TPPU interacted with sEH with a second-order association rate constant (kon) to form a TPPU-sEH complex. TPPU-sEH complex dissociated back to free sEH target and free drug with the first-order dissociation rate constant (koff). The compacity of sEH target (Rmax1) remained constant. The TCPU plasma concentration was assumed to directly affect the koff of TPPU.
Model with two TMDD components (Supplemental Fig. 2b).
In this model, in addition to their base structure, both TPPU and TCPU have TMDD components. TPPU and TCPU can interact with sEH with a second-order association rate constant (kon,TPPU and kon,TCPU, respectively) to form a drug-sEH complex. TPPU-sEH and TCPU-sEH can dissociate back to free drug and free sEH target with the first-order dissociation rate constants (koff,TPPU and koff,TCPU, respectively).
Model with two TMDD components plus MM process (Supplemental Fig. 2c).
This model was built on top of the model with two TMDD components, with an additional M-M elimination pathway for TCPU being incorporated in the model. The M-M kinetics were characterized by maximum rate of elimination and the Michaelis constant (Km) for elimination, not overall pharmacokinetics.
Model with two TMDD components mixing with a competitive and noncompetitive mechanism (Supplemental Fig. 2d).
This model was similar to the model with two TMDD components. The difference lies in the TCPU and TPPU replacement process. In addition to competing with free sEH enzyme, in this model, we assumed that TCPU and TPPU can also interact and replace those molecules in the bound drug-sEH complex. TCPU could bind to TPPU-sEH complex with the rate constant kTCPU->TPPU to release free TPPU and generate TCPU-sEH receptor at the same time. Inversely, TPPU could also bind to TCPU-sEH complexes with a rate constant kTPPU->TCPU to release free TCPU and generate TPPU-sEH complexes at the same time.
Model with three TMDD components (final model) (Fig. 2).
Fig. 2.

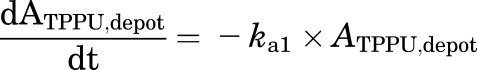
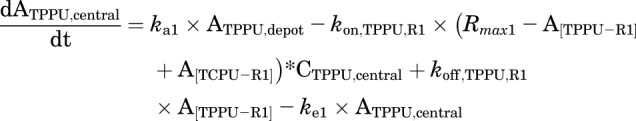
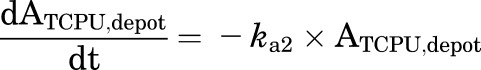
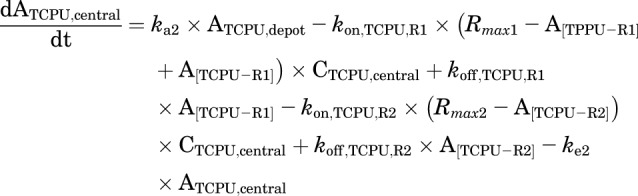
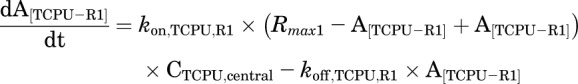
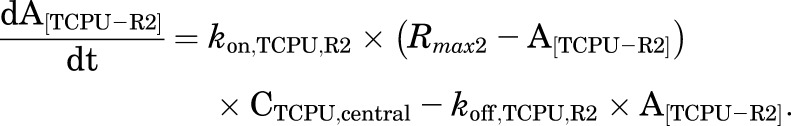
Final TMDD model describing the pharmacokinetics of TPPU and TCPU. Both TPPU and TCPU were absorbed from the depot with first-order absorption rate constants (ka1, and ka2, respectively) and eliminated from the central compartment with first-order elimination rate constants (ke1, and ke2, respectively). Both TPPU and TCPU can bind with sEH (i.e., R1) with second-order association rate constant (kon,TPPU,R1 and kon,TCPU,R1, respectively) to form drug-sEH complexes. TPPU-sEH and TCPU-sEH can dissociate back to free drug and free sEH target with the first-order dissociation rate constants (koff,TPPU,R1 and koff,TCPU,R1, respectively). In addition, TCPU can also bind to an unknown target termed a refractory pool (R2) with a different konTCPU, R2 value and dissociate from the TCPU-R2 complex with a different koff,TCPU,R2 value. The total amounts of sEH (Rmax1) and refractory pool (Rmax2) in mice are assumed to be constant.
This model was built on top of the model with two TMDD components, with an additional TMDD component for TCPU being incorporated in the model. In this model, both TPPU and TCPU can bind to sEH target (R1). In addition, TCPU can also bind to an unknown target termed a refractory pool (R2) with a different konTCPU value and dissociate from the TCPU-R2 complex with a different koffTCPU value. We assume the total amount of this unknown target (Rmax2) in mice is also a constant.
This model was our final model. The equations used to characterize this complicated TMDD model are as follows:
 |
(1) |
 |
(2) |
 |
(3) |
 |
(4) |
 |
(5) |
 |
(6) |
 |
(7) |
Stochastic Models Evaluated.
Interindividual variability.
IIV was evaluated using an exponential model, which is assumed to be normally distributed with a mean of 0 and a variance of ꙍ2.
Residual variability.
Additive, proportional, and combined proportional and additive RV models were evaluated. The residual error is assumed to be normally distributed with a mean of 0 and a variance of ס2.
Model Evaluation.
Final model selection was based on biologic and physiologic plausibility, goodness-of-fit plots, individual fitted plots, stability of parameter estimates, and objective function value. The likelihood ratio test was used for comparing nested models, for which a decrease in the NONMEM objective function (−2 log likelihood) of 3.84 points was necessary to consider the improvement in model performance statistically significant at α = 0.05.
A visual predictive check, stratified by TPPU/TCPU and murine strain (WT/KO), was performed to evaluate the predictive ability of the final model. Using the original data set, along with the final model and its parameter estimates, 1000 virtual observations at each sampling time point were simulated. The observed data were then plotted with the 5th, 50th, and 95th percentiles of the simulated data. If the model is consistent and appropriate, the observed concentrations should fall within the 5th, 50th, and 95th percentiles of the simulated concentrations. The condition (calculated from the ratio of the largest and the smallest eigenvalues) was calculated to evaluate if the model is overparametrized or ill-conditioned.
Target Occupancy Simulation
Target binding kinetics help to evaluate the time of drug action in vivo (de Witte et al., 2016). The formula of fraction of target occupancy is provided as follows:
 |
(8) |
Using the above formula, the fraction of the sEH enzyme that are occupied by TPPU can be estimated. We used our final TMDD model to simulate the time course of fraction of sEH enzyme occupied by TPPU following different doses of TCPU displacement.
Simulations were performed in NONMEM (version 7.4.3; ICON Development Solutions) using the structural models detailed in the previous section.
The following conditions were simulated:
At time 0, 0.3 mg/kg dose of TPPU was given subcutaneously to the wild-type mice, and at time 168 hours, 1 mg/kg dose of TCPU was given subcutaneously.
At time 0, 0.3 mg/kg dose of TPPU was given subcutaneously to the wild-type mice, and at time 168 hours, 3 mg/kg dose of TCPU was given subcutaneously.
At time 0, 0.3 mg/kg dose of TPPU was given subcutaneously to the wild-type mice, and at time 168 hours, 10 mg/kg dose of TCPU was given subcutaneously.
Results
In experiment 1, the pharmacokinetics of TPPU had a very long terminal phase in wild-type mice (Supplemental Fig. 3, middle panel), and this feature was not observed in the sEH knockout mice (Supplemental Fig. 3, top panel), indicating that the binding of TPPU to its pharmacological target sEH affected the disposition of TPPU. In line with this mechanism, a high dose of TCPU given at 168 hours displaced those TPPU molecules bound to sEH, resulting in a TPPU second peak that occurred at 170 hours (Supplemental Fig. 3, bottom panel). These data provided direct and strong evidence that TPPU undergoes pharmacological TMDD. Based on the data from experiment 1, the initial model we built has a TMDD component for TPPU only, with TCPU blood concentration affecting the koff of TPPU (i.e., dissociation of TPPU). However, this model was unstable and could not capture the full TCPU data set, indicating that this is not an appropriate model. Similar to TPPU, TCPU is also a potent sEH inhibitor, and therefore its disposition may also be affected by the sEH concentration and distribution. Indeed, as shown in Fig. 3, when a group of mice receiving a single dose of 3 mg/kg TCPU were administered TPPU 2 weeks later, a small TCPU peak was observed shortly after a low dose of TPPU was given, indicating that TPPU can also displace those TCPU bound to sEH. Based on this observation, we updated our model by adding a TMDD component on both TPPU and TCPU (i.e., model with two TMDD components). However, the updated model can characterize TPPU data and TCPU data from the low-dose groups (1 mg/kg) but cannot capture the TCPU data from high-dose groups (3 and 10 mg/kg). Because a total of four different doses of TCPU was evaluated (3 mg/kg from experiment 1 and 0.3, 1, and 10 mg/kg from experiment 2), we evaluated TCPU pharmacokinetics linearity and found that the nonlinearity still existed at the highest dose (i.e., 10 mg/kg) (Supplemental Fig. 4). Because the capacity of sEH was predicted to be low, the nonlinearity of TCPU observed at high doses cannot be explained by the binding to its low-capacity high-affinity pharmacological target sEH. To characterize the nonlinearity of TCPU, on top of the model with two TMDD components, we tested additional nonlinear sources of TCPU disposition, such as an M-M elimination pathway or an additional unknown target with large capacity. The different types of models that we have tested, along with their convergence status, model stability, and the objective function values, can be found from the model development history listed in Supplemental Table 2. Among the different types of models that we have constructed, the best model was found to be the model with three TMDD components, in which TPPU and TCPU compete for their pharmacologic target sEH (R1), with TCPU binding to an additional unknown target pool or refractory pool (R2) with a larger capacity. The model structure of this final model is shown in Fig. 3.
Fig. 3.

Time courses of the mean observed TPPU and TCPU blood concentrations in wild-type mice following 0.3 mg/kg TPPU at time 0 and 0.3 mg/kg TCPU at time 168 hours. The mice used in this experiment were reused from a previous experiment, in which the mice were given a weak sEH inhibitor, mTPPU, at 1 mg/kg s.c. 3 weeks ago followed by 3 mg/kg TCPU s.c. 1 week from the administration of mTPPU.
The final model estimated parameters of TPPU and TCPU pharmacokinetics are presented in Table 1. Based on the model estimation, TPPU and TCPU have similar absorption rate constants (0.961 vs. 0.730 hour−1, respectively), volume of distribution (0.0231 vs. 0.0158 l, respectively) and clearance (0.0017 vs. 0.0014 l/h, respectively). When TPPU and TCPU competed for sEH binding site, both the association rate constant and dissociate rate constant of TCPU (0.0779 nM−1 hour−1 and 2.67 hour−1, respectively) were similar with that of TPPU (0.0918 nM−1 hour−1 and 2.24 hour−1, respectively). The binding of TCPU to the unknown target is much weaker, as reflected by the smaller kon of 0.0275 nM−1 hour−1 and large koff of 11.9 hour−1. The capacity of sEH (Rmax1) and the unknown target (Rmax2) were estimated to be 16.2 and 46.6 nmol, respectively. In the final model, IIV terms were placed on the volume distribution, clearance, and absorption rate constant of TPPU and TCPU; a combined proportional and additive residual error model best described the unexplained RV. Interindividual variability estimates on V, CL, and ka of TPPU and TCPU can be found from Table 1. The calculated shrinkage for interindividual variability estimates in the final model ranges from 2% to 67%. Shrinkage above 30% may influence the power of the diagnostics for individual predicted parameters and concentrations. However, removing the IIV on V, ka, and koff of TCPU negatively impacts the model stability and fit. Condition number (calculated from the ratio of the largest and the smallest eigenvalues) of the final model is 161. Because this value is less than 1000, it indicates that the model is not overparametrized or ill-conditioned.
TABLE 1.
Estimated parameters from the final TMDD model
| Parameters (unit) | Definition | Estimate | %RSE | Shrinkage |
|---|---|---|---|---|
| V2 (L) | TPPU central volume of distribution | 0.0231 | 13 | |
| V4 (L) | TCPU central volume of distribution | 0.0158 | 18 | |
| CL2 (L/h) | TPPU clearance | 0.0017 | 8 | |
| CL4 (L/h) | TCPU clearance | 0.0014 | 17 | |
| KA1 (h−1) | TPPU first-order absorption rate constant | 0.961 | 10 | |
| KA3 (h−1) | TCPU first-order absorption rate constant | 0.73 | 12 | |
| kon TPPU, R1 (nM−1h−1) | TPPU second-order association rate constant to sEH | 0.0918 | 20 | |
| koff TPPU, R1 (h−1) | TPPU first-order dissociation rate constant from sEH | 2.24 | 20 | |
| kon TCPU, R1 (nM−1h−1) | TCPU second-order association rate constant to sEH | 0.0779 | 44 | |
| koff TCPU, R1 (h−1) | TCPU first-order dissociation rate constant from sEH | 2.67 | 91 | |
| kon TCPU, R2 (nM−1h−1) | TCPU second-order association rate constant to unknown receptor | 0.0275 | 96 | |
| koff TCPU, R2 (h−1) | TCPU first-order dissociation rate constant from unknown receptor | 11.9 | 92 | |
| Rmax1 (nmol) | Total sEH amount | 16.2 | 4 | |
| Rmax2 (nmol) | Total unknown target amount | 46.6 | 20 | |
| ꙍ 2V2 | Variance of interindividual variability on V2 | 0.353 | 31 | 5 |
| ꙍ 2V4 | Variance of interindividual variability on V4 | 0.178 | 42 | 35 |
| ꙍ 2cl2 | Variance of interindividual variability on V2 | 0.17 | 46 | 2 |
| ꙍ 2cl4 | Variance of interindividual variability on V2 | 0.315 | 36 | 28 |
| ꙍ 2ka1 | Variance of interindividual variability on V2 | 0.195 | 42 | 9 |
| ꙍ 2ka3 | Variance of interindividual variability on V2 | 0.0459 | 55 | 46 |
| ꙍ 2koff, TCPU,R1 | Variance of interindividual variability on V2 | 3.74 | 60 | 42 |
| ꙍ 2 koff, TCPU,R2 | Variance of interindividual variability on V2 | 0.31 | 121 | 67 |
| 1ס2 | Proportional variance of residual variability of TPPU | 0.083 | 15 | 11 |
| ס22 | Proportional variance of residual variability of TCPU | 0.0557 | 38 | 17 |
| ס32 | Additive variance of residual variability of TPPU | 18.5 | 52 | 11 |
| ס42 | Additive variance of residual variability of TCPU | 0.0381 | 14 | 17 |
To further evaluate the model performance, the model predicted TPPU and TCPU parameters, including maximum concentration, area under the concentration time curve from predose extrapolated to infinity, and terminal elimination half-life, were compared with those obtained from noncompartmental analysis using the observed data. As shown in Table 2, the model predicted values are in line with those from the noncompartmental analysis. In addition, the model-predicted koff as well as the capacity of sEH (i.e., Rmax1) were also consistent with the experimental determined values (Table 2).
TABLE 2.
Parameters comparison between observed and predicted values Data are presented as mean ± S.D.
| Compound | Dose (mg/kg) | Cmax (nM) | AUCinf (nM*h) | t1/2 (h) | koff (h−1) | sEHtotal (nmol) | |||||
|---|---|---|---|---|---|---|---|---|---|---|---|
| Observed | Predicted | Observed | Predicted | Observed | Predicted | Observed | Predicted | Observed | Predicted | ||
| TPPU | 0.3 | 436 ± 319 | 390 ± 250 | 12,100 ± 4630 | 12,700 ± 3360 | 54.3 ± 17.5 | 58.6 ± 9.33 | 2.09 (Lee et al., 2013) | 2.24 | 10.0 (Lee et al., 2019) | 16.2 |
| TCPU | 1.0 | 853 ± 207 | 971 ± 196 | 22,800 ± 3720 | 21,900 ± 3340 | 15.2 ± 2.64 | 16.3 ± 1.68 | 1.76 (Lee et al., 2013) | 2.67 | ||
| 3.0 | 9220 ± 2940 | 8740 ± 3150 | 159,000 ± 17,800 | 144,000 ± 33,400 | 10.5 ± 4.67 | 11.6 ± 2.15 | |||||
| 10.0 | 57,300 ± 11,600 | 49,800 ± 9570 | 1200,000 ± 85,500 | 102,000 ± 162,000 | 11.6 ± 0.86 | 11.7 ± 0.56 | |||||
AUCinf, area under the concentration time curve from predose extrapolated to infinity; Cmax, maximum concentration; sEHtotal, sEH total amount in rat body; t1/2, terminal elimination half-life.
The standard goodness-of-fit plot of the final model for TPPU and TCPU are shown in Fig. 4, a and b, respectively. The population- and individual-predicted concentrations versus the observed concentrations were evenly distributed around the line of identity without bias, indicating that the final model characterized both TPPU and TCPU pharmacokinetics adequately at both the population and individual levels. Additionally, the conditional weighted residuals appear distributed uniformly around the zero line when plotted either by population-predicted concentrations or by time, further indicating the absence of significant bias in the model fit.
Fig. 4.

Goodness fit plots for the final population pharmacokinetics modeling for (A) TPPU observed vs. population-predicted, (B) TPPU observed vs. individual-predicted, (C) TCPU observed vs. population-predicted, and (D) TCPU observed vs. individual-predicted. Solid black lines represent the lines of identity. Solid blue lines represent lowessline.
The time course of mean observed versus population-predicted blood concentrations of TPPU and TCPU are presented in Figs. 5–7. As shown in Fig. 5, the final model was able to adequately characterize TPPU pharmacokinetics in both sEH knockout mice (top panel) and wild-type mice without or with TCPU displacement (middle panel and bottle panel, respectively) simultaneously. This model also captured the dose-dependent displacement effect of TCPU on TPPU pharmacokinetics, which is reflected by the higher second peak of TPPU with increase in TCPU dose (Fig. 6). In addition, the final model also provided favorable fitting on TCPU pharmacokinetics following different TCPU doses (Fig. 7). To evaluate the predictive ability of the final model, a visual predictive check was performed. As shown in Supplemental Fig. 5, the solid lines, depicting the 2.5th, 50th, and 97.5th percentiles of the predicted TPPU and TCPU concentrations, cover most of the observed data and are also in close agreement with the 2.5th, 50th, and 97.5th percentiles of the observed data, confirming the adequacy of the final model.
Fig. 5.

Time courses of mean observed (symbols) and model-predicted (lines) TPPU blood concentrations following 0.3 mg/kg TPPU at time 0 in (a) sEH-deficient mice without TCPU displacement, (b) wild-type mice without TCPU displacement, and (c) wild-type mice with 3 mg/kg TCPU displacement at 168 hours.
Fig. 6.

Time courses of mean observed (symbols) and model-predicted (lines) TPPU blood concentrations when wild-type mice received 0.3 mg/kg TPPU at time 0 and different doses of TCPU (1 or 10 mg/kg) at 168 hours (n = 6 per group).
Fig. 7.

Time courses of mean observed (symbols) and model-predicted (lines) TCPU blood concentrations when wild-type mice received 0.3 mg/kg TPPU at time 0 and different doses of TCPU (1, 3, or 10 mg/kg) at 168 hours (n = 6 per group).
The simulation result for the time course of sEH target occupancy for TPPU with different doses of TCPU displacement is shown in the Fig. 8. Following 0.3 mg/kg TPPU, sEH occupancy reaches 90% shortly after TPPU administration and starts to decline after 24 hours. Based on the simulation, about 40% of sEH is still bound with TPPU after 7 days. The fraction of sEH occupied by TPPU drops dramatically shortly after TCPU is administered, and it happens in a dose-dependent manner, indicating the target displacement by TCPU.
Fig. 8.

Simulated time course of fraction of sEH occupied by TPPU when wild-type mice receive 0.3 mg/kg TPPU at time 0 and different doses of TCPU (1, 3, or 10 mg/kg) at 168 hours.
Discussion
TMDD is a term to describe the phenomenon in which the interaction between drug and its pharmacologic target, a pharmacodynamics process, affects drug disposition, a pharmacokinetics process. Although the concept of TMDD was raised by Levy (1994 25 years ago based on the unusual nonlinear pharmacokinetics of a number of small-molecule drugs, TMDD only became a widely-known concept with the proliferation of large-molecule biologics because numerous protein drugs demonstrate nonlinear pharmacokinetics imparted by TMDD because of their specific binding to their pharmacological targets (Dua et al., 2015)(Levy 1994). Because of the relatively low prevalence of TMDD in small-molecule drugs, it has been an overlooked area (An, 2017; van Waterschoot et al., 2018), and misunderstanding has evolved that “TMDD cannot occur in small-molecule compounds.” This is a clear misconception, and our study has provided direct evidence that TMDD can occur in small-molecule compounds. To verify the occurrence of pharmacological TMDD, a number of mechanism experiments have been recommended, including a pharmacokinetic experiment using pharmacological target knockout animals as well as an in vivo displacement experiment with coadministration of pharmacological target binding displacer (Veng-Pedersen et al., 1997; Retlich et al., 2009; An, 2017; An, 2020). So far, only a few groups have done such mechanism experiments to verify TMDD in large-molecule and small-molecule compounds, but none of them have done both experiments within the same study (Veng-Pedersen et al., 1997; Retlich et al., 2009) Both recommended experiments have been performed in our study, which represent an advantage of our work. Our observations of the long terminal phase of TPPU in wild-type mice while not in sEH knockout mice, along with the occurrence of a second TPPU peak following administration of TCPU, provide clear and direct evidence of pharmacological TMDD of TPPU, a potent small-molecule sEH inhibitor.
Based on the TPPU and TCPU pharmacokinetics data from both mechanism experiments, we developed a novel simultaneous TMDD interaction model, in which TPPU and TCPU compete for their pharmacologic target sEH. Based on our final model, the total amount of sEH enzyme (Rmax1) in mice was predicted to be around 16.2 nmol, which is consistent with the experimental value of 10 nmol (Lee et al., 2019). The dissociation rate constants (koff) of TPPU and TCPU were predicted to be 2.24 and 2.67 hours−1, respectively, which is close to the values (2.09 and 1.76 hours−1, respectively) obtained from the in vitro experiment. The Kd predicted by pharmacokinetic model, which is calculated by koff over kon, was 24.4 nM for TPPU and 34.3 nM for TCPU. These estimates are higher than those experimentally determined Kd values (2.5 nM for TPPU and 0.92 nM for TCPU) (Lee et al., 2019). This discrepancy is not surprising, as Kd values determined in vitro are usually measured in a closed system, which is different from the in vivo situation in which a drug is exposed to an open system. Recently, a number of studies have suggested that drug-target residence time, which is calculated as 1/koff, is a better in vitro parameter to predict in vivo efficacy than those standard in vitro potency parameters, including Kd (Copeland, 2016; Lee et al., 2019). Our model results indirectly support this recommendation, considering that the koff values determined in vitro are consistent with those estimated from the mathematical modeling using the in vivo data, whereas the Kd values determined in vitro are much smaller than the model-predicted values. The disconnection between model-predicted and in vitro–determined Kd has been reported before for other compounds (Dua et al., 2015). Although TMDD models have been well documented, most of them were established in a single-compound scenario. Our novel model represents the first TMDD interaction model for small-molecule compounds.
In our final TMDD interaction model, in addition to TPPU and TCPU competing for sEH enzyme, TCPU was predicted to bind to an additional target pool. Based on the model prediction, the capacity of this unknown target is 46.6 nmol, which is higher than sEH (16.2 nmol). In addition, TCPU was predicted to be dissociated from this target with koff value of 11.9 hours−1, which is much faster than its dissociation from sEH. We anticipate that TCPU has specific binding to this unknown target, as a second TMDD component for TCPU is required in the model to capture TCPU nonlinear pharmacokinetics observed in our experiment. It would be interesting to know what this unknown target is. In addition to sEH, many other epoxide hydrolase isozymes, including mEH, EH3, EH4, are known to be expressed in mammals. These isozymes share the similar protein structure with sEH enzyme with similar hydrolysis activity but different tissue expression and substrate preferences (Decker et al., 2009). Theoretically, if TCPU has broad inhibitory effect on epoxide hydrolase isozymes, then this model-predicted second target pool could be one of these isozymes. TCPU has a potent inhibitory effect on sEH. Whether TCPU has an inhibitory effect on other epoxide hydrolase isozymes or other unknown targets warrants further investigation.
As noted earlier, TMDD is a consequence of PD affecting pharmacokinetics. Accordingly, for compounds exhibiting TMDD, valuable information on drug binding to its pharmacological target can be extracted from the observed pharmacokinetics profile. For the TMDD interaction model that we developed for TPPU and TCPU, it can be used not only for pharmacokinetics characterization but also for sEH target occupancy prediction. Our simulation result predicted that 90% of the sEH will be occupied shortly after a low dose of 0.3 mg/kg TPPU administration, with ≥40% of sEH remaining bound with TPPU for at least 7 days. If sEH target occupancy is directly correlated with the pharmacodynamics effect, then long-lasting efficacy is expected following a single dose of TPPU. Further efficacy experiments are warranted to confirm the predicted target occupancy.
Changes in the magnitude and time course of TPPU/TCPU exposure and drug action in tissues of interest other than blood are also required to be investigated. Physiologically based pharmacokinetic model is commonly used to integrate the system components (e.g., body fluid dynamics, tissue size and composition, abundance and distribution of drug receptors, and membrane transporters in various organ and tissue compartments) and the drug-dependent component to enable the study of absorption, distribution, metabolism, and excretion (ADME).processes and mechanisms of action at the cellular level (Zhao et al., 2011). Our long-term goal is to use TPPU as a model drug to build a physiologically based pharmacokinetic–TMDD model to better describe the pharmacokinetics and target occupancy of sEH inhibitors, which could facilitate the drug design of sEH inhibitors and clinical dosage regimen design of those small-molecule drugs with strong TMDD characteristics.
Abbreviations
- IIV
interindividual variability
- kd
equilibrium constant
- mTPPU
3-(3-(trifluoromethoxy)-1-(propionlpiperidin-4-yl)-phenyl)urea
- M-M
Michaelis-Menten
- koff
first-order dissociation rate constant
- kon
second-order association rate constant
- Rmax1
capacity of sEH
- Rmax2
capacity of unknown target
- RV
residual variability
- sEH
soluble epoxide hydrolase
- TCPU
1-(4-trifluoro-methoxy-phenyl)-3-(1-cyclopropanecarbonyl-piperidin-4-yl)-urea
- TMDD
target-mediated drug disposition
- TPPU
1-(1-propanoylpiperidin-4-yl)-3-[4-(trifluoromethoxy)phenyl]urea
Authorship Contributions
Participated in research design: Hammock, Lee.
Conducted experiments: Hammock, Lee.
Contributed new reagents or analytic tools: Hammock, Lee.
Performed data analysis: Wu, An.
Wrote or contributed to the writing of the manuscript: Wu, Hammock, Lee, An.
Footnotes
This work is partially supported by National Institutes of Health National Institute of Environmental Health Sciences [Grants ES004699, ES030443, and ES024806].
 This article has supplemental material available at jpet.aspetjournals.org.
References
- Ait-Oudhia S, Scherrmann J-M, Krzyzanski W. (2010) Simultaneous pharmacokinetics/pharmacodynamics modeling of recombinant human erythropoietin upon multiple intravenous dosing in rats. J Pharmacol Exp Ther 334:897–910. [DOI] [PMC free article] [PubMed] [Google Scholar]
- An G. (2017) Small-molecule compounds exhibiting target-mediated drug disposition (TMDD): a minireview. J Clin Pharmacol 57:137–150. [DOI] [PubMed] [Google Scholar]
- An G. (2020) Concept of pharmacologic target-mediated drug disposition in large-molecule and small-molecule compounds. J Clin Pharmacol 60:149–163. [DOI] [PMC free article] [PubMed] [Google Scholar]
- Copeland RA. (2016) Drug-target interaction kinetics: underutilized in drug optimization? Future Med Chem 8:2173–2175. [DOI] [PubMed] [Google Scholar]
- Decker M, Arand M, Cronin A. (2009) Mammalian epoxide hydrolases in xenobiotic metabolism and signalling. Arch Toxicol 83:297–318. [DOI] [PubMed] [Google Scholar]
- de Witte WEA, Danhof M, van der Graaf PH, de Lange ECM. (2016) In vivo target residence time and kinetic selectivity: the association rate constant as determinant. Trends Pharmacol Sci 37:831–842. [DOI] [PubMed] [Google Scholar]
- Dua P, Hawkins E, van der Graaf PH. (2015) A tutorial on target‐mediated drug disposition (TMDD) models. CPT Pharmacometrics Syst Pharmacol 4:324–337. [DOI] [PMC free article] [PubMed] [Google Scholar]
- Enayetallah AHMED E, French RICHARD A, Thibodeau MICHAEL S, Grant DAVID F. (2004) Distribution of soluble epoxide hydrolase and of cytochrome P450 2C8, 2C9, and 2J2 in human tissues. J Histochem Cytochem 52 (4), doi: 10.1177/002215540405200403 . [DOI] [PubMed] [Google Scholar]
- Gibiansky L, Gibiansky E. (2010) Target-mediated drug disposition model for drugs that bind to more than one target. J Pharmacokinet Pharmacodyn 37:323–346. [DOI] [PubMed] [Google Scholar]
- Goswami SK, Wan D, Yang J, Trindade da Silva CA, Morisseau C, Kodani SD, Yang G-Y, Inceoglu B, Hammock BD. (2016) Anti-ulcer efficacy of soluble epoxide hydrolase inhibitor TPPU on diclofenac-induced intestinal ulcers. J Pharmacol Exp Ther 357:529–536. [DOI] [PMC free article] [PubMed] [Google Scholar]
- Grimm HP. (2009) Gaining insights into the consequences of target-mediated drug disposition of monoclonal antibodies using quasi-steady-state approximations. J Pharmacokinet Pharmacodyn 36:407–420. [DOI] [PubMed] [Google Scholar]
- Guo Y, Luo F, Zhang X, Chen J, Shen L, Zhu Y, Xu D. (2018) TPPU enhanced exercise-induced epoxyeicosatrienoic acid concentrations to exert cardioprotection in mice after myocardial infarction. J Cell Mol Med 22:1489–1500. [DOI] [PMC free article] [PubMed] [Google Scholar]
- Lee KSS, Liu J-Y, Wagner KM, Pakhomova S, Dong H, Morisseau C, Fu SH, Yang J, Wang P, Ulu A, et al. (2014) Optimized inhibitors of soluble epoxide hydrolase improve in vitro target residence time and in vivo efficacy. J Med Chem 57:7016–7030. [DOI] [PMC free article] [PubMed] [Google Scholar]
- Lee KSS, Morisseau C, Yang J, Wang P, Hwang SH, Hammock BD. (2013) Förster resonance energy transfer competitive displacement assay for human soluble epoxide hydrolase. Anal Biochem 434:259–268. [DOI] [PMC free article] [PubMed] [Google Scholar]
- Lee KSS, Yang J, Niu J, Ng CJ, Wagner KM, Dong H, Kodani SD, Wan D, Morisseau C, Hammock BD. (2019) Drug-target residence time affects in vivo target occupancy through multiple pathways. ACS Cent Sci 5:1614–1624. [DOI] [PMC free article] [PubMed] [Google Scholar]
- Levy G. (1994) Pharmacologic target-mediated drug disposition. Clin Pharmacol Ther 56:248–252. [DOI] [PubMed] [Google Scholar]
- Liu J, Lin Y-P, Morisseau C, Lee KSS, Rose TE, Hwang SH, Hammock BD. (2012) Substituted phenyl groups improve the pharmacokinetic profile of urea-based soluble epoxide hydrolase inhibitors. Faseb J 26. [DOI] [PMC free article] [PubMed] [Google Scholar]
- Liu JUN-YAN, Lin YAN-PING, Qiu HONG, Morisseau CHRISTOPHE, Rose TRISTAN E, Hwang SUNG HEE, Chiamvimonvat NIPAVAN, Hammock BRUCE D. (2013) Substituted phenyl groups improve the pharmacokinetic profile and anti-inflammatory effect of urea-based soluble epoxide hydrolase inhibitors in murine models. Eur J Pharm Sci 48 (4–5), doi: 10.1016/j.ejps.2012.12.013 . [DOI] [PMC free article] [PubMed] [Google Scholar]
- Mager DE, Jusko WJ. (2001) General pharmacokinetic model for drugs exhibiting target-mediated drug disposition. J Pharmacokinet Pharmacodyn 28:507–532. [DOI] [PubMed] [Google Scholar]
- Marowsky A, Burgener J, Falck J R, Fritschy J-M, Arand M. (2009) Distribution of soluble and microsomal epoxide hydrolase in the mouse brain and its contribution to cerebral epoxyeicosatrienoic acid metabolism. Neuroscience 163 (2), doi: 10.1016/j.neuroscience.2009.06.033 . [DOI] [PubMed] [Google Scholar]
- Ostermann AI, Herbers J, Willenberg I, Chen R, Hwang SH, Greite R, Morisseau C, Gueler F, Hammock BD, Schebb NH. (2015) Oral treatment of rodents with soluble epoxide hydrolase inhibitor 1-(1-propanoylpiperidin-4-yl)-3-[4-(trifluoromethoxy)phenyl]urea (TPPU): resulting drug levels and modulation of oxylipin pattern. Prostaglandins Other Lipid Mediat 121 (Pt A):131–137. [DOI] [PMC free article] [PubMed] [Google Scholar]
- Retlich S, Withopf B, Greischel A, Staab A, Jaehde U, Fuchs H. (2009) Binding to dipeptidyl peptidase-4 determines the disposition of linagliptin (BI 1356)--investigations in DPP-4 deficient and wildtype rats. Biopharm Drug Dispos 30:422–436. [DOI] [PubMed] [Google Scholar]
- Sura PRIYANKA, Sura RADHAKRISHNA, Enayetallah AHMED E, Grant DAVID F. (2008) Distribution and expression of soluble epoxide hydrolase in human brain. J Histochem Cytochem 56 (6), doi: 10.1369/jhc.2008.950659 . [DOI] [PMC free article] [PubMed] [Google Scholar]
- Tu R, Armstrong J, Lee KSS, Hammock BD, Sapirstein A, Koehler RC. (2018) Soluble epoxide hydrolase inhibition decreases reperfusion injury after focal cerebral ischemia. Sci Rep 8:5279. [DOI] [PMC free article] [PubMed] [Google Scholar]
- van Waterschoot RAB, Parrott NJ, Olivares-Morales A, Lavé T, Rowland M, Smith DA. (2018) Impact of target interactions on small-molecule drug disposition: an overlooked area. Nat Rev Drug Discov 17:299. [DOI] [PubMed] [Google Scholar]
- Veng-Pedersen P, Widness JA, Wang J, Schmidt RL. (1997) A tracer interaction method for nonlinear pharmacokinetics analysis: application to evaluation of nonlinear elimination. J Pharmacokinet Biopharm 25:569–593. [DOI] [PubMed] [Google Scholar]
- Wagner KM, McReynolds CB, Schmidt WK, Hammock BD. (2017) Soluble epoxide hydrolase as a therapeutic target for pain, inflammatory and neurodegenerative diseases. Pharmacol Ther 180:62–76. [DOI] [PMC free article] [PubMed] [Google Scholar]
- Yan X, Chen Y, Krzyzanski W. (2012) Methods of solving rapid binding target-mediated drug disposition model for two drugs competing for the same receptor. J Pharmacokinet Pharmacodyn 39:543–560. [DOI] [PMC free article] [PubMed] [Google Scholar]
- Yao ES, Tang Y, Liu XH, Wang MH. (2016) TPPU protects tau from H2O2-induced hyperphosphorylation in HEK293/tau cells by regulating PI3K/AKT/GSK-3β pathway. J Huazhong Univ Sci Technolog Med Sci 36:785–790. [DOI] [PubMed] [Google Scholar]
- Zhao P, Zhang L, Grillo JA, Liu Q, Bullock JM, Moon YJ, Song P, Brar SS, Madabushi R, Wu TC, et al. (2011) Applications of physiologically based pharmacokinetic (PBPK) modeling and simulation during regulatory review. Clin Pharmacol Ther 89:259–267. [DOI] [PubMed] [Google Scholar]