Abstract
The current obesity epidemic is a significant worldwide health concern. Despite the consensus that the brain regulates energy homeostasis, the neural adaptations governing obesity are unknown. Using a combination of high-throughput single-cell RNA sequencing and longitudinal in vivo two-photon calcium imaging, we surveyed functional alterations of the lateral hypothalamic area (LHA)—a highly conserved brain region that orchestrates feeding—in a mouse model of obesity. The transcriptional profile of LHA glutamatergic neurons was impacted by obesity, exhibiting changes indicative of altered neuronal activity. Encoding properties of individual LHA glutamatergic neurons were then tracked throughout obesity, revealing greatly attenuated reward responses. These data demonstrate how diet disrupts the function of an endogenous feeding suppression system to promote overeating and obesity.
One Sentence Summary:
Lateral hypothalamic glutamate neurons negatively regulate feeding and are potently modified by obesity.
Obesity affects more than 500 million adults worldwide (1), and its comorbidities present a pressing medical challenge (2). Within the brain, the LHA mediates motivated behavior, including feeding (3-6). LHA lesions abolish feeding and alter body weight regulation (7) while local electrical stimulation promotes ingestion and is rewarding (3). The LHA is molecularly and functionally diverse, comprising numerous cell types that can independently regulate food intake (8-11). We aimed to understand how obesity affects particular cells within the LHA.
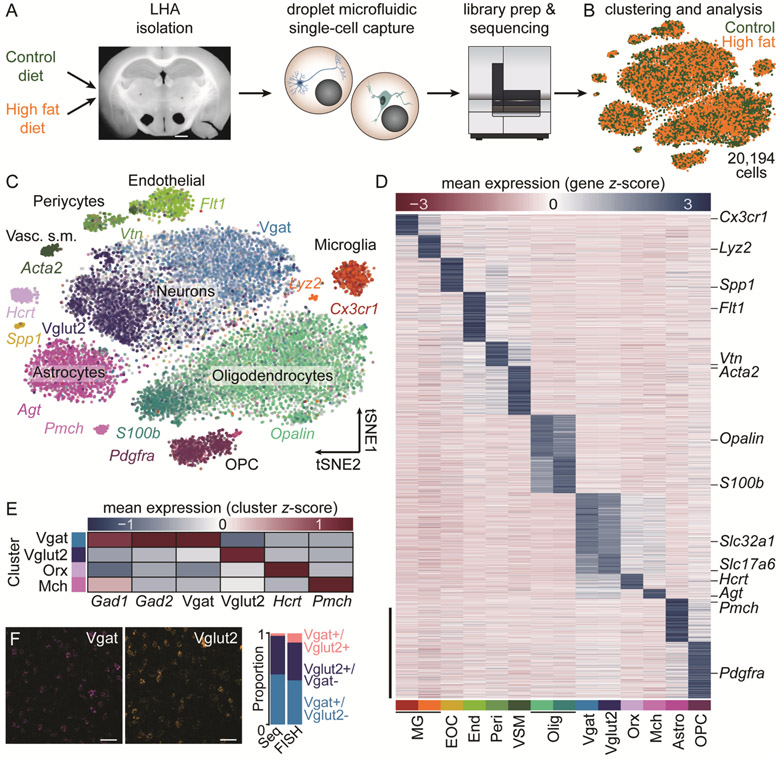
We transcriptionally profiled LHA cells in lean and obese mice maintained on control or high fat diet (HFD), respectively, using high-throughput single-cell RNA sequencing (Figs. 1A-B and S1) (12). To detect discrete cell classes, cells were clustered on principal components and reduced via t-stochastic neighbor embedding (tSNE) for subsequent feature discovery (13). We identified transcriptionally-distinct neuronal, glial, and stromal cell classes based on canonical marker distribution (Fig. 1C-E). Cellular identities and proportions were similar between sequencing and fluorescence in situ hybridization (Figs. 1F, S2, and S3), confirming the biological validity of statistical clustering.
Fig. 1. Transcriptional profiling of LHA cells following chronic HFD exposure.
A. Schematic of experimental pipeline (n=7 control mice, 10,086 cells; n=7 HFD mice, 10,108 cells). Scale bar, 1 mm. B. tSNE visualization of 20,194 cells. Control and HFD cells were clustered together. C. tSNE visualization of 14 transcriptionally distinct clusters expressing canonical markers. D. Statistically defined clusters exhibit distinct expression patterns. Scale bar, 500 genes. E. Four clusters represent known LHA neuronal populations. F. Fluorescence in situ hybridization (FISH). Scale bar, 50 μm. The proportion of cells expressing Vgat, Vglut2, or both Vgat and Vglut2 is similar for sequencing (Seq) and FISH. Astro, astrocytes; Endo, endothelial; EOC, extraosseous osteopontin-expressing cells; Mch, melanin-concentrating hormone; MG, microglia; Olig, oligodendrocytes; OPC, oligodendrocyte precursor cells; Orx, orexin/hypocretin; Peri, pericytes; VSM, vascular smooth muscle.
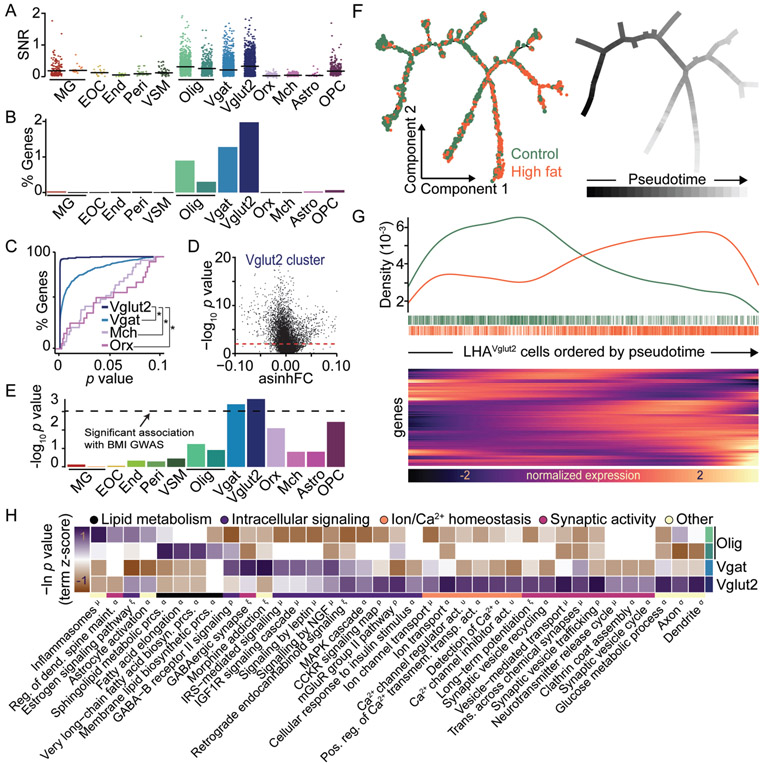
We compared differential gene expression between HFD and control animals within each cluster and observed distinct patterns of transcriptional modification to HFD across each cell type (Figs. 2 and S4A and Supplementary Data S1). However, glutamatergic neurons, expressing vesicular glutamate transporter type-2 (Vglut2 (Slc17a6); LHAVglut2), exhibited significant changes in the greatest proportion of genes (Fig. 2A-D). Consistently, LHAVglut2 neurons also contained the most significant gene-level genetic association with human body mass index (BMI) (Fig. 2E), suggesting that similar alterations within LHAVglut2 neurons may contribute to human obesity. This agrees with previous reports in which diet alters hypothalamic neurons involved in energy balance (14, 15).
Fig. 2. HFD alters the transcriptional profile of LHAVglut2 neurons.
A. Signal-to-noise ratio (SNR) of significantly altered genes (p≤0.001) within each cluster. Outliers with SNR>2 are clipped for display. B. Percent of total genes significantly altered (p≤0.0001) in ≥50% of cells per cluster. C. Cumulative distribution of p-values (p≤0.1) for differentially expressed genes (DEGs) within each neuronal cluster detected in ≥50% of cells per cluster. *p<0.0001. D. p-values vs. asinh fold-change for all genes within the Vglut2 cluster. E. Gene-level genetic association with human BMI across clusters. Dashed line, Bonferroni significance threshold. F. Pseudotime trajectories across control and HFD cells. G. HFD cells are enriched at later pseudotimes (top) and show unique gene expression patterns (bottom, abridged from Fig. S4). H. DEGs (p≤0.001) were queried against multiple annotation databases revealing altered expression in activity-dynamic-associated functional classes (see Methods). (A-E, H) DEGs between HFD and control cells were identified within each cluster (see Methods and Supplementary Data S1).
We next used LHAVglut2 cells to construct unsupervised learned trajectories in which cells are ordered according to their predicted degree of transcriptional change, referred to as pseudotime (16). LHAVglut2 HFD cells showed a gradient in the degree of transcriptional change, with enrichment of these cells at later pseudotimes. We compared differential gene expression between the most altered (late pseudotime) and least altered (early pseudotime) HFD cells along the entire trajectory and observed significant changes in the expression of genes associated with neuronal activity (Figs. 2F-G and S4B and Supplementary Data S2). Considering this, we statistically examined functional annotations in genes differentially expressed across all LHAVglut2 cells and found that LHAVglut2 cells exhibited significant alterations in annotations associated with neuronal activity including ion homeostasis, synaptic activity, and intracellular signaling. These annotations were distinct from those observed in GABAergic cells or oligodendrocytes (Figs. 2H and Supplementary Data S2) (17).
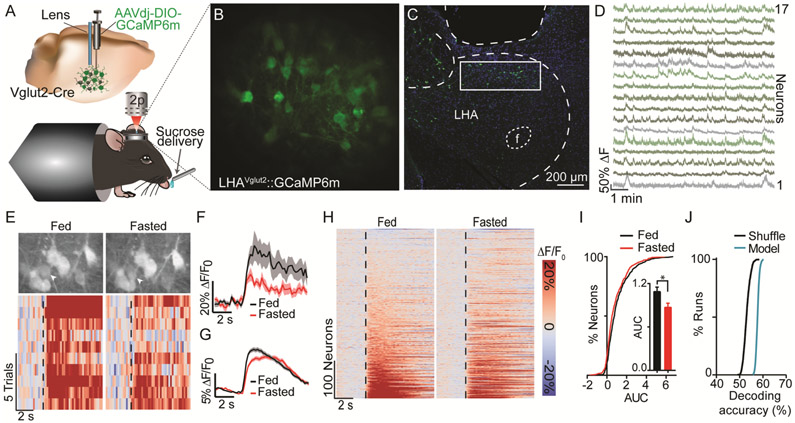
Because LHAVglut2 neurons were particularly sensitive to HFD, we sought to assess their natural activity dynamics during caloric reward consumption. We hypothesized that acute food deprivation influences LHAVglut2 activity dynamics. We infused a virus encoding Cre-dependent GCaMP6 (AAVdj-DIO-GCaMP6m) into the LHA of Vglut2-Cre mice and then implanted a microendoscopic lens ~150 μm above the injection, permitting optical access to LHAVglut2 neurons (Fig. 3A-D). In brain slices, deflections in the GCaMP signal reliably tracked LHAVglut2 action potential frequency (Fig. S5A-B). Calcium dynamics were measured in vivo with two-photon microscopy (18) as headfixed mice consumed randomly delivered sucrose rewards. Individual LHAVglut2 neurons were excited following sucrose consumption. Response magnitude depended on the mouse’s motivational state (Figs. 3E-I and S5F). Following pre-feeding, when motivation for food was low, responses of the same LHAVglut2 neurons were greater than after a 24 hr fast. This difference was independent of differences in lick rate (Fig. S5C-E), suggesting that satiety modifies LHAVglut2 reward encoding independently of specific motor output. The neural responses during sucrose consumption could thus be used to decode (19) the motivational state of each mouse (Fig. 3J). Fasting also reduced basal calcium dynamics (Fig. S5G-J). LHAVglut2 neuron stimulation transiently suppressed consummatory licking in a frequency dependent fashion and was aversive (Figs. S6 and S7) (8, 10). We next aimed to test whether obesity alters this negative feeding regulator.
Fig. 3. LHAVglut2 neurons encode satiety state.
A. Schematic of head-fixed two-photon imaging. B. Example imaging plane (mean projection). C. Confocal micrograph of lens position and GCaMP6m expression. Scale bar, 200 μm. D. extracted signals from a subset of neurons in B. E. Example neuron (arrow) whose response to sucrose was mediated by satiety. Data are aligned to sucrose consumption (dashed line). F. Average response of neuron in E. G. Population average (452 neurons; 13 mice). H. Responses from all neurons in the fasted and fed states. I. Area under the curve (AUC) distributions (*p<0.05). J. Neural activity was used to decode the mouse’s satiety state (p=0.002). Values are mean ±s.e.m.
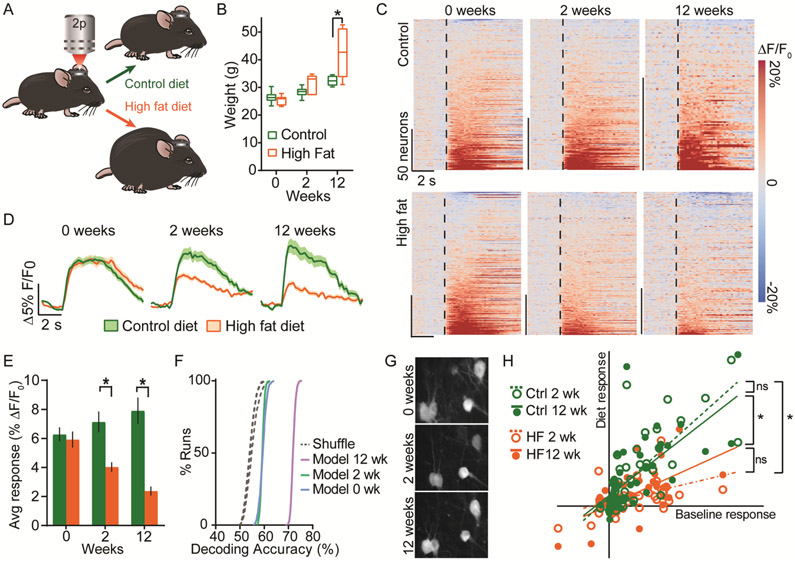
We hypothesized that LHAVglut2 neuron activity dynamics and reward encoding properties are modified by HFD. Mice from the above experiment were maintained on either HFD or control diet for 12 weeks (Fig. 4A). HFD potentiated weight gain (Fig. 4B). While LHAVglut2 neurons from control mice maintained their responsivity to sucrose consumption, LHAVglut2 neurons from HFD mice became progressively less responsive to sucrose consumption (Fig. 4C-E) and less active at rest (Fig. S8A-C). Concordantly, neural decoding of diet was most effective at 12 weeks (Figs. 4F and S8E). A subset of neurons was tracked throughout the experiment and showed similarly blunted sucrose responses following HFD (Figs. 4G-H and fig. S8, E to J), confirming that individual LHAVglut2 neurons alter their food reward encoding during obesity. Patch-clamp electrophysiology revealed that reduced excitability underlies HFD-induced LHAVglut2 suppression (Fig. S9).
Fig. 4. Chronic HFD suppresses LHAVglut2 activity.
A. Experimental design schematic. B. Mouse weights (n=7 HFD; n=6 control). C. Responses of all neurons to sucrose consumption. D. Average response of LHAVglut2 neurons to sucrose consumption during obesity. 0 weeks: 232 neurons (6 control mice), 220 neurons (7 HFD mice); 2 weeks: 188 neurons (6 control mice), 231 neurons (7 HFD mice); 12 weeks: 105 neurons (4 control mice), 201 neurons (7 HFD mice). E. Mean sucrose response magnitude during diet exposure. F. Diet was decoded from sucrose responses. Decoding was most accurate at 12 weeks (p<0.01 12 wk vs. 0 and 2 wk). G. Example of neurons tracked during obesity (mean projections). H. A subset of neurons was tracked throughout obesity (control: 44 cells, 4 mice; HFD: 33 cells, 4 mice). Sucrose response magnitudes at 2 and 12 weeks are plotted against the magnitude of the baseline (0 weeks) responses. *p<0.05.
Until now, obesity’s effects on the LHA have been unclear. We hypothesize that the excitatory LHAVglut2 signal represents the activation of a brake on feeding to suppress further food intake. Here, we demonstrate that LHAVglut2 neurons are sensitive to satiety state: when motivation for food is low, they are more excitable relative to when motivation is high. Chronic HFD modification within LHAVglut2 cells ultimately hinders their neuronal activity, thereby weakening an endogenous attenuator of feeding to promote overeating and obesity.
Although this analysis focuses on glutamatergic neurons, this dataset provides a rich resource for identifying biologically meaningful transcriptional alterations across additional LHA neuronal, glial, and stromal cell types in response to HFD. In addition to regulating consummatory behavior for food during obesity, LHAVglut2 cells also contribute to aversion (Fig. S7M-O) (8, 20-22), but it remains unclear whether these two populations are segregated. Whether LHAVglut2 neuron alterations are normalized by returning to standard diet or if they are influenced by additional homeostatic challenges (e.g., dehydration) are unknown. Further understanding multifunctionality within this population could identify novel therapeutic targets for eating disorders and obesity.
Note added in proof:
A recent paper also characterized LHA heterogeneity using single-cell RNA sequencing (23).
Supplementary Material
Acknowledgements:
We thank L. Eckman and R. Ying for assistance with mouse breeding, V. Namboodiri for analysis code, and Stuber lab members and C. Trapnell for helpful discussions.
Funding: This study was funded by grants from the National Institutes of Health (NIDDK: DK112564 (MAR), NIMH: MH093315 and MH115165 (JAM), NS007431 (MLB), NIDA: DA041184 (JMO), DA038168 and DA032750 (GDS)), the Foundation of Hope (JAM and GDS), the Brain and Behavior Research Foundation (NARSAD Young Investigator awards: JAM, JMO, and MAR), UNC Neuroscience Center Microscopy Core (P30 NS045892), the Swedish Research Council (VR Dnr: 538-2013-8864: CMB), the Swiss National Science Foundation (JB). This study represents independent research funded in part by the National Institute for Health Research (NIHR) Biomedical Research Centre at South London and Maudsley NHS Foundation Trust and King’s College London. The views expressed are those of the author(s) and not necessarily those of the NHS, the NIHR, or the Department of Health. High performance computing facilities were funded with capital equipment grants from the GSTT Charity (TR130505) and Maudsley Charity (980). This study was completed as part of approved UK Biobank study application 27546 to GB.
Footnotes
Competing interests: GB has received grant funding from and served as a consultant to Eli Lilly and has received honoraria from Illumina. CMB is a grant recipient from and has served on advisory boards for Shire. She receives royalties from Pearson and Walker. All interests are unrelated to this work.
Data and materials availability: Datasets are available on NCBI Gene Expression Omnibus (accession no. GSE130597).
References and Notes:
- 1.Finucane MM et al. , National, regional, and global trends in body-mass index since 1980: systematic analysis of health examination surveys and epidemiological studies with 960 country-years and 9.1 million participants. Lancet 377, 557–567 (2011). [DOI] [PMC free article] [PubMed] [Google Scholar]
- 2.Kopelman PG, Obesity as a medical problem. Nature 404, 635–643 (2000). [DOI] [PubMed] [Google Scholar]
- 3.Hoebel BG, Teitelbaum P, Hypothalamic control of feeding and self-stimulation. Science 135, 375–377 (1962). [DOI] [PubMed] [Google Scholar]
- 4.Rossi MA, Stuber GD, Overlapping Brain Circuits for Homeostatic and Hedonic Feeding. Cell Metab, (2017). [DOI] [PMC free article] [PubMed]
- 5.Wise RA, Hypothalamic motivational systems: fixed or plastic neural circuits? Science 162, 377–379 (1968). [DOI] [PubMed] [Google Scholar]
- 6.Margules DL, Olds J, Identical "feeding" and "rewarding" systems in the lateral hypothalamus of rats. Science 135, 374–375 (1962). [DOI] [PubMed] [Google Scholar]
- 7.Anand BK, Dua S, Shoenberg K, Hypothalamic control of food intake in cats and monkeys. J Physiol 127, 143–152 (1955). [DOI] [PMC free article] [PubMed] [Google Scholar]
- 8.Jennings JH, Rizzi G, Stamatakis AM, Ung RL, Stuber GD, The inhibitory circuit architecture of the lateral hypothalamus orchestrates feeding. Science 341, 1517–1521 (2013). [DOI] [PMC free article] [PubMed] [Google Scholar]
- 9.Jennings JH et al. , Visualizing hypothalamic network dynamics for appetitive and consummatory behaviors. Cell 160, 516–527 (2015). [DOI] [PMC free article] [PubMed] [Google Scholar]
- 10.Stamatakis AM et al. , Lateral Hypothalamic Area Glutamatergic Neurons and Their Projections to the Lateral Habenula Regulate Feeding and Reward. J Neurosci 36, 302–311 (2016). [DOI] [PMC free article] [PubMed] [Google Scholar]
- 11.Nieh EH et al. , Decoding neural circuits that control compulsive sucrose seeking. Cell 160, 528–541 (2015). [DOI] [PMC free article] [PubMed] [Google Scholar]
- 12.Macosko EZ et al. , Highly Parallel Genome-wide Expression Profiling of Individual Cells Using Nanoliter Droplets. Cell 161, 1202–1214 (2015). [DOI] [PMC free article] [PubMed] [Google Scholar]
- 13.Satija R, Farrell JA, Gennert D, Schier AF, Regev A, Spatial reconstruction of single-cell gene expression data. Nat Biotechnol 33, 495–502 (2015). [DOI] [PMC free article] [PubMed] [Google Scholar]
- 14.Henry FE, Sugino K, Tozer A, Branco T, Sternson SM, Cell type-specific transcriptomics of hypothalamic energy-sensing neuron responses to weight-loss. Elife 4, (2015). [DOI] [PMC free article] [PubMed] [Google Scholar]
- 15.Chen R, Wu X, Jiang L, Zhang Y, Single-Cell RNA-Seq Reveals Hypothalamic Cell Diversity. Cell Rep 18, 3227–3241 (2017). [DOI] [PMC free article] [PubMed] [Google Scholar]
- 16.Trapnell C et al. , The dynamics and regulators of cell fate decisions are revealed by pseudotemporal ordering of single cells. Nat Biotechnol 32, 381–386 (2014). [DOI] [PMC free article] [PubMed] [Google Scholar]
- 17.Kuleshov MV et al. , Enrichr: a comprehensive gene set enrichment analysis web server 2016 update. Nucleic Acids Res 44, W90–97 (2016). [DOI] [PMC free article] [PubMed] [Google Scholar]
- 18.McHenry JA et al. , Hormonal gain control of a medial preoptic area social reward circuit. Nat Neurosci 20, 449–458 (2017). [DOI] [PMC free article] [PubMed] [Google Scholar]
- 19.Otis JM et al. , Prefrontal cortex output circuits guide reward seeking through divergent cue encoding. Nature 543, 103–107 (2017). [DOI] [PMC free article] [PubMed] [Google Scholar]
- 20.Nieh EH et al. , Inhibitory Input from the Lateral Hypothalamus to the Ventral Tegmental Area Disinhibits Dopamine Neurons and Promotes Behavioral Activation. Neuron 90, 1286–1298 (2016). [DOI] [PMC free article] [PubMed] [Google Scholar]
- 21.Lazaridis I et al. , A hypothalamus-habenula circuit controls aversion. Mol Psychiatry, (2019). [DOI] [PMC free article] [PubMed] [Google Scholar]
- 22.Trusel M et al. , Punishment-Predictive Cues Guide Avoidance through Potentiation of Hypothalamus-to-Habenula Synapses. Neuron, (2019). [DOI] [PubMed]
- 23.Vong L et al. , Leptin action on GABAergic neurons prevents obesity and reduces inhibitory tone to POMC neurons. Neuron 71, 142–154 (2011). [DOI] [PMC free article] [PubMed] [Google Scholar]
- 24.Sparta DR et al. , Construction of implantable optical fibers for long-term optogenetic manipulation of neural circuits. Nat Protoc 7, 12–23 (2011). [DOI] [PMC free article] [PubMed] [Google Scholar]
- 25.Chen TW et al. , Ultrasensitive fluorescent proteins for imaging neuronal activity. Nature 499, 295–300 (2013). [DOI] [PMC free article] [PubMed] [Google Scholar]
- 26.Resendez SL et al. , Visualization of cortical, subcortical and deep brain neural circuit dynamics during naturalistic mammalian behavior with head-mounted microscopes and chronically implanted lenses. Nat Protoc 11, 566–597 (2016). [DOI] [PMC free article] [PubMed] [Google Scholar]
- 27.Ting JT, Daigle TL, Chen Q, Feng G, Acute brain slice methods for adult and aging animals: application of targeted patch clamp analysis and optogenetics. Methods Mol Biol 1183, 221–242 (2014). [DOI] [PMC free article] [PubMed] [Google Scholar]
- 28.Johnson WE, Li C, Rabinovic A, Adjusting batch effects in microarray expression data using empirical Bayes methods. Biostatistics 8, 118–127 (2007). [DOI] [PubMed] [Google Scholar]
- 29.Leek JT, Johnson WE, Parker HS, Jaffe AE, Storey JD, The sva package for removing batch effects and other unwanted variation in high-throughput experiments. Bioinformatics 28, 882–883 (2012). [DOI] [PMC free article] [PubMed] [Google Scholar]
- 30.Brennecke P et al. , Accounting for technical noise in single-cell RNA-seq experiments. Nat Methods 10, 1093–1095 (2013). [DOI] [PubMed] [Google Scholar]
- 31.Andrews TS, Hemberg M, Modelling dropouts for feature selection in scRNASeq experiments. bioRxiv, (2017). [Google Scholar]
- 32.McDavid A et al. , Data exploration, quality control and testing in single-cell qPCR-based gene expression experiments. Bioinformatics 29, 461–467 (2013). [DOI] [PMC free article] [PubMed] [Google Scholar]
- 33.Hoffman MM et al. , Unsupervised pattern discovery in human chromatin structure through genomic segmentation. Nat Methods 9, 473–476 (2012). [DOI] [PMC free article] [PubMed] [Google Scholar]
- 34.de Leeuw CA, Mooij JM, Heskes T, Posthuma D, MAGMA: generalized gene-set analysis of GWAS data. PLoS Comput Biol 11, e1004219 (2015). [DOI] [PMC free article] [PubMed] [Google Scholar]
- 35.Skene NG et al. , Genetic identification of brain cell types underlying schizophrenia. Nat Genet 50, 825–833 (2018). [DOI] [PMC free article] [PubMed] [Google Scholar]
- 36.Willer CJ, Li Y, Abecasis GR, METAL: fast and efficient meta-analysis of genomewide association scans. Bioinformatics 26, 2190–2191 (2010). [DOI] [PMC free article] [PubMed] [Google Scholar]
- 37.Bulik-Sullivan BK et al. , LD Score regression distinguishes confounding from polygenicity in genome-wide association studies. Nat Genet 47, 291–295 (2015). [DOI] [PMC free article] [PubMed] [Google Scholar]
- 38.Watanabe K, Taskesen E, van Bochoven A, Posthuma D, Functional mapping and annotation of genetic associations with FUMA. Nat Commun 8, 1826 (2017). [DOI] [PMC free article] [PubMed] [Google Scholar]
- 39.McCarthy S et al. , A reference panel of 64,976 haplotypes for genotype imputation. Nat Genet 48, 1279–1283 (2016). [DOI] [PMC free article] [PubMed] [Google Scholar]
- 40.Bycroft C et al. , Genome-wide genetic data on ~500,000 UK Biobank participants. bioRxiv, (2017). [Google Scholar]
Associated Data
This section collects any data citations, data availability statements, or supplementary materials included in this article.


