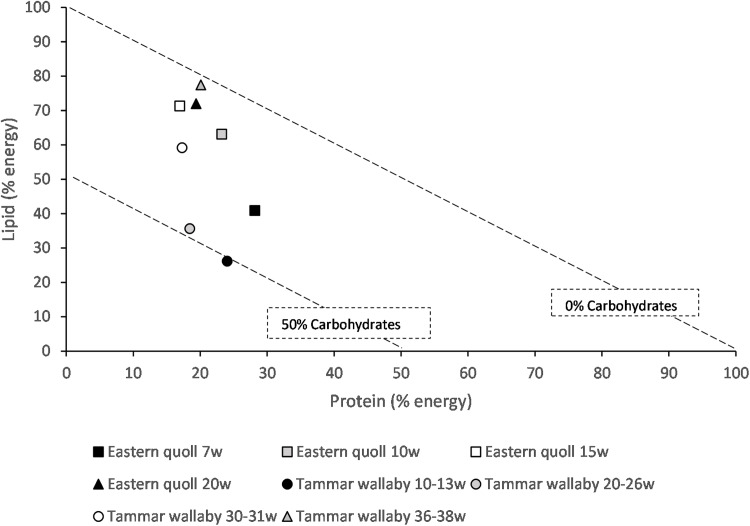
Figure 1. Right angle mixture triangle of macronutrient composition of milk from the eastern quoll and tammar wallaby at different weeks (w) of lactation.
For the tammar wallaby values represent phase 2A, 2B and two time points within phase3. Protein and lipid (% energy) increase along the X and Y axes, respectively. The percentage of carbohydrate decreases with distance from the origin, with the diagonal lines representing a fixed percentage carbohydrate.

