

Abstract
Disparities remain in the representation of marginalized students in STEM. Classroom‐based experiential learning opportunities can increase student confidence and academic success; however, the effectiveness of extending learning to outdoor settings is unknown. Our objectives were to examine (a) demographic gaps in ecology and evolutionary biology (EEB) major completion, college graduation, and GPAs for students who did and did not enroll in field courses, (b) whether under‐represented demographic groups were less likely to enroll in field courses, and (c) whether under‐represented demographic groups were more likely to feel increased competency in science‐related tasks (hereafter, self‐efficacy) after participating in field courses. We compared the relationships among academic success measures and demographic data (race/ethnicity, socioeconomic status, first‐generation, and gender) for UC Santa Cruz undergraduate students admitted between 2008 and 2019 who participated in field courses (N = 941 students) and who did not (N = 28,215 students). Additionally, we administered longitudinal surveys to evaluate self‐efficacy gains during field‐based versus classroom‐based courses (N = 570 students). We found no differences in the proportion of students matriculating at the university as undecided, proposed EEB, or proposed other majors across demographic groups. However, five years later, under‐represented students were significantly less likely to graduate with EEB degrees, indicating retention rather than recruitment drives disparities in representation. This retention gap is partly due to a lower rate of college completion and partly through attrition to other majors. Although under‐represented students were less likely to enroll in field courses, field courses were associated with higher self‐efficacy gains, higher college graduation rates, higher EEB major retention, and higher GPAs at graduation. All demographic groups experienced significant increases in self‐efficacy during field‐based but not lecture‐based courses. Together, our findings suggest that increasing the number of field courses and actively facilitating access to students from under‐represented groups can be a powerful tool for increasing STEM diversity.
Keywords: assessments, marginalized, minority, outcomes, STEM, student, success
We examined the relationships among academic success measures, field course enrollment, and diversity metrics (race/ethnicity, socioeconomic status, first‐generation, and gender) for 28,500 undergraduate students admitted to the University of California between 2008 and 2014. We found that field courses increase self‐confidence, graduation rates, and retention of under‐represented students in ecology fields.

1. INTRODUCTION
Gender and racial representation disparities remain a concerning issue in Science, Technology, Engineering, and Math (STEM) fields worldwide (Holman, Stuart‐Fox, & Hauser, 2018). The leaky pipeline begins with high attrition of students (Graham, Frederick, Byars‐Winston, Hunter, & Handelsman, 2013), especially racial/ethnic minority, economically disadvantaged, first‐generation, and women students (Alexander, Chen, & Grumbach, 2009; Reardon, 2011; Riegle‐Crumb, King, & Irizarry, 2019). College has been identified as a critical time point in the recruitment and retention of diverse students in STEM.
Ensuring diversity in STEM requires examining both racial and gender identities as well as socioeconomic status and how these demographic factors intersect (Eaton, Saunders, Jacobson, & West, 2019). In some cases, student demographics are directly related to sociological, psychological, and physiological mechanisms such as test anxiety (Salehi et al., 2019) that in turn compromise academic performance (Ballen, Wieman, Salehi, Searle, & Zamudio, 2017) and alter career intentions (Cheryan, Ziegler, Montoya, & Jiang, 2017; Epstein & Fischer, 2017). As a result, targeted interventions such as diversity programs and workshops have been created to combat social isolation and low confidence (Ahern‐Dodson, Clark, Mourad, & Reynolds, 2020; Ballen & Mason, 2017; Casad et al., 2018; Yeager et al., 2016). These efforts have shown some success in closing gaps in achievement metrics between marginalized students and their peers (Cohen, Garcia, Apfel, & Master, 2006). However, these interventions are costly and difficult to scale, and other research has shown that interventions in classroom and other course‐based learning environments may be preferable (see citations in Ballen et al. (2018)).
As a result, there has been an explosion of discipline‐based education research demonstrating that students can be supported through innovative approaches to active learning, course structure, and real‐time evaluations (Allen & Tanner, 2005; Canning, Muenks, Green, & Murphy, 2019; Cotner & Ballen, 2017; Freeman et al., 2014; Lovelace & Brickman, 2013; Owens et al., 2017; Seidel, Reggi, Schinske, Burrus, & Tanner, 2015; Sullivan, Ballen, & Cotner, 2018; Tanner, 2013; Weir et al., 2019). These innovative teaching methods have been shown to play a particularly important role for marginalized groups, such as those excluded based on gender (Freeman et al., 2007; Haak, HilleRisLambers, Pitre, & Freeman, 2011; Lorenzo, Crouch, & Mazur, 2006), race (Ballen et al., 2017), and financial status (Claro, Paunesku, & Dweck, 2016). Student‐driven inquiry is another high‐impact educational practice (Kuh, 2008) that has been implemented successfully in undergraduate classrooms (Ballen et al., 2017; Lopatto, 2007; Weaver, Russell, & Wink, 2008). Research opportunities have increased student confidence in the ability to do science (hereafter, self‐efficacy) and in turn help students develop their science identity and sense of belonging and increase motivation (Linnenbrink & Pintrich, 2003; Rodenbusch, Hernandez, Simmons, & Dolan, 2016; Schultz et al., 2011; Schunk, 1991; Walton & Cohen, 2011). These initiatives can also lead to publications and presentation opportunities that build confidence and experience (Ballen & Mason, 2017). While these course‐based undergraduate research experiences traditionally take place in laboratory settings (Adams, 2009), a growing number take place during short‐term field trips (Thompson, Neill, Wiederhoeft, & Cotner, 2016).
The success of extending teaching to outdoor settings has led to entire courses based around field‐based learning (hereafter, field courses) that facilitate hands‐on activities and inquiry‐based research. These courses focus on replacing a competitive model of learning with a team model of achievement in which collaboration and shared learning are valued. Thus, field‐based courses provide several potentially high‐impact services including deep immersion in the subject matter, active learning, formation of peer networks and cohesive learning communities (Epstein, Godsoe, & Kosinski‐Collins, 2015; Toven‐Lindsey, Levis‐Fitzgerald, Barber, & Hasson, 2015), enabling international field experiences (Bruening & Frick, 2004), having small class sizes that facilitate participation (Ballen et al., 2019), and allowing student‐faculty interactions that could lead to future opportunities (Kim & Sax, 2009; Newman, 2011; Wilson et al., 2012). These factors make field courses a promising potential tool for reducing attrition in STEM, especially the life sciences. Many research efforts have demonstrated the short‐term cognitive benefits of these courses (Boyle et al., 2007; Cotton, 2009; Easton & Gilburn, 2012), but none have evaluated long‐term benefits such as college completion, academic success, and retention in STEM. Further, it is unclear how these field courses might benefit undergraduate students from groups traditionally under‐represented in the sciences. Field courses may be especially beneficial for under‐represented students by reducing disparities in self‐efficacy and core science skills. That said, field courses are typically optional, costly, and selective, so it is also important to understand whether these potential barriers lead to disparities in field course participation across demographic groups.
The University of California Santa Cruz (UCSC) is an ideal setting to examine these questions. The campus offers extensive field‐based undergraduate science opportunities, including over 60 field courses that serve more than 2,000 students each year. UCSC is also a minority‐serving institution with over 38% under‐represented minority students, 45% first‐generation college students, and 40% from households with incomes <$50,000 (UC InfoCenter). Our objectives were to examine (a) demographic gaps in ecology and evolutionary biology (EEB) major completion, college graduation rates and grade point averages for students that did and did not enroll in field courses, (b) whether under‐represented demographic groups were less likely to enroll in field courses than their peers, and (c) whether under‐represented demographic groups were more likely to experience self‐efficacy gains from field course participation than their peers. Given that lecture‐based courses are traditionally used to fulfill major requirements, we compare enrollment metrics in objective 2 and self‐efficacy gains in objective 3 across lecture and field courses. We hypothesized that field course participation could close demographic self‐efficacy and achievement gaps in EEB by increasing self‐efficacy.
2. MATERIALS AND METHODS
This work was approved by UCSC IRB protocol #HS3230. For each student admitted to UCSC between Fall 2008 and Spring 2014 (N = 28,500), we obtained academic data and self‐reported demographic data from the registrar. Data were de‐identified to protect student identities. Demographic data were scored as binomial (Yes = 1, No = 0) for four categories: (a) URM, under‐represented minority status (students who identify primarily as African American/Black, American Indian/Alaskan Native, and Hispanic/Latino); (b) FIF, first‐in‐family to attend college; (c) EOP, whether they are part of the Educational Opportunity Program based on family income, undocumented, and foster care status); and (d) gender. Students who declined to state (N = 196, or 0.7%) and those who indicated nonbinary gender (N = 30, or 0.1%) were not included in the gender comparison analyses to avoid inadvertent disclosure of student identities. Students who did not wish to specify their characteristics were not included in the analysis. Academic data included proposed major at admission (proposed Ecology and Evolutionary Biology (EEB): Ecology & Evolution, Marine Biology, Plant Sciences, Biology, N = 2,057; proposed non‐EEB: N = 22,685, or undecided: N = 3,758), whether they graduated in five years, major at graduation, grade point average at graduation (hereafter, GPA), and number of field courses completed.
To analyze associations between student demographic categories, we calculated bivariate Spearman correlation coefficients. We present Cramer's V values, which provide information on association for nominal variables scaled between 0 (no association) and 1 (full association). To quantify how the demographics of field courses have changed over time, we extracted historical demographic composition data from field courses taught between 2008 and 2019 (N = 1,239 students; courses BIO75, BIO82, BIO128L, BIO151, BIO159, BIO161), and the gateway lecture course for EEB majors (N = 11,589 students; BIO20C). Field courses were included if more than 50% of course hours were spent in the field rather than in the classroom and if the course had been taught for at least 4 years. Information about course name, size, fee, and equipment requirements for each field course is provided in Appendix Table S1.
To quantify the association between field course participation, graduation rates, and retention in EEB, we constructed contingency tables of outcomes based on admission major and field course enrollment. We used chi‐square tests to evaluate the dependence of these factors, separated by admission major, and report odds ratios from the R package epitools. For students who graduated within five years, we used hierarchical linear regression models to quantify the relative contributions of admission and graduation major, student demographics, and field course enrollment on graduation GPA. We provide metrics on the overall variance explained by each model (R2) along with the unstandardized (B) and standardized (β) coefficients of each parameter within the models from R package lm.beta.
To evaluate self‐efficacy gains during field courses, we administered longitudinal surveys in a subset of three courses between Fall 2016 and Spring 2019: (a) BIOE 20C, a gateway ecology and evolutionary biology lecture course (N = 81); (b) BIOE 82, a 2‐unit, lower‐division field course that is intended to provide early field immersion and introduce natural history information and field research opportunities to students (N = 194); and (c) CEC, an immersive 19‐unit upper‐division field course that engages students in student‐directed research projects (N = 295). While BIOE 20C and BIOE 82 are courses offered at UCSC, CEC is a UC system‐wide course that enrolls students from all UC campuses. We administered paired pre‐ (first week of the academic quarter) and post‐ (last week of the academic quarter) surveys. Each student was asked to rate their confidence on a 5‐point Likert scale (1 = Strongly Disagree, 2 = Disagree, 3 = Neither Agree Nor Disagree, 4 = Agree, and 5 = Strongly Agree) for each of six questions: (a) I am familiar with the flora, fauna, and ecosystems of California; (b) I have strong experimental design skills; (c) I have strong oral presentation skills; (d) I know how to conduct field research projects from start to finish; (e) I am interested in pursuing a career in science; (f) I am interested in pursuing a graduate degree. We undertook two steps to validate the survey for cross‐group reliability. First, we used principal components analysis factor loading values to determine the number of common themes represented by the 6 difference (post–pre) survey questions. We identified two elements represented by survey questions: self‐efficacy (represented by questions 1–4) and motivation (represented by questions 5–6). Next, we calculated a Cronbach's alpha value as 0.7 [95% confidence boundaries 0.67 to 0.74] using the R package psych to measure the reliability of the survey (Cronbach, 1951). The improvement across the course (calculated as the difference between post‐ and pre‐surveys for each question) is presented. Data were aggregated by course and demographics (from methods above), and analyzed using two‐sided Wilcoxon signed‐rank tests (Lovelace & Brickman, 2013).
3. RESULTS
3.1. Demographic composition of ecology students
We evaluated admission, enrollment, and graduation trends for UC Santa Cruz (UCSC) students belonging to four groups traditionally under‐represented in higher education: racial/ethnic minority, first‐generation college‐bound, low socio‐economic status, and women students. Upon admission to the university, students from each demographic group were admitted equally as undeclared, EEB, or non‐EEB majors (χ2, p > .05 for all). However, five years after admission, all under‐represented demographic groups except women were significantly less likely to graduate with EEB degrees (Figure 1). This lower persistence of under‐represented students in EEB suggests an issue with retention rather than attraction to the majors. This retention gap is partly due to a lower rate of college completion and partly through attrition to other majors (Figure 1). Specifically, for students that entered UCSC between 2004 and 2012 with a declared major in EEB, under‐represented groups were significantly less likely to graduate with an EEB major (URM −16%, FIF −15%, EOP −14%) than their peers, being both less likely to complete college (URM −12%, FIF −7%, EOP −10%) and more likely to graduate with a non‐EEB degree (URM + 4%, FIF + 8%, EOP + 5%). Women and men were equally likely to graduate with a degree in EEB. Similarly, students admitted as undeclared majors or declared non‐EEB majors exhibited a persistence gap between under‐represented students and their peers ranging from 1%–2%, of whom 3%–7% did not graduate and 1%–7% graduated in majors other than EEB. For students who graduated in five years with an EEB degree, there was a disparity in graduation grade point average between under‐represented students and their peers. This achievement gap was −0.13 grade points for under‐represented minority students, −0.16 for low socio‐economic students, and −0.15 for first‐generation students. Women had a 0.08 higher GPA than their peers. All demographic groups except gender were significantly and positively correlated with one another, suggesting that intersecting identities play an important role in academic dynamics (Figure 2).
FIGURE 1.

Gaps in 5‐year college completion and EEB retention for all students admitted to UC Santa Cruz between 2008 and 2014 (N = 28,500), split by demographic group (panels). Dots are scaled by sample size ((√N)*0.1)
FIGURE 2.

Pairwise correlations between under‐represented groups: under‐represented minority (URM), first‐in‐family status (FIF), socioeconomic status (Educational Opportunity Program status, EOP), and gender. Values are measured as Cramer's V values, scaled between 0 (no association, white) and 1 (full association, brown)
3.2. Demographic composition of ecology field courses
Given that field courses are an elective opportunity for students at UCSC (i.e., not required to complete any EEB majors), we next evaluated the demographic composition of ecology field courses since 2008. Of students who graduated within five years as EEB majors (N = 1,505), 246 (16%) took at least one field course and 1,259 did not (84%). These enrollments were not distributed evenly across demographic groups: Under‐represented minority students were 2% less likely, low socioeconomic students were 4% less likely, and first‐generation students were 6% less likely than their peers to enroll in field courses. Women were 2% more likely than men to enroll in field courses. Consequently, the demographic composition of field courses over the past 11 years has remained below the diversity rates of the gateway biology lecture course that is required for all EEB majors (Figure 3). On average, the diversity gap in field course participation (calculated as Field Course Diversity ‐ Lecture Course Diversity) was −6% for under‐represented minority students, −9% for low socio‐economic students, and −12% for first‐generation students. The maximum annual diversity gap across this period was −19% for under‐represented minority students, −22% for low socio‐economic students, and −25% for first‐generation students. The diversity gap for women was + 4% on average. While progress has been made and representation of marginalized students has increased over the past three years, the diversity gap in field courses remains (Figure 3).
FIGURE 3.

Demographic gaps in enrollment between the gateway biology lecture course BIOE20C (N = 11,589 student enrollments, black squares) and the UCSC Ecology and Evolutionary Biology field courses (N = 1,239 student enrollments in six courses, blue circles)
3.3. Links between field courses and student retention, academic success, and career trajectories
Regardless of their declared major at admission, UCSC students who enrolled in at least one field course were more likely to graduate in five years as an EEB major (Table 1). Of students admitted as undecided majors, those who took field courses had a 76% chance of graduating as an EEB major relative to 4% for those who did not take a field course. Similarly, of students admitted as non‐EEB majors, those who took field courses had an 84% chance of graduating as an EEB major relative to 3% for those who did not. Field courses were also associated with retention for students admitted as EEB majors. Specifically, those who took at least one field course were more likely to graduate in EEB (90%) than those who did not take a field course (27%).
TABLE 1.
Contingency tables showing the proportion of students that graduated in five years as ecology and evolutionary biology (EEB) majors, graduated in five years as non‐EEB majors, or did not graduate based on their major proposed at admission and whether they enrolled in a field course
| Enrolled in Field Course | ||
|---|---|---|
| Yes | No | |
| Admitted as undecided majors (χ2 = 303.99, odds ratio = 55.84 df = 2, p < .0001) | ||
| Graduated EEB | 19 (76%) | 148 (4%) |
| Graduated Non‐EEB | 6 (24%) | 2,669 (71%) |
| Did Not Graduate | 0 (0%) | 916 (25%) |
| TOTAL | 25 | 3,733 |
| Admitted as non‐EEB majors (χ2 = 2,351.3, odds ratio = 170.35, df = 2, p < .0001) | ||
| Graduated EEB | 88 (84%) | 597 (3%) |
| Graduated Non‐EEB | 15 (14%) | 17,514 (78%) |
| Did Not Graduate | 2 (2%) | 4,469 (20%) |
| TOTAL | 105 | 22,580 |
| Admitted as EEB majors (χ2 = 260.02, odds ratio = 18.58, df = 2, p < .0001) | ||
| Graduated EEB | 139 (90%) | 514 (27%) |
| Graduated Non‐EEB | 14 (9%) | 973 (51%) |
| Did Not Graduate | 2 (1%) | 415 (22%) |
| TOTAL | 155 | 1,902 |
Values are given as sample size (proportion of row total).
For those who graduated within five years, student demographics and field course enrollment were both important in predicting GPA at graduation (Table 2). The significant factors appearing in the final model included major at admission and graduation, under‐represented status (negative effect), and field course enrollment (positive effect). Each of the three steps added significantly to the regression model analysis of academic success. The final model accounted for 8.1% of the variance in academic success. Of those who graduated with EEB degrees, students who took at least one field course had significantly higher GPAs than those who did not (3.35 vs. 3.05, t402 = −12.146, p < .0001, N = 246 and 1,259). For field course enrollees, the achievement gap between under‐represented students and their peers was significantly lower (URM: −0.08 for field course enrollees vs. −0.17 for non‐field course enrollees; EOP + 0.05 vs. −0.21; FIF −0.07 vs. −0.18). For students who graduated with non‐EEB degrees, students who took at least one field course had marginally higher GPAs (3.34 vs. 3.21, t34 = −1.9308, p = .06). There were no significant differences in GPA at graduation among students who enrolled in one, two, or three field courses.
TABLE 2.
Linear model fits for graduation grade point average as a function of academic, demographic, and field course enrollment variables. Parameter estimates are provided as unstandardized (B) and standardized (β) coefficients
| Variable | Model 1 | Model 2 | Model 3 | ||||||
|---|---|---|---|---|---|---|---|---|---|
| B ± SE | β | t | B ± SE | β | t | B ± SE | β | t | |
| Intercept | 3.09 ± 0.01 | 0.00 | 253.03*** | 3.19 ± 0.01 | 0.00 | 256.23*** | 3.15 ± 0.01 | 0.00 | 235.86*** |
| Grad Major – non‐EEB | 0.09 ± 0.01 | 0.60 | 8.01*** | 0.12 ± 0.01 | 0.08 | 10.57*** | 0.16 ± 0.01 | 0.10 | 13.03*** |
| Admit Major – non‐EEB | 0.06 ± 0.01 | 0.06 | 4.90*** | 0.05 ± 0.01 | 0.05 | 4.28*** | 0.06 ± 0.01 | 0.06 | 5.08*** |
| Admit Major ‐ undeclared | 0.03 ± 0.01 | 0.03 | 2.63*** | 0.03 ± 0.01 | 0.02 | 2.25* | 0.04 ± 0.01 | 0.03 | 2.92** |
| First‐in‐family | −0.08 ± 0.01 | −0.12 | −9.96*** | −0.08 ± 0.01 | −0.11 | −9.87*** | |||
| Educational Opportunity Program | −0.06 ± 0.01 | −0.11 | −5.75*** | −0.06 ± 0.01 | −0.11 | −5.81*** | |||
| Under‐represented minority | −0.08 ± 0.01 | −0.09 | −11.89*** | −0.08 ± 0.01 | −0.09 | −11.89*** | |||
| Men | 0.10 ± 0.01 | −0.12 | 18.35*** | 0.10 ± 0.01 | −0.12 | 18.25*** | |||
| Field course enrollment | 0.24 ± 0.03 | 0.07 | 9.48*** | ||||||
| R2 | 0.0065 | 0.0767 | 0.0808 | ||||||
Stars denote significance.
p < .05;
p < .01;
p < .001.
3.4. Self‐efficacy gains during field courses as an explanatory mechanism
Next, we tested whether self‐efficacy gains from field courses could help explain the benefits of field courses. Students enrolled in the gateway lecture course BIO20C did not experience significant increases in self‐efficacy (e.g., self‐reported confidence in scientific skills including oral presentations, species identification) during the course (p > .05 for each, Figure 4). In this course, self‐efficacy gains were independent of race/ethnicity and first‐in‐family status, and low socio‐economic students were less likely to desire a science career after the lecture class (p = .02886).
FIGURE 4.
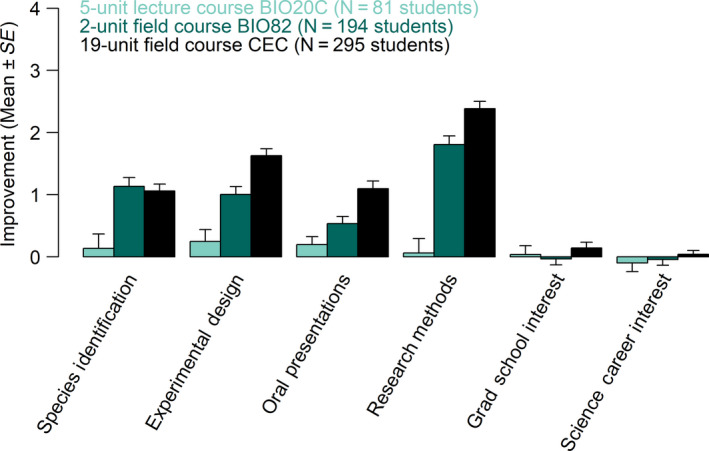
Field courses increase student self‐efficacy more than a lecture course. Improvement values are the difference in self‐ranked confidence between pre‐ and postsurveys, across all demographic groups
Students enrolled in the lower‐division field course BIO82 reported increased confidence in their ability to identify flora/fauna species, design experiments, deliver oral presentations, employ field research methods, and obtain further hands‐on opportunities at UCSC (p < .0001 for each, Figure 4). In this course, race/ethnicity was the only demographic factor to influence self‐efficacy (Figure 5). Under‐represented minority students began the course with lower confidence than their peers in their ability to identify California flora and fauna and design experiments, but gained more confidence during the course than non‐URM students (p = .002894 and p = .02667, respectively) and thus ended the course with comparable confidence. First‐in‐family students began the course with significantly higher interest in pursuing a graduate degree (p = .0349). There was no effect of socioeconomic status or gender on self‐efficacy scores before or after the course.
FIGURE 5.

Pre‐ (circles) and post‐ (squares) self‐efficacy scores for under‐represented minority (URM, green), economically disadvantaged (EOP, blue), first‐generation (FIF, yellow), and women (pink) students in the lower‐division field course BIO82 (N = 194). Starred pairs of pre–post gains differed significantly (p < .05)
The upper‐division field course CEC had a particularly strong influence on student self‐efficacy as compared to the lower‐division field course BIO82, with significantly higher gains in all categories except identification of flora and fauna (Figure 4). Neither the lecture course nor the field courses increased student interest in attending graduate school or working toward a career in science, likely because the pre‐course values were already high across all courses (raw score out of 5 ranged 4.1 to 4.4 for Grad Degree, and 4.4 to 4.7 for Science Career, Appendix Table S2). In the CEC course, race/ethnicity and first‐generation status both affected self‐efficacy gains (Figure 5). Under‐represented minority students began the course with lower confidence in their ability to identify California flora and fauna, but gained more confidence during the course than non‐URM students (p = .003187) and thus ended the course with comparable confidence. Under‐represented minority students began the course with lower interest in a science career and gained marginally more interest than their peers (p = .06329). First‐in‐family students began the course with the same interest in a science career as their peers but gained significantly more during the course (p = .01217).
4. DISCUSSION
We found that field courses increased self‐efficacy and narrowed the achievement and completion gap in marginalized demographic groups (Figure 4, Table 1, Table 2). Compared to the 5‐unit lecture course, field courses had a disproportionately large and positive impact on self‐assessment of core science competencies (hereafter, self‐efficacy) (Figure 4). We found that a lower‐division field course provided a low‐cost option that still conferred significant self‐efficacy advantages (Figure 4), engaged students early in their career (Toven‐Lindsey et al., 2015), and required less class time and instruction than the lecture course (Appendix Table S1). In comparison, the upper‐division field course provided a more intensive option that resulted in twofold higher self‐efficacy advantages, but was more costly for students and the campus (Figure 4, Appendix Table S1). Both field courses closed gaps in self‐efficacy between under‐represented students and their peers (Figure 5) while the lecture course did not, indicating that field courses can be an important vehicle for inclusion and equity in EEB. Together, these data suggest that field courses may provide a promising pathway for diversifying the STEM workforce.
These findings are especially promising given that Ecology and Evolutionary Biology (EEB) appears to have a retention rather than a recruitment problem for diverse undergraduate students (Figure 1). Specifically, we found that students from under‐represented groups were equally likely to be admitted as proposed EEB majors and have high science career and graduate school interest (Figure 4). However, students from under‐represented groups had a lower rate of college completion and higher rate of attrition to other majors (Figure 1). Additionally, under‐represented students that graduated with EEB degrees had a GPA deficit compared to their peers (Table 2). Our findings align with previous studies showing that URM students entering college are just as likely as their non‐URM peers to intend pursuit of a scientific career but over the course of undergraduate studies, these students are disproportionately lost (Koenig, 2009; Toven‐Lindsey et al., 2015).
We also discovered that field courses had low URM representation, although this gap appears to be closing at our focal institution (Figure 3). Field courses are often over‐subscribed, with student demand exceeding enrollment supply. However, the enrollment selection process at UCSC does not depend on grade point average and thus does not select for high‐achieving students. Additionally, the selection process does not consider race or ethnicity and thus cannot explain the disparate enrollment rates of students from marginalized groups. Instead, we suggest that course fees, cost of field equipment such as camping gear, a potential perception of lacking necessary experience to be competitive, and specialized training may serve as barriers to participation. In our study, courses with large fees (up to $3,000) and/or requirements for specialized equipment and certifications (e.g. SCUBA), expensive or complicated travel requirements, tended to include fewer socio‐economically disadvantaged and first‐generation students than other field courses (Appendix Table S1). Anecdotal data from participants in BIOE82, which has a course fee of $180, suggest that even a moderate fee is enough to deter students from enrolling and likely presents enough of a barrier to keep some students from applying. To our knowledge, this study is the first to compare the participation of under‐represented groups in costly elective courses within a single university. In the future, we suggest that the demographics of students should be tracked through the field courses application process to check for equity in access (Tanner, 2009). Future research should also seek to quantify this enrollment disparity across institutions and nations with a spectrum of education costs.
Given their effectiveness at enhancing graduation rates and GPAs for all students, and for closing achievement gaps in under‐represented students, increasing field course opportunities and eliminating enrollment barriers must be a priority. Specifically, increased opportunities for early field course enrollment, especially in the lower‐division field course with a minimal course fee (Appendix Table S1), can address broader disparities in STEM major completion and college graduation rates. This can be facilitated by increasing the number of course offerings, providing course fee scholarships, or adding field courses to major requirements. A more inclusive application system would also institutionalize the advancement of diversity instead of relying on faculty advocates from marginalized groups (Jimenez et al., 2019) or with education specialties (Bush et al., 2008).
The number of field course offerings for undergraduates is limited for a variety of reasons. Instructors cite time commitments and content forfeiture as impediments (Brownell & Tanner, 2012; Jimenez et al., 2019); however, recent evidence demonstrates that field courses facilitate significant learning of fundamental concepts (Elkins & Elkins, 2007), and institutions are increasingly incentivizing teaching approaches that promote diversity (Edwards & Roy, 2017). Thus, field courses need not create a trade‐off between field‐based experiences and the content goals of a given curriculum. More rigorous evaluation of field courses requiring varying time‐commitments, equipment, and fees is necessary to identify the most effective and scalable approaches for promoting increased institutional adoption of field courses (Ballen & Mason, 2017; Graham et al., 2013; Mervis, 2006). A cost‐benefit analysis of institutional investment in various types of courses has yet to be completed, and debate between resource allocation to single large or several small classes remains. In the future, these studies will be critical for a data‐driven approach to informing curriculum and academic plan development.
There are several potentially confounding factors related to field courses and student outcomes, including: self‐selection of more successful students into field courses, differences in grades between field and lecture courses, and smaller class sizes of students. However, lower‐division field course (BIO82) students began the course with confidence in their science‐specific skills (e.g., oral presentations, species identification) comparable to the lower‐division lecture course (BIO20C) students suggesting that student success bias is not the case (Appendix Table S2). Further, at the upper‐division level, the grade allocations of field courses are distributed similarly to those of lecture courses. Additionally, previous studies have shown that the small class size of field courses is unlikely to drive trends in student success because upper‐division lecture courses are of comparable size (Ballen et al., 2018). Regardless, we can say with certainty that field courses were associated with higher retention and success (Tables 1 and 2). Finally, we note that institutional context can impact student perceptions and experiences and suggest that similar studies be undertaken at other universities including community colleges and liberal arts colleges.
Future research efforts should seek to understand how social (Estrada, Woodcock, Hernandez, & Schultz, 2011; Torregosa, Ynalvez, & Morin, 2016) and psychological (Hanauer, Graham, & Hatfull, 2016) mechanisms such as sense of belonging, project ownership, and community building explain the benefits of field courses. Like Rainey, Dancy, Mickelson, Stearns, and Moller (2018), we found that students from under‐represented groups have lower self‐efficacy in the sciences (Browman, Destin, Kearney, & Levine, 2019). Due to logistical constraints, we did not account for hidden identities such as sexual orientation, political affiliation, and religion that likely play an important role (Henning, Ballen, Molina, & Cotner, 2019). A qualitative research approach including focus groups and reflective journaling would help to evaluate other roadblocks to entry such as family planning considerations (Lynn, Howells, & Stein, 2018) and sexual harassment (Leaper & Starr, 2019). Understanding barriers perceived by students can inform targeted interventions to reinforce the academic pipeline (Freeman, Landry, Trevino, Grande, & Shea, 2016). Additionally, the degree to which field course benefits can be attributed to pedagogical methods employed in a course (e.g., active learning) or context in which a course is taught (e.g., in nature) must be studied in the future. Finally, we recognize the limitations of combining all under‐represented minority groups into a single category. In the future, an in‐depth analysis of experiences within and between race/ethnicity groups would provide valuable insight.
In addition to reforming academic practice, we must work toward inclusion and equity across all levels. What was previously termed the “leaky pipeline” is now understood to include biases across critical STEM processes (Grogan, 2019) including publishing (Bendels, Müller, Brueggmann, & Groneberg, 2018; Holman et al., 2018; Murray, Siler, Lariviére, et al., 2019; Murray, Siler, Larivière, et al., 2019), funding (Ginther et al., 2011; Hechtman et al., 2018; Sege, Nykiel‐Bub, & Selk, 2015; Van der Lee & Ellemers, 2015), hiring (Eaton et al., 2019; Moss‐Racusin, Dovidio, Brescoll, Graham, & Handelsman, 2012; Sheltzer & Smith, 2014), promotion (Kaminski & Geisler, 2012; Lerchenmueller & Sorenson, 2018; Van Dijk, Manor, & Carey, 2014), recommendation (Dutt, Pfaff, Bernstein, Dillard, & Block, 2016; Schmader, Whitehead, & Wysocki, 2007), and recognition (Lincoln, Pincus, Koster, & Leboy, 2012; Ma, Oliveira, Woodruff, & Uzzi, 2019). Decades of directed effort have somewhat lessened these biases and led to more institutional representation of women scientists (Cheryan et al., 2017), with academia predicted to reach gender parity in 50 years (Holman et al., 2018). Yet these biases add to existing academic performance barriers faced by students whose parents complete fewer years of education or have less financial resources (Ma, Pender, & Welch, 2016; Sirin, 2005). As a result, the progress for other groups such as under‐represented minorities and low socio‐economic students is markedly slower. Worldwide, gender and racial gaps in STEM representation remain (Holman et al., 2018), and disparities worsen at higher levels of academia. For example, UCSC undergraduate students are 53% women compared to 45% of graduate students, 39% of postdoctoral researchers, and 42% of tenure‐track faculty at the same institution. In contrast, the racial diversity gap is far more severe, as undergraduates are 38% URM, compared to 18% of graduate students, 15% of postdocs, and 11% of ladder‐rank faculty. Ecology and Evolutionary Biology in particular lags other STEM fields, including biomedical, cellular, and molecular biology (5.8% URM graduate students in EEB vs. 10.1% URM) across the United States (NSF, 2015).
We must continue to identify practical and scalable steps to promote inclusion and success of students from historically marginalized populations (Ballen et al., 2018). The resulting “diversity dividend” will benefit scientific quality and progress (AlShebli, Rahwan, & Woon, 2018; Campbell, Mehtani, Dozier, & Rinehart, 2013; Nielsen et al., 2017). Additionally, diverse leaders can inspire diverse students, leading to a positive feedback loop that can have lasting impacts (Hernandez et al., 2018; Potvin, Burdfield‐Steel, Potvin, & Heap, 2018; Price, 2010). Thus, broadening participation and achievement of racial minorities in STEM must continue to be an important community goal (Canning et al., 2019; Nielsen et al., 2017).
CONFLICT OF INTEREST
The authors declare no competing interests.
AUTHOR CONTRIBUTION
Roxanne Beltran: Conceptualization (equal); Data curation (equal); Formal analysis (equal); Methodology (equal); Project administration (equal); Visualization (equal); Writing‐original draft (equal); Writing‐review & editing (equal). Erin Marnocha: Data curation (equal); Formal analysis (equal); Methodology (equal); Project administration (equal); Writing‐review & editing (equal). Alexandra Race: Data curation (equal); Methodology (equal); Validation (equal); Writing‐review & editing (equal). Don Croll: Data curation (equal); Investigation (equal); Project administration (equal); Writing‐review & editing (equal). Gage Dayton: Data curation (equal); Funding acquisition (equal); Project administration (equal); Writing‐review & editing (equal). Erika Zavaleta: Conceptualization (equal); Data curation (equal); Formal analysis (equal); Funding acquisition (equal); Project administration (equal); Writing‐original draft (equal); Writing‐review & editing (equal).
Supporting information
Supplementary Material
ACKNOWLEDGMENTS
Thank you to the hundreds of students that took time to help us become better educators, and to the course instructors especially Abe Borker, Sean Reilly, Kristen Heady, Baldo Marinovic, Blake Suttle, Dina Roberts, Krikor Andonian, and Tim Miller for cultivating the next generation of field scientists. Additionally, we are grateful to Amy Hyler‐Essig, Samara Foster, and Rebecca Covarrubias from the UCSC Student Success Equity Research Center and Tchad Sanger from the Registrar for data access, to Diana Alvarado, Erin McCreless, and Erin Pickett for data organization, and to the Conservation Science & Solutions Lab for helpful feedback on previous drafts. Paul Dayton, Harry Greene, and Ken Norris provided inspiration and frameworks for the importance of natural history and field‐based education. This work was funded by a National Science Foundation Postdoctoral Fellowship for Research in Biology to RSB, a UCSC Chancellor's Fellowship to RSB, and a Howard Hughes Medical Institute award to ESZ.
Beltran RS, Marnocha E, Race A, Croll DA, Dayton GH, Zavaleta ES. Field courses narrow demographic achievement gaps in ecology and evolutionary biology. Ecol Evol. 2020;10:5184–5196. 10.1002/ece3.6300
DATA AVAILABILITY STATEMENT
Aggregate data are archived in the publicly accessible repository Dryad at https://doi.org/10.7291/D1DM3P.
REFERENCES
- Adams, D. J. (2009). Current trends in laboratory class teaching in university bioscience programmes. Bioscience Education, 13(1), 1–14. 10.3108/beej.13.3 [DOI] [Google Scholar]
- Ahern‐Dodson, J. , Clark, C. R. , Mourad, T. , & Reynolds, J. A. (2020). Beyond the numbers: Understanding how a diversity mentoring program welcomes students into a scientific community. Ecosphere, 11(2), e03025 10.1002/ecs2.3025 [DOI] [Google Scholar]
- Alexander, C. , Chen, E. , & Grumbach, K. (2009). How leaky is the health career pipeline? Minority student achievement in college gateway courses. Academic Medicine, 84(6), 797–802. 10.1097/ACM.0b013e3181a3d948 [DOI] [PubMed] [Google Scholar]
- Allen, D. , & Tanner, K. (2005). Infusing active learning into the large‐enrollment biology class: Seven strategies, from the simple to complex. Cell Biology Education, 4(4), 262–268. 10.1187/cbe.05-08-0113 [DOI] [PMC free article] [PubMed] [Google Scholar]
- AlShebli, B. K. , Rahwan, T. , & Woon, W. L. (2018). The preeminence of ethnic diversity in scientific collaboration. Nature Communications, 9(1), 5163 10.1038/s41467-018-07634-8 [DOI] [PMC free article] [PubMed] [Google Scholar]
- Ballen, C. J. , Aguillon, S. M. , Awwad, A. , Bjune, A. E. , Challou, D. , Drake, A. G. , … Cotner, S. (2019). Smaller classes promote equitable student participation in STEM. BioScience, 69(8), 669–680. 10.1093/biosci/biz069 [DOI] [Google Scholar]
- Ballen, C. J. , Aguillon, S. M. , Brunelli, R. , Drake, A. G. , Wassenberg, D. , Weiss, S. L. , … Cotner, S. (2018). Do small classes in higher education reduce performance gaps in STEM? BioScience, 68(8), 593–600. 10.1093/biosci/biy056 [DOI] [Google Scholar]
- Ballen, C. J. , & Mason, N. A. (2017). Longitudinal analysis of a diversity support program in biology: A national call for further assessment. BioScience, 67(4), 367–373. 10.1093/biosci/biw187 [DOI] [Google Scholar]
- Ballen, C. J. , Wieman, C. , Salehi, S. , Searle, J. B. , & Zamudio, K. R. (2017). Enhancing diversity in undergraduate science: Self‐efficacy drives performance gains with active learning. Cbe—life Sciences Education CBE—Life Sciences Education, 16(4), ar56 10.1187/cbe.16-12-0344 [DOI] [PMC free article] [PubMed] [Google Scholar]
- Bendels, M. H. , Müller, R. , Brueggmann, D. , & Groneberg, D. A. (2018). Gender disparities in high‐quality research revealed by Nature Index journals. PLoS ONE, 13(1), e0189136 10.1371/journal.pone.0189136 [DOI] [PMC free article] [PubMed] [Google Scholar]
- Boyle, A. , Maguire, S. , Martin, A. , Milsom, C. , Nash, R. , Rawlinson, S. , … Conchie, S. (2007). Fieldwork is good: The student perception and the affective domain. Journal of Geography in Higher Education, 31(2), 299–317. 10.1080/03098260601063628 [DOI] [Google Scholar]
- Browman, A. S. , Destin, M. , Kearney, M. S. , & Levine, P. B. (2019). How economic inequality shapes mobility expectations and behaviour in disadvantaged youth. Nature Human Behaviour, 3(3), 214–220. 10.1038/s41562-018-0523-0 [DOI] [PubMed] [Google Scholar]
- Brownell, S. E. , & Tanner, K. D. (2012). Barriers to faculty pedagogical change: Lack of training, time, incentives, and… tensions with professional identity? Cbe—life Sciences Education, 11(4), 339–346. 10.1187/cbe.12-09-0163 [DOI] [PMC free article] [PubMed] [Google Scholar]
- Bruening, T. H. , & Frick, M. (2004). Globalizing the US undergraduate experience: A case study of the benefits of an international agriculture field‐based course. Journal of International Agricultural and Extension Education, 11(1), 89–96. 10.5191/jiaee.2004.11110 [DOI] [Google Scholar]
- Bush, S. D. , Pelaez, N. , Rudd, J. , Stevens, M. , Tanner, K. , & Williams, K. (2008). Science faculty with education specialties. Science, 322(5909), 1795–1796. [DOI] [PubMed] [Google Scholar]
- Campbell, L. G. , Mehtani, S. , Dozier, M. E. , & Rinehart, J. (2013). Gender‐heterogeneous working groups produce higher quality science. PLoS ONE, 8(10), e79147 10.1371/journal.pone.0079147 [DOI] [PMC free article] [PubMed] [Google Scholar]
- Canning, E. A. , Muenks, K. , Green, D. J. , & Murphy, M. C. (2019). STEM faculty who believe ability is fixed have larger racial achievement gaps and inspire less student motivation in their classes. Science Advances, 5(2), eaau4734 10.1126/sciadv.aau4734 [DOI] [PMC free article] [PubMed] [Google Scholar]
- Casad, B. J. , Oyler, D. L. , Sullivan, E. T. , McClellan, E. M. , Tierney, D. N. , Anderson, D. A. , … Flammang, B. J. (2018). Wise psychological interventions to improve gender and racial equality in STEM. Group Processes and Intergroup Relations, 21(5), 767–787. 10.1177/1368430218767034 [DOI] [Google Scholar]
- Cheryan, S. , Ziegler, S. A. , Montoya, A. K. , & Jiang, L. (2017). Why are some STEM fields more gender balanced than others? Psychological Bulletin, 143(1), 1 10.1037/bul0000052 [DOI] [PubMed] [Google Scholar]
- Claro, S. , Paunesku, D. , & Dweck, C. S. (2016). Growth mindset tempers the effects of poverty on academic achievement. Proceedings of the National Academy of Sciences of the United States of America, 113(31), 8664–8668. 10.1073/pnas.1608207113 [DOI] [PMC free article] [PubMed] [Google Scholar]
- Cohen, G. L. , Garcia, J. , Apfel, N. , & Master, A. (2006). Reducing the racial achievement gap: A social‐psychological intervention. Science, 313(5791), 1307–1310. [DOI] [PubMed] [Google Scholar]
- Cotner, S. , & Ballen, C. J. (2017). Can mixed assessment methods make biology classes more equitable? PLoS ONE, 12(12), e0189610 10.1371/journal.pone.0189610 [DOI] [PMC free article] [PubMed] [Google Scholar]
- Cotton, D. R. (2009). Field biology experiences of undergraduate students: The impact of novelty space. Journal of Biological Education, 43(4), 169–174. 10.1080/00219266.2009.9656178 [DOI] [Google Scholar]
- Cronbach, L. J. (1951). Coefficient alpha and the internal structure of tests. Psychometrika, 16(3), 297–334. 10.1007/BF02310555 [DOI] [Google Scholar]
- Dutt, K. , Pfaff, D. L. , Bernstein, A. F. , Dillard, J. S. , & Block, C. J. (2016). Gender differences in recommendation letters for postdoctoral fellowships in geoscience. Nature Geoscience, 9(11), 805 10.1038/ngeo2819 [DOI] [Google Scholar]
- Easton, E. , & Gilburn, A. (2012). The field course effect: Gains in cognitive learning in undergraduate biology students following a field course. Journal of Biological Education, 46(1), 29–35. 10.1080/00219266.2011.568063 [DOI] [Google Scholar]
- Eaton, A. A. , Saunders, J. F. , Jacobson, R. K. , & West, K. (2019). How gender and race stereotypes impact the advancement of scholars in STEM: Professors’ biased evaluations of physics and biology post‐doctoral candidates. Sex Roles, 1–15. [Google Scholar]
- Edwards, M. A. , & Roy, S. (2017). Academic research in the 21st century: Maintaining scientific integrity in a climate of perverse incentives and hypercompetition. Environmental Engineering Science, 34(1), 51–61. 10.1089/ees.2016.0223 [DOI] [PMC free article] [PubMed] [Google Scholar]
- Elkins, J. T. , & Elkins, N. M. (2007). Teaching geology in the field: Significant geoscience concept gains in entirely field‐based introductory geology courses. Journal of Geoscience Education, 55(2), 126–132. 10.5408/1089-9995-55.2.126 [DOI] [Google Scholar]
- Epstein, I. , Godsoe, K. , & Kosinski‐Collins, M. (2015). The Brandeis Science Posse: Using the group model to retain students in the sciences. Athens Journal of Education, 2, 9–21. 10.30958/aje.2-1-1 [DOI] [Google Scholar]
- Epstein, N. , & Fischer, M. R. (2017). Academic career intentions in the life sciences: Can research self‐efficacy beliefs explain low numbers of aspiring physician and female scientists? PLoS ONE, 12(9), e0184543 10.1371/journal.pone.0184543 [DOI] [PMC free article] [PubMed] [Google Scholar]
- Estrada, M. , Woodcock, A. , Hernandez, P. R. , & Schultz, P. (2011). Toward a model of social influence that explains minority student integration into the scientific community. Journal of Educational Psychology, 103(1), 206 10.1037/a0020743 [DOI] [PMC free article] [PubMed] [Google Scholar]
- Freeman, B. K. , Landry, A. , Trevino, R. , Grande, D. , & Shea, J. A. (2016). Understanding the leaky pipeline: Perceived barriers to pursuing a career in medicine or dentistry among underrepresented‐in‐medicine undergraduate students. Academic Medicine, 91(7), 987–993. 10.1097/ACM.0000000000001020 [DOI] [PubMed] [Google Scholar]
- Freeman, S. , Eddy, S. L. , McDonough, M. , Smith, M. K. , Okoroafor, N. , Jordt, H. , & Wenderoth, M. P. (2014). Active learning increases student performance in science, engineering, and mathematics. Proceedings of the National Academy of Sciences of the United States of America, 111(23), 8410–8415. 10.1073/pnas.1319030111 [DOI] [PMC free article] [PubMed] [Google Scholar]
- Freeman, S. , O'Connor, E. , Parks, J. W. , Cunningham, M. , Hurley, D. , Haak, D. , … Wenderoth, M. P. (2007). Prescribed active learning increases performance in introductory biology. Cbe—life Sciences Education, 6(2), 132–139. 10.1187/cbe.06-09-0194 [DOI] [PMC free article] [PubMed] [Google Scholar]
- Ginther, D. K. , Schaffer, W. T. , Schnell, J. , Masimore, B. , Liu, F. , Haak, L. L. , & Kington, R. (2011). Race, ethnicity, and NIH research awards. Science, 333(6045), 1015–1019. [DOI] [PMC free article] [PubMed] [Google Scholar]
- Graham, M. J. , Frederick, J. , Byars‐Winston, A. , Hunter, A.‐B. , & Handelsman, J. (2013). Increasing persistence of college students in STEM. Science, 341(6153), 1455–1456. [DOI] [PMC free article] [PubMed] [Google Scholar]
- Grogan, K. E. (2019). How the entire scientific community can confront gender bias in the workplace. Nature Ecology and Evolution, 3(1), 3 10.1038/s41559-018-0747-4 [DOI] [PubMed] [Google Scholar]
- Haak, D. C. , HilleRisLambers, J. , Pitre, E. , & Freeman, S. (2011). Increased structure and active learning reduce the achievement gap in introductory biology. Science, 332(6034), 1213–1216. [DOI] [PubMed] [Google Scholar]
- Hanauer, D. I. , Graham, M. J. , & Hatfull, G. F. (2016). A measure of college student persistence in the sciences (PITS). Cbe—life Sciences Education, 15(4), ar54 10.1187/cbe.15-09-0185 [DOI] [PMC free article] [PubMed] [Google Scholar]
- Hechtman, L. A. , Moore, N. P. , Schulkey, C. E. , Miklos, A. C. , Calcagno, A. M. , Aragon, R. , & Greenberg, J. H. (2018). NIH funding longevity by gender. Proceedings of the National Academy of Sciences of the United States of America, 115(31), 7943–7948. 10.1073/pnas.1800615115 [DOI] [PMC free article] [PubMed] [Google Scholar]
- Henning, J. A. , Ballen, C. J. , Molina, S. , & Cotner, S. (2019). Hidden identities shape student perceptions of active learning environments. Paper presented at the Frontiers in Education. [Google Scholar]
- Hernandez, P. R. , Bloodhart, B. , Adams, A. S. , Barnes, R. T. , Burt, M. , Clinton, S. M. , … Fischer, E. V. (2018). Role modeling is a viable retention strategy for undergraduate women in the geosciences. Geosphere, 14(6), 2585–2593. 10.1130/GES01659.1 [DOI] [Google Scholar]
- Holman, L. , Stuart‐Fox, D. , & Hauser, C. E. (2018). The gender gap in science: How long until women are equally represented? PLoS Biology, 16(4), e2004956 10.1371/journal.pbio.2004956 [DOI] [PMC free article] [PubMed] [Google Scholar]
- Jimenez, M. F. , Laverty, T. M. , Bombaci, S. P. , Wilkins, K. , Bennett, D. E. , & Pejchar, L. (2019). Underrepresented faculty play a disproportionate role in advancing diversity and inclusion. Nature Ecology and Evolution, 1 10.1038/s41559-019-0911-5 [DOI] [PubMed] [Google Scholar]
- Kaminski, D. , & Geisler, C. (2012). Survival analysis of faculty retention in science and engineering by gender. Science, 335(6070), 864–866. [DOI] [PubMed] [Google Scholar]
- Kim, Y. K. , & Sax, L. J. (2009). Student–faculty interaction in research universities: Differences by student gender, race, social class, and first‐generation status. Research in Higher Education, 50(5), 437–459. 10.1007/s11162-009-9127-x [DOI] [Google Scholar]
- Koenig, R. (2009). Minority retention rates in science are sore spot for most universities. Science, 324(5933), 1386–1387. 10.1126/science.324_1386a [DOI] [PubMed] [Google Scholar]
- Kuh, G. D. (2008). High impact practices: What are they, who has access to them and why they matter. Washington: Association of American Colleges and Universities. [Google Scholar]
- Leaper, C. , & Starr, C. R. (2019). Helping and hindering undergraduate women’s STEM motivation: Experiences with STEM encouragement, STEM‐related gender bias, and sexual harassment. Psychology of Women Quarterly, 43(2), 165–183. 10.1177/0361684318806302 [DOI] [Google Scholar]
- Lerchenmueller, M. J. , & Sorenson, O. (2018). The gender gap in early career transitions in the life sciences. Research Policy, 47(6), 1007–1017. 10.1016/j.respol.2018.02.009 [DOI] [Google Scholar]
- Lincoln, A. E. , Pincus, S. , Koster, J. B. , & Leboy, P. S. (2000). The Matilda Effect in science: Awards and prizes in the US, 1990s and 2000s. Social Studies of Science, 42(2), 307–320. 10.1177/0306312711435830 [DOI] [PubMed] [Google Scholar]
- Linnenbrink, E. A. , & Pintrich, P. R. (2003). The role of self‐efficacy beliefs instudent engagement and learning in the classroom. Reading and Writing Quarterly, 19(2), 119–137. 10.1080/10573560308223 [DOI] [Google Scholar]
- Lopatto, D. (2007). Undergraduate research experiences support science career decisions and active learning. Cbe—life Sciences Education, 6(4), 297–306. 10.1187/cbe.07-06-0039 [DOI] [PMC free article] [PubMed] [Google Scholar]
- Lorenzo, M. , Crouch, C. H. , & Mazur, E. (2006). Reducing the gender gap in the physics classroom. American Journal of Physics, 74(2), 118–122. 10.1119/1.2162549 [DOI] [Google Scholar]
- Lovelace, M. , & Brickman, P. (2013). Best practices for measuring students’ attitudes toward learning science. Cbe—life Sciences Education, 12(4), 606–617. 10.1187/cbe.12-11-0197 [DOI] [PMC free article] [PubMed] [Google Scholar]
- Lynn, C. D. , Howells, M. E. , & Stein, M. J. (2018). Family and the field: Expectations of a field‐based research career affect researcher family planning decisions. PLoS ONE, 13(9), e0203500 10.1371/journal.pone.0203500 [DOI] [PMC free article] [PubMed] [Google Scholar]
- Ma, J. , Pender, M. , & Welch, M. (2016). Education pays: The benefits of higher education for individuals and society. College Board: Trends in Higher Education Series. [Google Scholar]
- Ma, Y. , Oliveira, D. F. , Woodruff, T. K. , & Uzzi, B. (2019). Women who win prizes get less money and prestige. Nature, 565, 287–288. 10.1038/d41586-019-00091-3 [DOI] [PubMed] [Google Scholar]
- Mervis, J. (2006). NIH told to get serious about giving minorities a hand. Science, 311(5759), 328–329. 10.1126/science.311.5759.328. [DOI] [PubMed] [Google Scholar]
- Moss‐Racusin, C. A. , Dovidio, J. F. , Brescoll, V. L. , Graham, M. J. , & Handelsman, J. (2012). Science faculty’s subtle gender biases favor male students. Proceedings of the National Academy of Sciences of the United States of America, 109(41), 16474–16479. 10.1073/pnas.1211286109 [DOI] [PMC free article] [PubMed] [Google Scholar]
- Murray, D. , Siler, K. , Lariviére, V. , Chan, W. M. , Collings, A. M. , Raymond, J. , & Sugimoto, C. R. (2019). Gender and international diversity improves equity in peer review. BioRxiv, 400515. [Google Scholar]
- Murray, D. , Siler, K. , Larivière, V. , Chan, W. M. , Collings, A. M. , Raymond, J. , & Sugimoto, C. R. (2019). Author‐reviewer Homophily in Peer Review. BioRxiv, 400515. [Google Scholar]
- Newman, C. B. (2011). Engineering success: The role of faculty relationships with African American undergraduates. Journal of Women and Minorities in Science and Engineering, 17(3), 193–207. 10.1615/JWomenMinorScienEng.2011001737 [DOI] [Google Scholar]
- Nielsen, M. W. , Alegria, S. , Börjeson, L. , Etzkowitz, H. , Falk‐Krzesinski, H. J. , Joshi, A. , … Schiebinger, L. (2017). Opinion: Gender diversity leads to better science. Proceedings of the National Academy of Sciences of the United States of America, 114(8), 1740–1742. 10.1073/pnas.1700616114 [DOI] [PMC free article] [PubMed] [Google Scholar]
- Owens, M. T. , Seidel, S. B. , Wong, M. , Bejines, T. E. , Lietz, S. , Perez, J. R. , … Tanner, K. D. (2017). Classroom sound can be used to classify teaching practices in college science courses. Proceedings of the National Academy of Sciences of the United States of America, 114(12), 3085–3090. 10.1073/pnas.1618693114 [DOI] [PMC free article] [PubMed] [Google Scholar]
- Potvin, D. A. , Burdfield‐Steel, E. , Potvin, J. M. , & Heap, S. M. (2018). Diversity begets diversity: A global perspective on gender equality in scientific society leadership. PLoS ONE, 13(5), e0197280 10.1371/journal.pone.0197280 [DOI] [PMC free article] [PubMed] [Google Scholar]
- Price, J. (2010). The effect of instructor race and gender on student persistence in STEM fields. Economics of Education Review, 29(6), 901–910. 10.1016/j.econedurev.2010.07.009 [DOI] [Google Scholar]
- Rainey, K. , Dancy, M. , Mickelson, R. , Stearns, E. , & Moller, S. (2018). Race and gender differences in how sense of belonging influences decisions to major in STEM. International Journal of STEM Education, 5(1), 10 10.1186/s40594-018-0115-6 [DOI] [PMC free article] [PubMed] [Google Scholar]
- Reardon, S. F. (2011). The widening academic achievement gap between the rich and the poor: New evidence and possible explanations 1 Newyork, NY: Russell Sage Foundation. [Google Scholar]
- Riegle‐Crumb, C. , King, B. , & Irizarry, Y. (2019). Does STEM stand out? Examining racial/ethnic gaps in persistence across postsecondary fields. Educational Researcher, 48(3), 133–144. 10.3102/0013189X19831006 [DOI] [PMC free article] [PubMed] [Google Scholar]
- Rodenbusch, S. E. , Hernandez, P. R. , Simmons, S. L. , & Dolan, E. L. (2016). Early engagement in course‐based research increases graduation rates and completion of science, engineering, and mathematics degrees. Cbe—life Sciences Education, 15(2), ar20 10.1187/cbe.16-03-0117 [DOI] [PMC free article] [PubMed] [Google Scholar]
- Salehi, S. , Cotner, S. , Azarin, S. M. , Carlson, E. E. , Driessen, M. , Ferry, V. E. , … Ballen, C. J. (2019). Gender performance gaps across different assessment methods and the underlying mechanisms: the case of incoming preparation and test anxiety. Paper presented at the Frontiers in Education. [Google Scholar]
- Schmader, T. , Whitehead, J. , & Wysocki, V. H. (2007). A linguistic comparison of letters of recommendation for male and female chemistry and biochemistry job applicants. Sex Roles, 57(7–8), 509–514. 10.1007/s11199-007-9291-4 [DOI] [PMC free article] [PubMed] [Google Scholar]
- Schultz, P. W. , Hernandez, P. R. , Woodcock, A. , Estrada, M. , Chance, R. C. , Aguilar, M. , & Serpe, R. T. (2011). Patching the pipeline: Reducing educational disparities in the sciences through minority training programs. Educational Evaluation and Policy Analysis, 33(1), 95–114. 10.3102/0162373710392371 [DOI] [PMC free article] [PubMed] [Google Scholar]
- Schunk, D. H. (1991). Self‐efficacy and academic motivation. Educational Psychologist, 26(3), 207–231. [DOI] [Google Scholar]
- Sege, R. , Nykiel‐Bub, L. , & Selk, S. (2015). Sex differences in institutional support for junior biomedical researchers. JAMA, 314(11), 1175–1177. 10.1001/jama.2015.8517 [DOI] [PubMed] [Google Scholar]
- Seidel, S. B. , Reggi, A. L. , Schinske, J. N. , Burrus, L. W. , & Tanner, K. D. (2015). Beyond the biology: A systematic investigation of noncontent instructor talk in an introductory biology course. Cbe—life Sciences Education, 14(4), ar43 10.1187/cbe.15-03-0049 [DOI] [PMC free article] [PubMed] [Google Scholar]
- Sheltzer, J. M. , & Smith, J. C. (2014). Elite male faculty in the life sciences employ fewer women. Proceedings of the National Academy of Sciences of the United States of America, 111(28), 10107–10112. 10.1073/pnas.1403334111 [DOI] [PMC free article] [PubMed] [Google Scholar]
- Sirin, S. R. (2005). Socioeconomic status and academic achievement: A meta‐analytic review of research. Review of Educational Research, 75(3), 417–453. 10.3102/00346543075003417 [DOI] [Google Scholar]
- Sullivan, L. L. , Ballen, C. J. , & Cotner, S. (2018). Small group gender ratios impact biology class performance and peer evaluations. PLoS ONE, 13(4), e0195129 10.1371/journal.pone.0195129 [DOI] [PMC free article] [PubMed] [Google Scholar]
- Tanner, K. D. (2009). Learning to see inequity in science. Cbe—life Sciences Education, 8(4), 265–270. 10.1187/cbe.09-09-0070 [DOI] [PMC free article] [PubMed] [Google Scholar]
- Tanner, K. D. (2013). Structure matters: Twenty‐one teaching strategies to promote student engagement and cultivate classroom equity. Cbe—life Sciences Education, 12(3), 322–331. 10.1187/cbe.13-06-0115 [DOI] [PMC free article] [PubMed] [Google Scholar]
- Thompson, S. K. , Neill, C. J. , Wiederhoeft, E. , & Cotner, S. (2016). A model for a course‐based undergraduate research experience (CURE) in a field setting. Journal of Microbiology and Biology Education, 17(3), 469. [DOI] [PMC free article] [PubMed] [Google Scholar]
- Torregosa, M. B. , Ynalvez, M. A. , & Morin, K. H. (2016). Perceptions matter: Faculty caring, campus racial climate and academic performance. Journal of Advanced Nursing, 72(4), 864–877. [DOI] [PubMed] [Google Scholar]
- Toven‐Lindsey, B. , Levis‐Fitzgerald, M. , Barber, P. H. , & Hasson, T. (2015). Increasing persistence in undergraduate science majors: A model for institutional support of underrepresented students. Cbe—life Sciences Education, 14(2), ar12 10.1187/cbe.14-05-0082 [DOI] [PMC free article] [PubMed] [Google Scholar]
- Van der Lee, R. , & Ellemers, N. (2015). Gender contributes to personal research funding success in The Netherlands. Proceedings of the National Academy of Sciences of the United States of America, 112(40), 12349–12353. 10.1073/pnas.1510159112 [DOI] [PMC free article] [PubMed] [Google Scholar]
- Van Dijk, D. , Manor, O. , & Carey, L. B. (2014). Publication metrics and success on the academic job market. Current Biology, 24(11), R516–R517. [DOI] [PubMed] [Google Scholar]
- Walton, G. M. , & Cohen, G. L. (2011). A brief social‐belonging intervention improves academic and health outcomes of minority students. Science, 331(6023), 1447–1451. [DOI] [PubMed] [Google Scholar]
- Weaver, G. C. , Russell, C. B. , & Wink, D. J. (2008). Inquiry‐based and research‐based laboratory pedagogies in undergraduate science. Nature Chemical Biology, 4(10), 577 10.1038/nchembio1008-577 [DOI] [PubMed] [Google Scholar]
- Weir, L. K. , Barker, M. K. , McDonnell, L. M. , Schimpf, N. G. , Rodela, T. M. , & Schulte, P. M. (2019). Small changes, big gains: A curriculum‐wide study of teaching practices and student learning in undergraduate biology. PLoS ONE, 14(8), e0220900 10.1371/journal.pone.0220900 [DOI] [PMC free article] [PubMed] [Google Scholar]
- Wilson, Z. S. , Holmes, L. , DeGravelles, K. , Sylvain, M. R. , Batiste, L. , Johnson, M. , … Warner, I. M. (2012). Hierarchical mentoring: A transformative strategy for improving diversity and retention in undergraduate STEM disciplines. Journal of Science Education and Technology, 21(1), 148–156. 10.1007/s10956-011-9292-5 [DOI] [Google Scholar]
- Yeager, D. S. , Walton, G. M. , Brady, S. T. , Akcinar, E. N. , Paunesku, D. , Keane, L. , … Dweck, C. S. (2016). Teaching a lay theory before college narrows achievement gaps at scale. Proceedings of the National Academy of Sciences of the United States of America, 113(24), E3341–E3348. 10.1073/pnas.1524360113 [DOI] [PMC free article] [PubMed] [Google Scholar]
Associated Data
This section collects any data citations, data availability statements, or supplementary materials included in this article.
Supplementary Materials
Supplementary Material
Data Availability Statement
Aggregate data are archived in the publicly accessible repository Dryad at https://doi.org/10.7291/D1DM3P.